- 1-888-253-3960
- enquiry@vynzresearch.com
-
This is lorem ipsum doller
Asia Electric Two-Wheeler Market
| Status : Published | Published On : Dec, 2023 | Report Code : VRAT4052 | Industry : Automotive & Transportation | Available Format :

|
Page : 107 |
Asia Electric Two-Wheeler Market – Analysis and Forecast (2025-2030)
Industry Insights by Product (E-scooters, E-bikes, E-motorcycles, Others), by Battery Type (Sealed Lead Acid, Li-ion, Ni-MH), by Battery Technology (Removable Battery, Non-removable Battery), by Voltage (24V, 36V, 48V, 60V, 72V)
Industry Overview
The Asian Electric Two-Wheeler Market is predicted to grow at 7.5% CAGR during the forecast period with its fleet size reaching 0.062 billion units by 2030. The Asian market is primarily driven by technological advancements in battery technology, government support and initiatives for electric vehicles, and increasing awareness for curbing vehicular emissions. Different products including e-scooters and e-bikes are majorly contributing to the electric two-wheeler market size in Asia. The market has witnessed significant demand for these products over the last few years with the increasing disposable income and rapid urbanization.
Market Segmentation
Insight by Product
Based on product, the market is categorized into e-scooters, e-bikes, e-motorcycles, and others. E-scooters held the largest share of more than 55% in the Asian electric two-wheeler market in terms of fleet size. The increasing popularity of electric scooters among the younger generation especially working professionals and students leads to the largest share of the category.
Insight by Battery Type
On the basis of battery type, the market is segmented into sealed lead acid, Li-ion, and NiMH. Of all, sealed lead acid is the most common type of battery used in electric two-wheelers in Asia. The highest share of sealed lead acid batteries in the market is due to the lower prices and high output of these batteries.
Insight by Battery Technology
On the basis of battery technology, the market is categorized into removable batteries and non-removable batteries. Of both categories, non-removable batteries are majorly used in the market as it is convenient for electric two-wheelers to plug in and charge batteries instead of removing and charging indoors.
Insight by Voltage
Based on voltage, the market is segmented into 24V, 36V, 48V, 60V, 72V. Of all, 48V electric two-wheeler holds the largest share in the Asian electric two-wheeler market, followed by 36V two-wheelers. Most of the e-rickshaws and e-scooters are being developed with a battery of 48V thus leading to the largest share of the category.
Asia Electric Two-Wheeler Market Report Coverage
|
Report Metric |
Details |
|
Historical Period |
2018 - 2023 |
|
Base Year Considered |
2024 |
|
Forecast Period |
2025 - 2030 |
|
Market Size in 2023 |
U.S.D. XXXX Units |
|
Revenue Forecast in 2030 |
U.S.D. 0.062 Units |
|
Growth Rate |
7.5% |
|
Segments Covered in the Report |
By Product, By Battery Type, By Battery Technology,By Voltage |
|
Report Scope |
Market Trends, Drivers, and Restraints; Revenue Estimation and Forecast; Segmentation Analysis; Impact of COVID-19; Companies’ Strategic Developments; Market Share Analysis of Key Players; Company Profiling |
|
Regions Covered in the Report |
China,India, By Indonesia,Thailand,Malaysia,Philippines,Vietnam |
Industry Dynamics
ASIA ELECTRIC TWO-WHEELERS MARKET HIGHLIGHT

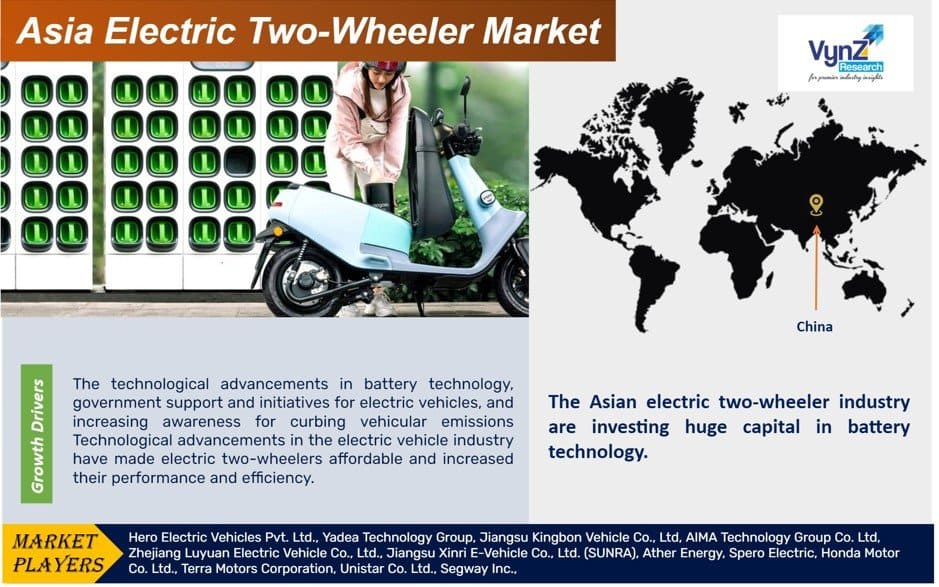
The technological advancements in battery technology, government support and initiatives for electric vehicles, and increasing awareness for curbing vehicular emissions Technological advancements in the electric vehicle industry have made electric two-wheelers affordable and increased their performance and efficiency. The major reason for the affordable prices of electric scooters and bikes is the advancement in battery technology. The decline in electric vehicle battery cost has an overall impact on the cost of an electric vehicle. OEMs are investing capital in research and development to further increase the efficiency of the electric battery along with reducing their cost. Most of the light electric vehicles run on lithium-ion batteries, for which manufacturers are researching to increase its charging capacity.
However, the cost of battery, lack of adequate charging infrastructure and competition from gasoline-driven two-wheelers are the key factors hindering the growth of the Asian electric two-wheelers market.
Competitive Insight
Market players in the Asian electric two-wheeler industry are investing huge capital in battery technology, motor technology, and capacity expansion in order to cater to rising demand. In July 2017, Hitachi Automotive Systems, Ltd. And Honda Motor Co. Ltd. announced the establishment of a joint venture company for the development, manufacture, and sales of motors for electric vehicles on the premises of Hitachi Automotive Systems in Hitachinaka-shi, Ibaraki Prefecture. Hitachi has a 51 percent investment in the venture whereas Honda has a 49 percent investment in the venture.
Hero Electric Vehicles Pvt. Ltd., Yadea Technology Group, Jiangsu Kingbon Vehicle Co., Ltd, AIMA Technology Group Co. Ltd, Zhejiang Luyuan Electric Vehicle Co., Ltd., Jiangsu Xinri E-Vehicle Co., Ltd. (SUNRA), Ather Energy, Spero Electric, Honda Motor Co. Ltd., Terra Motors Corporation, Unistar Co. Ltd., Segway Inc., UDA Motor Co. Ltd, Ningbo MYWAY Intelligent Technology Co. Ltd, Viar Motor Indonesia, Zero Motorcycles Inc., Xiaomi Inc., and Lohia Auto Industries are some of the key players operating in the Asian electric two-wheelers market.
The Asia Electric Two-Wheeler Market report offers a comprehensive market segmentation analysis along with an estimation for the forecast period 2025–2030.
Segments Covered in the Report
- Product
- E-scooters
- E-bikes
- E-motorcycles
- Others
- Battery Type
- Sealed Lead Acid
- Li-ion
- Ni-MH
- Technology
- Plugin
- Battery
- Voltage
- 24V
- 36V
- 48V
- 60V
- 72V
- Country
- China
- India
- Indonesia
- Thailand
- Malaysia
- Philippines
- Vietnam
PRIMARY RESEARCH INTERVIEWS - BREAKDOWN

1. Research Overview
1.1. The Report Offers
1.2. Market Coverage
1.2.1. By Product
1.2.2. By Battery Type
1.2.3. By Battery Technology
1.2.4. By Voltage
1.2.5. By Country
1.3. Research Phases
1.4. Limitations
1.5. Market Size Estimations and Forecast
1.5.1. Data Sources
1.5.1.1. Primary Research
1.5.1.2. Secondary Research
1.5.2. Methodology
1.5.2.1. Data Exploration
1.5.2.2. Forecast Parameters
1.5.2.3. Data Validation
1.5.2.4. Assumptions
1.5.3. Study Period & Data Reporting Unit
2. Executive Summary
3. Market Definition
3.1. By Product
3.1.1. E-Scooters
3.1.2. E-Bikes
3.1.3. E-Motorbikes
3.1.4. Others
3.2. By Battery Type
3.2.1. Sealed Lead Acid
3.2.2. Li-ion
3.2.3. Ni-MH
3.3. By Battery Technology
3.3.1. Non-removable/Plugin
3.3.2. Removable
3.4. By Voltage
3.4.1. 24V
3.4.2. 36V
3.4.3. 48V
3.4.4. 60V
3.4.5. 72V
4. Industry Overview
4.1. Industry Dynamics
4.1.1. Major Drivers
4.1.2. Major Restraints
4.1.3. Key Trends
4.1.4. Key Opportunities
4.2. Industry Ecosystem
4.2.1. Value Chain Analysis
4.2.2. Regulatory Framework
4.3. Competitive Insight
4.3.1. Competitive Analysis of Key Players
4.3.2. Market Attractive Analysis
5. Asia Market Estimate and Forecast
5.1. By Product
5.2. By Battery Type
5.3. By Battery Technology
5.4. By Voltage
6. China Market Estimate and Forecast
6.1. By Product
6.2. By Battery Type
6.3. By Battery Technology
6.4. By Voltage
7. India Market Estimate and Forecast
7.1. By Product
7.2. By Battery Type
7.3. By Battery Technology
7.4. By Voltage
8. Indonesia Market Estimate and Forecast
8.1. By Product
8.2. By Battery Type
8.3. By Battery Technology
8.4. By Voltage
9. Thailand Market Estimate and Forecast
9.1. By Product
9.2. By Battery Type
9.3. By Battery Technology
9.4. By Voltage
10. Malaysia Market Estimate and Forecast
10.1. By Product
10.2. By Battery Type
10.3. By Battery Technology
10.4. By Voltage
11. Philippines Market Estimate and Forecast
11.1. By Product
11.2. By Battery Type
11.3. By Battery Technology
11.4. By Voltage
12. Vietnam Market Estimate and Forecast
12.1. By Product
12.2. By Battery Type
12.3. By Battery Technology
12.4. By Voltage
13. Company Profiles
13.1. Hero Electric Vehicles Pvt. Ltd.
13.1.1. Snapshot
13.1.2. Overview
13.1.3. Offerings
13.1.4. Financial Insight
13.1.5. Recent Developments
13.2. Yadea Technology Group
13.2.1. Snapshot
13.2.2. Overview
13.2.3. Offerings
13.2.4. Financial Insight
13.2.5. Recent Developments
13.3. Jiangsu Kingbon Vehicle Co., Ltd
13.3.1. Snapshot
13.3.2. Overview
13.3.3. Offerings
13.3.4. Financial Insight
13.3.5. Recent Developments
13.4. AIMA Technology Group Co. Ltd
13.4.1. Snapshot
13.4.2. Overview
13.4.3. Offerings
13.4.4. Financial Insight
13.4.5. Recent Developments
13.5. Zhejiang Luyuan Electric Vehicle Co., Ltd.
13.5.1. Snapshot
13.5.2. Overview
13.5.3. Offerings
13.5.4. Financial Insight
13.5.5. Recent Developments
13.6. Jiangsu Xinri E-Vehicle Co., Ltd. (SUNRA)
13.6.1. Snapshot
13.6.2. Overview
13.6.3. Offerings
13.6.4. Financial Insight
13.6.5. Recent Developments
13.7. Ather Energy
13.7.1. Snapshot
13.7.2. Overview
13.7.3. Offerings
13.7.4. Financial Insight
13.7.5. Recent Developments
13.8. Spero Electric
13.8.1. Snapshot
13.8.2. Overview
13.8.3. Offerings
13.8.4. Financial Insight
13.8.5. Recent Developments
13.9. Honda Motor Co. Ltd.
13.9.1. Snapshot
13.9.2. Overview
13.9.3. Offerings
13.9.4. Financial Insight
13.9.5. Recent Developments
13.10. Terra Motors Corporation
13.10.1. Snapshot
13.10.2. Overview
13.10.3. Offerings
13.10.4. Financial Insight
13.10.5. Recent Developments
13.11. Unistar Co. Ltd.
13.11.1. Snapshot
13.11.2. Overview
13.11.3. Offerings
13.11.4. Financial Insight
13.11.5. Recent Developments
13.12. Segway Inc.
13.12.1. Snapshot
13.12.2. Overview
13.12.3. Offerings
13.12.4. Financial Insight
13.12.5. Recent Developments
13.13. UDA Motor Co. Ltd.
13.13.1. Snapshot
13.13.2. Overview
13.13.3. Offerings
13.13.4. Financial Insight
13.13.5. Recent Developments
13.14. Ningbo MYWAY Intelligent Technology Co. Ltd.
13.14.1. Snapshot
13.14.2. Overview
13.14.3. Offerings
13.14.4. Financial Insight
13.14.5. Recent Developments
13.15. Viar Motor Indonesia
13.15.1. Snapshot
13.15.2. Overview
13.15.3. Offerings
13.15.4. Financial Insight
13.15.5. Recent Developments
13.16. Zero Motorcycles Inc.
13.16.1. Snapshot
13.16.2. Overview
13.16.3. Offerings
13.16.4. Financial Insight
13.16.5. Recent Developments
13.17. Xiaomi Inc.
13.17.1. Snapshot
13.17.2. Overview
13.17.3. Offerings
13.17.4. Financial Insight
13.17.5. Recent Developments
13.18. Lohia Auto Industries
13.18.1. Snapshot
13.18.2. Overview
13.18.3. Offerings
13.18.4. Financial Insight
13.18.5. Recent Developments
14. Appendix
14.1. Exchange Rates
14.2. Abbreviations
Note: Financial insights and recent developments are subject to availability of information in secondary domain.
List of Tables
Table 1 Sources
Table 2 Study Periods
Table 3 Data Reporting Unit
Table 4 Asia Electric Two-Wheeler Market Size, By Product, units (2018 – 2023)
Table 5 Asia Electric Two-Wheeler Market Size, By Product, units (2025 – 2030)
Table 6 Asia Electric Two-Wheeler Market Size, By Product, USD Billion (2018 – 2023)
Table 7 Asia Electric Two-Wheeler Market Size, By Product, USD Billion (2025 – 2030)
Table 8 Asia Electric Two-Wheeler Market Size, By Battery Type, units (2018 – 2023)
Table 9 Asia Electric Two-Wheeler Market Size, By Battery Type, units (2025 – 2030)
Table 10 Asia Electric Two-Wheeler Market Size, By Battery Type, USD Billion (2018 – 2023)
Table 11 Asia Electric Two-Wheeler Market Size, By Battery Type, USD Billion (2025 – 2030)
Table 12 Asia Electric Two-Wheeler Market Size, By Technology, units (2018 – 2023)
Table 13 Asia Electric Two-Wheeler Market Size, By Technology, units (2025 – 2030)
Table 14 Asia Electric Two-Wheeler Market Size, By Technology, USD Billion (2018 – 2023)
Table 15 Asia Electric Two-Wheeler Market Size, By Technology, USD Billion (2025 – 2030)
Table 16 Asia Electric Two-Wheeler Market Size, By Voltage, units (2018 – 2023)
Table 17 Asia Electric Two-Wheeler Market Size, By Voltage, units (2025 – 2030)
Table 18 Asia Electric Two-Wheeler Market Size, By Voltage, USD Billion (2018 – 2023)
Table 19 Asia Electric Two-Wheeler Market Size, By Voltage, USD Billion (2025 – 2030)
Table 20 China Electric Two-Wheeler Market Size, By Product, units (2018 – 2023)
Table 21 China Electric Two-Wheeler Market Size, By Product, units (2025 – 2030)
Table 22 China Electric Two-Wheeler Market Size, By Product, USD Billion (2018 – 2023)
Table 23 China Electric Two-Wheeler Market Size, By Product, USD Billion (2025 – 2030)
Table 24 China Electric Two-Wheeler Market Size, By Battery Type, units (2018 – 2023)
Table 25 China Electric Two-Wheeler Market Size, By Battery Type, units (2025 – 2030)
Table 26 China Electric Two-Wheeler Market Size, By Battery Type, USD Billion (2018 – 2023)
Table 27 China Electric Two-Wheeler Market Size, By Battery Type, USD Billion (2025 – 2030)
Table 28 China Electric Two-Wheeler Market Size, By Technology, units (2018 – 2023)
Table 29 China Electric Two-Wheeler Market Size, By Technology, units (2025 – 2030)
Table 30 China Electric Two-Wheeler Market Size, By Technology, USD Billion (2018 – 2023)
Table 31 China Electric Two-Wheeler Market Size, By Technology, USD Billion (2025 – 2030)
Table 32 China Electric Two-Wheeler Market Size, By Voltage, units (2018 – 2023)
Table 33 China Electric Two-Wheeler Market Size, By Voltage, units (2025 – 2030)
Table 34 China Electric Two-Wheeler Market Size, By Voltage, USD Billion (2018 – 2023)
Table 35 China Electric Two-Wheeler Market Size, By Voltage, USD Billion (2025 – 2030)
Table 36 India Electric Two-Wheeler Market Size, By Product, units (2018 – 2023)
Table 37 India Electric Two-Wheeler Market Size, By Product, units (2025 – 2030)
Table 38 India Electric Two-Wheeler Market Size, By Product, USD Billion (2018 – 2023)
Table 39 India Electric Two-Wheeler Market Size, By Product, USD Billion (2025 – 2030)
Table 40 India Electric Two-Wheeler Market Size, By Battery Type, units (2018 – 2023)
Table 41 India Electric Two-Wheeler Market Size, By Battery Type, units (2025 – 2030)
Table 42 India Electric Two-Wheeler Market Size, By Battery Type, USD Billion (2018 – 2023)
Table 43 India Electric Two-Wheeler Market Size, By Battery Type, USD Billion (2025 – 2030)
Table 44 India Electric Two-Wheeler Market Size, By Technology, units (2018 – 2023)
Table 45 India Electric Two-Wheeler Market Size, By Technology, units (2025 – 2030)
Table 46 India Electric Two-Wheeler Market Size, By Technology, USD Billion (2018 – 2023)
Table 47 India Electric Two-Wheeler Market Size, By Technology, USD Billion (2025 – 2030)
Table 48 India Electric Two-Wheeler Market Size, By Voltage, units (2018 – 2023)
Table 49 India Electric Two-Wheeler Market Size, By Voltage, units (2025 – 2030)
Table 50 India Electric Two-Wheeler Market Size, By Voltage, USD Billion (2018 – 2023)
Table 51 India Electric Two-Wheeler Market Size, By Voltage, USD Billion (2025 – 2030)
Table 52 Indonesia Electric Two-Wheeler Market Size, By Product, units (2018 – 2023)
Table 53 Indonesia Electric Two-Wheeler Market Size, By Product, units (2025 – 2030)
Table 54 Indonesia Electric Two-Wheeler Market Size, By Product, USD Billion (2018 – 2023)
Table 55 Indonesia Electric Two-Wheeler Market Size, By Product, USD Billion (2025 – 2030)
Table 56 Indonesia Electric Two-Wheeler Market Size, By Battery Type, units (2018 – 2023)
Table 57 Indonesia Electric Two-Wheeler Market Size, By Battery Type, units (2025 – 2030)
Table 58 Indonesia Electric Two-Wheeler Market Size, By Battery Type, USD Billion (2018 – 2023)
Table 59 Indonesia Electric Two-Wheeler Market Size, By Battery Type, USD Billion (2025 – 2030)
Table 60 Indonesia Electric Two-Wheeler Market Size, By Technology, units (2018 – 2023)
Table 61 Indonesia Electric Two-Wheeler Market Size, By Technology, units (2025 – 2030)
Table 62 Indonesia Electric Two-Wheeler Market Size, By Technology, USD Billion (2018 – 2023)
Table 63 Indonesia Electric Two-Wheeler Market Size, By Technology, USD Billion (2025 – 2030)
Table 64 Indonesia Electric Two-Wheeler Market Size, By Voltage, units (2018 – 2023)
Table 65 Indonesia Electric Two-Wheeler Market Size, By Voltage, units (2025 – 2030)
Table 66 Indonesia Electric Two-Wheeler Market Size, By Voltage, USD Billion (2018 – 2023)
Table 67 Indonesia Electric Two-Wheeler Market Size, By Voltage, USD Billion (2025 – 2030)
Table 68 Thailand Electric Two-Wheeler Market Size, By Product, units (2018 – 2023)
Table 69 Thailand Electric Two-Wheeler Market Size, By Product, units (2025 – 2030)
Table 70 Thailand Electric Two-Wheeler Market Size, By Product, USD Billion (2018 – 2023)
Table 71 Thailand Electric Two-Wheeler Market Size, By Product, USD Billion (2025 – 2030)
Table 72 Thailand Electric Two-Wheeler Market Size, By Battery Type, units (2018 – 2023)
Table 73 Thailand Electric Two-Wheeler Market Size, By Battery Type, units (2025 – 2030)
Table 74 Thailand Electric Two-Wheeler Market Size, By Battery Type, USD Billion (2018 – 2023)
Table 75 Thailand Electric Two-Wheeler Market Size, By Battery Type, USD Billion (2025 – 2030)
Table 76 Thailand Electric Two-Wheeler Market Size, By Technology, units (2018 – 2023)
Table 77 Thailand Electric Two-Wheeler Market Size, By Technology, units (2025 – 2030)
Table 78 Thailand Electric Two-Wheeler Market Size, By Technology, USD Billion (2018 – 2023)
Table 79 Thailand Electric Two-Wheeler Market Size, By Technology, USD Billion (2025 – 2030)
Table 80 Thailand Electric Two-Wheeler Market Size, By Voltage, units (2018 – 2023)
Table 81 Thailand Electric Two-Wheeler Market Size, By Voltage, units (2025 – 2030)
Table 82 Thailand Electric Two-Wheeler Market Size, By Voltage, USD Billion (2018 – 2023)
Table 83 Thailand Electric Two-Wheeler Market Size, By Voltage, USD Billion (2025 – 2030)
Table 84 Malaysia Electric Two-Wheeler Market Size, By Product, units (2018 – 2023)
Table 85 Malaysia Electric Two-Wheeler Market Size, By Product, units (2025 – 2030)
Table 86 Malaysia Electric Two-Wheeler Market Size, By Product, USD Billion (2018 – 2023)
Table 87 Malaysia Electric Two-Wheeler Market Size, By Product, USD Billion (2025 – 2030)
Table 88 Malaysia Electric Two-Wheeler Market Size, By Battery Type, units (2018 – 2023)
Table 89 Malaysia Electric Two-Wheeler Market Size, By Battery Type, units (2025 – 2030)
Table 90 Malaysia Electric Two-Wheeler Market Size, By Battery Type, USD Billion (2018 – 2023)
Table 91 Malaysia Electric Two-Wheeler Market Size, By Battery Type, USD Billion (2025 – 2030)
Table 92 Malaysia Electric Two-Wheeler Market Size, By Technology, units (2018 – 2023)
Table 93 Malaysia Electric Two-Wheeler Market Size, By Technology, units (2025 – 2030)
Table 94 Malaysia Electric Two-Wheeler Market Size, By Technology, USD Billion (2018 – 2023)
Table 95 Malaysia Electric Two-Wheeler Market Size, By Technology, USD Billion (2025 – 2030)
Table 96 Malaysia Electric Two-Wheeler Market Size, By Voltage, units (2018 – 2023)
Table 97 Malaysia Electric Two-Wheeler Market Size, By Voltage, units (2025 – 2030)
Table 98 Malaysia Electric Two-Wheeler Market Size, By Voltage, USD Billion (2018 – 2023)
Table 99 Malaysia Electric Two-Wheeler Market Size, By Voltage, USD Billion (2025 – 2030)
Table 100 Philippines Electric Two-Wheeler Market Size, By Product, units (2018 – 2023)
Table 101 Philippines Electric Two-Wheeler Market Size, By Product, units (2025 – 2030)
Table 102 Philippines Electric Two-Wheeler Market Size, By Product, USD Billion (2018 – 2023)
Table 103 Philippines Electric Two-Wheeler Market Size, By Product, USD Billion (2025 – 2030)
Table 104 Philippines Electric Two-Wheeler Market Size, By Battery Type, units (2018 – 2023)
Table 105 Philippines Electric Two-Wheeler Market Size, By Battery Type, units (2025 – 2030)
Table 106 Philippines Electric Two-Wheeler Market Size, By Battery Type, USD Billion (2018 – 2023)
Table 107 Philippines Electric Two-Wheeler Market Size, By Battery Type, USD Billion (2025 – 2030)
Table 108 Philippines Electric Two-Wheeler Market Size, By Technology, units (2018 – 2023)
Table 109 Philippines Electric Two-Wheeler Market Size, By Technology, units (2025 – 2030)
Table 110 Philippines Electric Two-Wheeler Market Size, By Technology, USD Billion (2018 – 2023)
Table 111 Philippines Electric Two-Wheeler Market Size, By Technology, USD Billion (2025 – 2030)
Table 112 Philippines Electric Two-Wheeler Market Size, By Voltage, units (2018 – 2023)
Table 113 Philippines Electric Two-Wheeler Market Size, By Voltage, units (2025 – 2030)
Table 114 Philippines Electric Two-Wheeler Market Size, By Voltage, USD Billion (2018 – 2023)
Table 115 Philippines Electric Two-Wheeler Market Size, By Voltage, USD Billion (2025 – 2030)
Table 116 Vietnam Electric Two-Wheeler Market Size, By Product, units (2018 – 2023)
Table 117 Vietnam Electric Two-Wheeler Market Size, By Product, units (2025 – 2030)
Table 118 Vietnam Electric Two-Wheeler Market Size, By Product, USD Billion (2018 – 2023)
Table 119 Vietnam Electric Two-Wheeler Market Size, By Product, USD Billion (2025 – 2030)
Table 120 Vietnam Electric Two-Wheeler Market Size, By Battery Type, units (2018 – 2023)
Table 121 Vietnam Electric Two-Wheeler Market Size, By Battery Type, units (2025 – 2030)
Table 122 Vietnam Electric Two-Wheeler Market Size, By Battery Type, USD Billion (2018 – 2023)
Table 123 Vietnam Electric Two-Wheeler Market Size, By Battery Type, USD Billion (2025 – 2030)
Table 124 Vietnam Electric Two-Wheeler Market Size, By Technology, units (2018 – 2023)
Table 125 Vietnam Electric Two-Wheeler Market Size, By Technology, units (2025 – 2030)
Table 126 Vietnam Electric Two-Wheeler Market Size, By Technology, USD Billion (2018 – 2023)
Table 127 Vietnam Electric Two-Wheeler Market Size, By Technology, USD Billion (2025 – 2030)
Table 128 Vietnam Electric Two-Wheeler Market Size, By Voltage, units (2018 – 2023)
Table 129 Vietnam Electric Two-Wheeler Market Size, By Voltage, units (2025 – 2030)
Table 130 Vietnam Electric Two-Wheeler Market Size, By Voltage, USD Billion (2018 – 2023)
Table 131 Vietnam Electric Two-Wheeler Market Size, By Voltage, USD Billion (2025 – 2030)
Table 132 Snapshot – Hero Electric Vehicles Pvt. Ltd.
Table 133 Snapshot – Yadea Technology Group
Table 134 Snapshot – Jiangsu Kingbon Vehicle Co., Ltd
Table 135 Snapshot – AIMA Technology Group Co. Ltd
Table 136 Snapshot – Zhejiang Luyuan Electric Vehicle Co., Ltd.
Table 137 Snapshot – Jiangsu Xinri E-Vehicle Co., Ltd. (SUNRA)
Table 138 Snapshot – Ather Energy
Table 139 Snapshot – Spero Electric
Table 140 Snapshot – Honda Motor Co. Ltd.
Table 141 Snapshot – Terra Motors Corporation
Table 142 Snapshot – Unistar Co. Ltd.
Table 142 Snapshot – Segway Inc.
Table 142 Snapshot – UDA Motor Co. Ltd.
Table 142 Snapshot – Ningbo MYWAY Intelligent Technology Co. Ltd.
Table 142 Snapshot – Viar Motor Indonesia
Table 142 Snapshot – Viar Motor Indonesia
Table 142 Snapshot – Xiaomi Inc.
Table 142 Snapshot – Lohia Auto Industries
List of Figures
Figure 1 Market Coverage
Figure 2 Research Phases
Figure 3 Secondary Sources for Different Parameters
Figure 4 Methodology
Figure 5 Data Mining & Exploration
Figure 6 Data Triangulation
Figure 7 Assumptions for Market Estimation and Forecast
Figure 8 Vietnam Electric Two-Wheeler Market - Growth Drivers and Restraints
Figure 9 Value Chain Analysis
Figure 10 Competitive Benchmarking
Figure 11 Asia Electric Two-Wheeler Market Highlight
Figure 12 Asia Electric Two-Wheeler Market Size, By Product, units (2018 - 2030)
Figure 13 Asia Electric Two-Wheeler Market Size, By Product, USD Billion (2018 - 2030)
Figure 14 Asia Electric Two-Wheeler Market Size, By Battery Type, units (2018 - 2030)
Figure 15 Asia Electric Two-Wheeler Market Size, By Battery Type, USD Billion (2018 - 2030)
Figure 16 Asia Electric Two-Wheeler Market Size, By Technology, units (2018 - 2030)
Figure 17 Asia Electric Two-Wheeler Market Size, By Technology, USD Billion (2018 - 2030)
Figure 18 Asia Electric Two-Wheeler Market Size, By Voltage, units (2018 - 2030)
Figure 19 Asia Electric Two-Wheeler Market Size, By Voltage, USD Billion (2018 - 2030)
Figure 20 China Electric Two-Wheeler Market Highlight
Figure 21 China Electric Two-Wheeler Market Size, By Product, units (2018 - 2030)
Figure 22 China Electric Two-Wheeler Market Size, By Product, USD Billion (2018 - 2030)
Figure 23 China Electric Two-Wheeler Market Size, By Battery Type, units (2018 - 2030)
Figure 24 China Electric Two-Wheeler Market Size, By Battery Type, USD Billion (2018 - 2030)
Figure 25 China Electric Two-Wheeler Market Size, By Technology, units (2018 - 2030)
Figure 26 China Electric Two-Wheeler Market Size, By Technology, USD Billion (2018 - 2030)
Figure 27 China Electric Two-Wheeler Market Size, By Voltage, units (2018 - 2030)
Figure 28 China Electric Two-Wheeler Market Size, By Voltage, USD Billion (2018 - 2030)
Figure 29 India Electric Two-Wheeler Market Highlight
Figure 30 India Electric Two-Wheeler Market Size, By Product, units (2018 - 2030)
Figure 31 India Electric Two-Wheeler Market Size, By Product, USD Billion (2018 - 2030)
Figure 32 India Electric Two-Wheeler Market Size, By Battery Type, units (2018 - 2030)
Figure 33 India Electric Two-Wheeler Market Size, By Battery Type, USD Billion (2018 - 2030)
Figure 34 India Electric Two-Wheeler Market Size, By Technology, units (2018 - 2030)
Figure 35 India Electric Two-Wheeler Market Size, By Technology, USD Billion (2018 - 2030)
Figure 36 India Electric Two-Wheeler Market Size, By Voltage, units (2018 - 2030)
Figure 37 India Electric Two-Wheeler Market Size, By Voltage, USD Billion (2018 - 2030)
Figure 38 India Electric Two-Wheeler Market Highlight
Figure 39 Indonesia Electric Two-Wheeler Market Size, By Product, units (2018 - 2030)
Figure 40 Indonesia Electric Two-Wheeler Market Size, By Product, USD Billion (2018 - 2030)
Figure 41 Indonesia Electric Two-Wheeler Market Size, By Battery Type, units (2018 - 2030)
Figure 42 Indonesia Electric Two-Wheeler Market Size, By Battery Type, USD Billion (2018 - 2030)
Figure 43 Indonesia Electric Two-Wheeler Market Size, By Technology, units (2018 - 2030)
Figure 44 Indonesia Electric Two-Wheeler Market Size, By Technology, USD Billion (2018 - 2030)
Figure 45 Indonesia Electric Two-Wheeler Market Size, By Voltage, units (2018 - 2030)
Figure 46 Indonesia Electric Two-Wheeler Market Size, By Voltage, USD Billion (2018 - 2030)
Figure 47 Thailand Electric Two-Wheeler Market Highlight
Figure 48 Thailand Electric Two-Wheeler Market Size, By Product, units (2018 - 2030)
Figure 49 Thailand Electric Two-Wheeler Market Size, By Product, USD Billion (2018 - 2030)
Figure 50 Thailand Electric Two-Wheeler Market Size, By Battery Type, units (2018 - 2030)
Figure 51 Thailand Electric Two-Wheeler Market Size, By Battery Type, USD Billion (2018 - 2030)
Figure 52 Thailand Electric Two-Wheeler Market Size, By Technology, units (2018 - 2030)
Figure 53 Thailand Electric Two-Wheeler Market Size, By Technology, USD Billion (2018 - 2030)
Figure 54 Thailand Electric Two-Wheeler Market Size, By Voltage, units (2018 - 2030)
Figure 55 Thailand Electric Two-Wheeler Market Size, By Voltage, USD Billion (2018 - 2030)
Figure 56 Malaysia Electric Two-Wheeler Market Highlight
Figure 57 Malaysia Electric Two-Wheeler Market Size, By Product, units (2018 - 2030)
Figure 58 Malaysia Electric Two-Wheeler Market Size, By Product, USD Billion (2018 - 2030)
Figure 59 Malaysia Electric Two-Wheeler Market Size, By Battery Type, units (2018 - 2030)
Figure 60 Malaysia Electric Two-Wheeler Market Size, By Battery Type, USD Billion (2018 - 2030)
Figure 61 Malaysia Electric Two-Wheeler Market Size, By Technology, units (2018 - 2030)
Figure 62 Malaysia Electric Two-Wheeler Market Size, By Technology, USD Billion (2018 - 2030)
Figure 63 Malaysia Electric Two-Wheeler Market Size, By Voltage, units (2018 - 2030)
Figure 64 Malaysia Electric Two-Wheeler Market Size, By Voltage, USD Billion (2018 - 2030)
Figure 65 Philippines Electric Two-Wheeler Market Highlight
Figure 66 Philippines Electric Two-Wheeler Market Size, By Product, units (2018 - 2030)
Figure 67 Philippines Electric Two-Wheeler Market Size, By Product, USD Billion (2018 - 2030)
Figure 68 Philippines Electric Two-Wheeler Market Size, By Battery Type, units (2018 - 2030)
Figure 69 Philippines Electric Two-Wheeler Market Size, By Battery Type, USD Billion (2018 - 2030)
Figure 70 Philippines Electric Two-Wheeler Market Size, By Technology, units (2018 - 2030)
Figure 71 Philippines Electric Two-Wheeler Market Size, By Technology, USD Billion (2018 - 2030)
Figure 72 Philippines Electric Two-Wheeler Market Size, By Voltage, units (2018 - 2030)
Figure 73 Philippines Electric Two-Wheeler Market Size, By Voltage, USD Billion (2018 - 2030)
Figure 74 Vietnam Electric Two-Wheeler Market Highlight
Figure 75 Vietnam Electric Two-Wheeler Market Size, By Product, units (2018 - 2030)
Figure 76 Vietnam Electric Two-Wheeler Market Size, By Product, USD Billion (2018 - 2030)
Figure 77 Vietnam Electric Two-Wheeler Market Size, By Battery Type, units (2018 - 2030)
Figure 78 Vietnam Electric Two-Wheeler Market Size, By Battery Type, USD Billion (2018 - 2030)
Figure 79 Vietnam Electric Two-Wheeler Market Size, By Technology, units (2018 - 2030)
Figure 80 Vietnam Electric Two-Wheeler Market Size, By Technology, USD Billion (2018 - 2030)
Figure 81 Vietnam Electric Two-Wheeler Market Size, By Voltage, units (2018 - 2030)
Figure 82 Vietnam Electric Two-Wheeler Market Size, By Voltage, USD Billion (2018 - 2030)
Asia Electric Two-Wheelers Market Coverage
Product Insight and Forecast 2025-2030
- E-scooters
- E-bikes
- E-motorcycles
- Others
Battery Type Insight and Forecast 2025-2030
- Sealed Lead Acid
- Li-ion
- Ni-MH
Technology Insight and Forecast 2025-2030
- Plugin
- Battery
Voltage Insight and Forecast 2025-2030
- 24V
- 36V
- 48V
- 60V
- 72V
Country Insight and Forecast 2025-2030
- China
- India
- Indonesia
- Thailand
- Malaysia
- Philippines
- Vietnam
Vynz Research know in your business needs, you required specific answers pertaining to the market, Hence, our experts and analyst can provide you the customized research support on your specific needs.
After the purchase of current report, you can claim certain degree of free customization within the scope of the research.
Please let us know, how we can serve you better with your specific requirements to your research needs. Vynz research promises for quick reversal for your current business requirements.
- Hero Electric Vehicles Pvt. Ltd.
- Yadea Technology Group
- Jiangsu Kingbon Vehicle Co., Ltd.
- AIMA Technology Group Co. Ltd.
- Zhejiang Luyuan Electric Vehicle Co., Ltd.
- Jiangsu Xinri E-Vehicle Co., Ltd. (SUNRA)
- Ather Energy
- Spero Electric
- Honda Motor Co. Ltd.
- Terra Motors Corporation
- Unistar Co. Ltd.
- Segway Inc.
- UDA Motor Co. Ltd.
- Ningbo MYWAY Intelligent Technology Co. Ltd.
- Viar Motor Indonesia
- Zero Motorcycles Inc.
- Xiaomi Inc.
- Lohia Auto Industries
Place an order
Latest Report
Research Methodology
- Desk Research / Pilot Interviews
- Build Market Size Model
- Research and Analysis
- Final Deliverabvle
CONNECT WITH OUR SALES TEAM
- Toll-Free: 1 888 253 3960
- Phone: +91 9960 288 381
- Email: enquiry@vynzresearch.com
Asia Electric Two-Wheeler Market