Active Protection System Market – Analysis and Forecast (2025-2030)
Industry Insight by Kill System Type (kill system type, such as soft kill system, hard kill system and reactive armor), by Platform (ground, airborne and marine), by End-user type (bifurcated into defense and homeland security), and by Geography (North America, Europe, Asia-Pacific, South America, Middle East And Africa)
| Status : Published | Published On : Feb, 2024 | Report Code : VRAD12022 | Industry : Aerospace and Defense | Available Format :

|
Page : 195 |
Active Protection System Market – Analysis and Forecast (2025-2030)
Industry Insight by Kill System Type (kill system type, such as soft kill system, hard kill system and reactive armor), by Platform (ground, airborne and marine), by End-user type (bifurcated into defense and homeland security), and by Geography (North America, Europe, Asia-Pacific, South America, Middle East And Africa)
Active Protection System Market Overview
Global Active Protection System Market is projected to grow from USD 4.2 billion in 2023 to USD 5.7 billion by 2030 with a CAGR of 5.5% from 2025 to 2030.
Active Protection System (APS) is a type of defense system designed to protect military vehicles, such as tanks and armored vehicles, against arriving threats, including anti-tank missiles, rockets, and artillery shells. APS systems use a variety of techniques to detect and intercept incoming threats, such as radar, electro-optical sensors, and acoustic sensors. This system consists of three major components such as a sensor system, a processing system and a countermeasure system.
APS systems are made to make military vehicles more combat-survivable by identifying and removing threats before they may destroy the vehicle. Anti-tank missiles and other guided weapons play a vital role in modern warfare as they are deployed. A vehicle’s weight is the main obstruction in its mobility and speed in conventional passive armor systems, whereas in active protection systems the vehicle’s performance is not compromised as it is typically lighter and more compact. To improve the effectiveness, active protection systems are rapidly evolving with new and advanced technologies.
Market Segmentation
Insight by Kill System Type
The Active Protection System Market is segmented by kill system type, such as soft kill system, hard kill system and reactive armor. The soft kill systems dominated the market over the forecast period owing to their cost-effectiveness and greater relevance to military capabilities such as intelligence, surveillance, and investigation.
Insight by Platform
Based on platform, The Active Protection System Market is segregated ground, airborne and marine. Ground segment is anticipated to grow at the highest CAGR during the forecast period. Militaries around the world are concentrating on combating improvised explosive devices (IEDs). To secure the platform totally, active protection systems can be used with anti-IED technologies, such as double V-hulls, IED jammers, and others. These systems can be fitted with a variety of sensors, radars, decoys, chaffs, and weapon mountings, which makes them important for a wide range of land combat platforms around the world as they are scalable, dependable, and versatile.
Insight by End-user type
On the basis of its uses the Active Protection System Market is bifurcated into defense and homeland security. Defense segment dominated the market in terms of value in the active protection market as these systems are widely used to provide safety to armored fighting vehicles from enemy fire.
Global Active Protection System Market Report Coverage
|
Report Metric |
Details |
|
Historical Period |
2020 - 2024 |
|
Base Year Considered |
2025 |
|
Forecast Period |
2026 - 2035 |
|
Market Size in 2025 |
U.S.D. 4.2 Billion |
|
Revenue Forecast in 2035 |
U.S.D. 5.7 Billion |
|
Growth Rate |
5.5% |
|
Segments Covered in the Report |
By kill system type, by platform and by End-user type |
|
Report Scope |
Market Trends, Drivers, and Restraints; Revenue Estimation and Forecast; Segmentation Analysis; Companies’ Strategic Developments; Market Share Analysis of Key Players; Company Profiling |
|
Regions Covered in the Report |
North America, Europe, Asia-Pacific, South America, Middle East And Africa |
Industry Dynamics
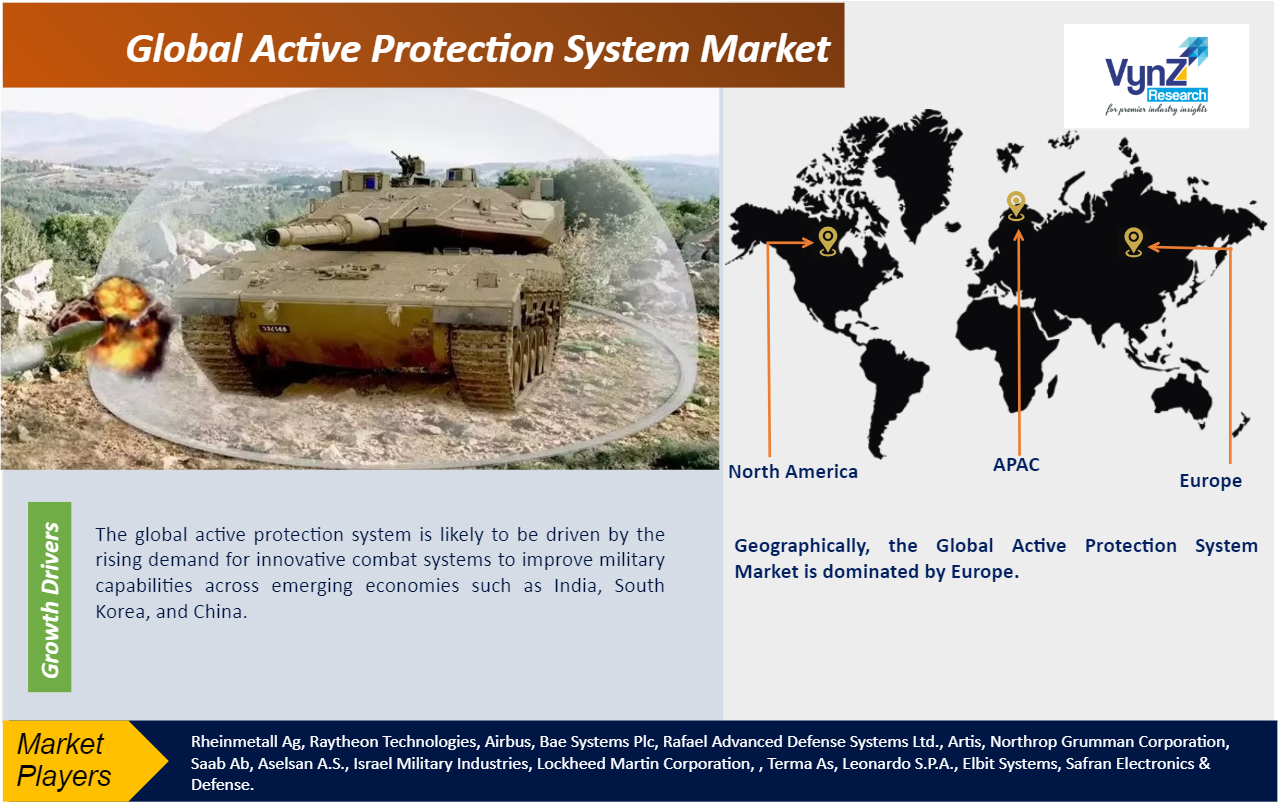
Growth Drivers
The global active protection system is likely to be driven by the rising demand for innovative combat systems to improve military capabilities across emerging economies such as India, South Korea, and China. Furthermore, rising demand for the building of a secure network against cyber-attacks, continued research and development efforts, considerable government and non-government organization investment, and favorable economic conditions are also driving the growth of the active protection market. Military spending among both developing and developed countries is rising, ultimately expanding the active protection systems market.
Restraints
Demand for defense products and APS-related services had a major impact as the European Union's reduced defense budget. Due to the national lockdown, reduction in defense spending and the suspension of APS production, the defense sector is facing serious challenges. Utilizing this kind of technology, military vehicles can better defend themselves. With the replacement of conventional equipment with an advanced active protection system in various armored vehicles, light-protected vehicles and light tanks that require maintenance costs, are hampering the industry growth. In addition, military aircraft have active defenses such as radar systems to track and identify threats which require a huge investment from R&D that can restrain the growth of the active protection system market.
Geographic Overview
-
North America
-
Europe
-
Asia Pacific (APAC)
-
South America
-
Middle East and Africa
Geographically, the global Active Protection System Market is dominated by Europe. The European region has a well-established defense procurement system, which enables countries to acquire the latest and most advanced APS systems. The European defense industry has been investing heavily in research and development for Active Protection Systems, leading to the development of technologically advanced systems. European companies like Rafael Advanced Defense Systems, Saab AB, and Rheinmetall AG are leading players in the APS market, offering a range of advanced systems to customers worldwide. The high demand for APS systems has boosted European companies to invest more in the development of these systems.
Key Players Covered in the Report
The Active Protection System market key players include Rheinmetall Ag, Raytheon Technologies, Airbus, Bae Systems Plc, Rafael Advanced Defense Systems Ltd., Artis, Northrop Grumman Corporation, Saab Ab, Aselsan A.S., Israel Military Industries, Lockheed Martin Corporation, , Terma As, Leonardo S.P.A., Elbit Systems, Safran Electronics & Defense.
Recent developments by Key Players
Raytheon, an RTX business, in support of the U.S. Army, completed a live-fire engagement using the advanced, 360-degree Lower Tier Air and Missile Defense Sensor, known as LTAMDS. This milestone is the latest event in a series of ongoing development tests for the radar which will culminate with an operational capability level by the end of the year. The test consisted of a cruise missile surrogate flying a representative threat trajectory. The target was acquired and tracked by LTAMDS, its track data was passed to the Integrated Battle Command System for launch command, and LTAMDS guided a PAC-3 missile to intercept.
Elbit Systems Ltd. Is awarded a contract worth $109 million to supply BAE Systems Hägglunds (Sweden) with the Iron Fist Active Protection System (APS) for its CV90 platform, for a European customer. The Iron Fist APS is characterized by low volume, weight, and power requirements. The system provides armored platforms with 360-degree protection from a wide variety of anti-armor threats, such as rocket-propelled grenades (RPG) and up to KE tank rounds in both open terrain and urban environments. The APS sensor combines the dual technologies of search-and-track radar and infra-red cameras with data fusion algorithms, allowing for rapid, reliable, and accurate threat detection, identification, and tracking. The system destroys threats by launching an explosive charge toward the incoming threat’s vicinity and exploding it to create a shock wave that deflects the threat at a safe distance from the protected platform.
The global Active Protection System Market report offers a comprehensive market segmentation analysis along with estimation for the forecast period 2025–2030.
Segments Covered in the Report
-
By Kill System Type
-
Soft Kill System
-
Hard Kill System
-
Reactive Armor
-
By Platform
-
Ground
-
Airborne
-
Marine
-
By Enduser type
-
Defence
-
Homeland Securities
Region Covered in the Report
-
North America
-
U.S.
-
Canada
-
Mexico
-
Europe
-
Germany
-
U.K.
-
France
-
Italy
-
Spain
-
Russia
-
Rest of Europe
-
Asia-Pacific (APAC)
-
China
-
Japan
-
South Korea
-
India
-
Australia
-
Rest of APAC
-
South America
-
Brazil
-
Argentina
-
Rest of South America
-
Middle East and Africa
-
Turkey
-
UAE
-
Saudi Arabia
-
South Africa
-
Rest of MEA
Primary Research Interviews Breakdown
%20System%20Market.png "Active Protection System Market Size")
Frequently Asked Questions
Purchase Options
Latest Report
Research Methodology
- Desk Research / Pilot Interviews
- Build Market Size Model
- Research and Analysis
- Final Deliverable
Connect With Our Sales Team
- Toll-Free: 1 888 253 3960
- Phone: +91 9960 288 381
- Email: enquiry@vynzresearch.com
Active Protection System Market