Global Armored Vehicle Market – Analysis and Forecast (2025-2030)

Industry Insight by Platform (Combat Vehicles, Combat Support Vehicles, and Unmanned Armored Ground Vehicles), by System (Engines, Drive Systems, Turret Drives, Ammunition Handling System, Fire Control System (FCS), Armaments, Ballistic Armor, Command & Control (C2) Systems, Countermeasure Systems, Navigation Systems, Power Systems, Hulls/Frames, and Observation & Display Systems), by Mode of Operation (Manned and Unmanned), by Mobility (Wheeled and Tracked), and Geography (U.S., Canada, Germany, U.K., France, China, Japan, India, and Rest of the World)

About This Report Status : Published Published On : Dec, 2022 Report Code : VRAD12018 Industry : Aerospace and Defense Available Format : Page : 225

Industry Overview

Report Description

The global armored vehicles market size is expected to reach USD 40.2 billion by 2030 from USD 25.5 billion in 2023. It is expected to grow at a 3.6% CAGR during the forecast period. Armored vehicles are military, commercial, or passenger vehicles that are fitted with partial or complete armor plating to protect from bullets, IEDs, missiles, weapons, shrapnel, shell fragments, or projectiles. Defense forces' armored vehicles can either move on continuous tracks or wheels and play a pivotal role when it comes to frontline combat, reconnaissance, and the modern battlefield. Some of the armored vehicles used by defense forces include infantry fighting vehicles, armored personnel vehicles, main battle tanks, etc. Also, some of the armored vehicles that are being adopted in commercial applications include armored SUVs, limousines, sedans, cash-in-transit vehicles, etc. Thus, the market is anticipated to expand due to the development of armored vehicles that are small, lightweight, durable, highly efficient, and ideal for defense activities.

Armored Vehicle Market

Reveal each market segment's real performance. Access comprehensive data and strategic insights.
Download PDF

Market Segmentation

Insight by Platform

Based on Platform, the global Armored Vehicle Market is segmented into Combat Vehicles, Combat Support Vehicles, and Unmanned Armored Ground Vehicles. The combat vehicles are further divided into Main Battle Tanks (MBTs), Infantry Fighting Vehicles (IFVs), Armored Personnel Carriers (APCs), Armored Amphibious Vehicles (AAVs), Light-Protected Vehicles (LPVs). Mine-Resistant Ambush Protected (MRAP), Air Defense Vehicles, and Self-Protected Howitzers (SPHs). The combat support vehicles are further divided into Armored Supply Tanks, Repair and Recovery Machines, Bridge-Laying Tanks, Mine Clearance Vehicles, and Armored Command & Control Vehicles.

Combat Vehicles dominate the market and are anticipated to grow significantly during the forecast period as these vehicles are frequently deployed in military operations and ensure safety in situations of attack and ambush. Furthermore, the rising terrorist activities and cross-border disputes will significantly surge market demand for the global armored vehicles industry.

Insight by System

Based on System, the Global Armored Vehicle Market is Engines, Drive Systems, Turret Drives, Ammunition Handling System, Fire Control System (FCS), Armaments, Ballistic Armor, Command & Control (C2) Systems, Countermeasure Systems, Navigation Systems, Power Systems, Hulls/Frames, and Observation & Display Systems. Armaments is expected to have a high CAGR during the forecast period owing to the increased use of remote weapon station. 

Insight by Mode of Operation

Based on Mode of Operation, the Global Armored Vehicle Market is bifurcated into Manned and Unmanned. Unmanned armored vehicles is expected to have significant growth and play an important role in military operations. Unmanned Ground Vehicles offer ground forces greater mobility, firepower, and protection. The UGVs are employed in a variety of applications, including the military, border patrol, law enforcement, security services, riot control, and hostage situations.  Extreme environmental conditions including heat, cold, or contamination from nuclear, chemical, and biological sources make them more effective.

Insight by Mobility

Based on Mobility, the global Armored Vehicle Market is bifurcated into Wheeled and Tracked. The wheeled is further divided into 4*4, 6*6, 8*8, 10*10, and 12*12. Wheeled armored vehicles are anticipated to have the highest share during the forecast period owing to their increased prominence. They have less weight, better mobility, and enhanced combat capabilities. Additionally, there is a significant demand for armored automobiles and other wheeled vehicles because of the increase in terrorist and hostile activities in urban areas.

Global Armored Vehicle Market Report Coverage

Report Metric

Details

Historical Period

2018–2023

Base Year Considered

2024

Forecast Period

2025 - 2030

Market Size in 2021

$25.5 Billion

Revenue Forecast in 2030

$40.2 Billion

Growth Rate

CAGR 3.6%

Segments Covered in the Report

By Platform, By System, By Mode of Operation, and By Mobility

Report Scope

Market Trends, Drivers, and Restraints; Revenue Estimation and Forecast; Segmentation Analysis; Impact of COVID-19; Companies’ Strategic Developments; Market Share Analysis of Key Players; Company Profiling

Regions Covered in the Report

North America, Europe, Asia-Pacific, Middle East, and Rest of the World

Industry Dynamics

Growth Drivers

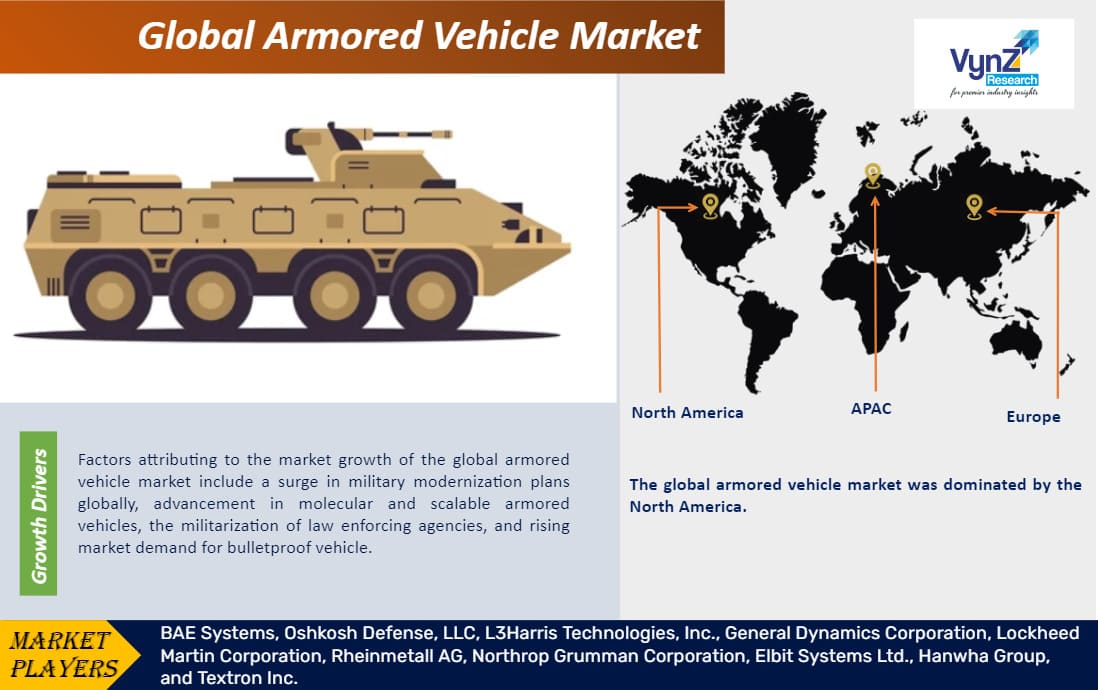
Factors attributing to the market growth of the global armored vehicle market include a surge in military modernization plans globally, advancement in molecular and scalable armored vehicles, the militarization of law enforcing agencies, and rising market demand for bulletproof vehicle. They are widely deployed in defense and commercial applications. The increased expenditure on the defense budget and procurement programs in Asian countries, rising cross-border disputes, rising incidences of asymmetric warfare will have a favorable impact on the global armored vehicle industry.

The government's partnerships with commercial groups to create highly innovative and precise solutions for defense and the big industry players' significant R&D spending both boost market expansion.

Another technological advance in the sector is the creation of an ultra-lightweight armored vehicle using green technology. As demand for light weight armored vehicles rises, the key players may now rely on green technology to meet those expectations.

The increased adoption of Active Protection Systems (APS) to automatically detect and counteract incoming threat projectiles before reaching the target will propel market development of the global armored vehicle industry. These APS uses tracking radar, launchers, sensors, and countermeasure munitions, thereby protecting armored vehicles from grenades and anti-tank guided missiles.

Challenges

The armored vehicle market is anticipated to have slow growth due to rising costs for raw materials, components, vehicle assembly, and machining equipment. The market's expansion may be hampered by the high cost involved, the absence of important OEMs for armored vehicles, high taxes imposed by different countries, and import expenses. Also, the significant obstacles that are anticipated to have a negative effect on the expansion of the global armored vehicle market include the numerous government rules and regulations as well as the lack of uniformity in how different businesses operate.

Opportunities

The key players are anticipating a rise in market share of armored vehicles, thereby creating market opportunities in the global market owing to:

  • The rising implementation of unmanned combat ground vehicles by armed forces
  • The unveiling of next-generation vehicles with reactive armor technology, active protection systems, programmable ammunition, developed autoloaders
  • Advancement in communication medium, navigation, surveillance, flexibility, protection, and rising situational awareness.

Geographic Overview

  • North America
  • Europe
  • Asia Pacific (APAC)
  • Rest of the World (RoW)

North America contributes the largest share in the global armored vehicle market owing to increased expenditure on the defense budget so as to modernize the defense fleet, procure advanced defense vehicles, and strengthen armed forces. A significant number of military machinery and equipment producers, a high rate of adoption of sophisticated technology, and continuous initiatives in which the US government collaborates with industry players to develop modern vehicles for defense purposes will have a favorable impact on the armored vehicle industry.

Due to the rising occurrence of border wars involving neighboring nations, such as the Russia-Ukraine War, Europe also retained a significant revenue share. Furthermore, with terrorism on the rise, numerous EU governments are increasingly focusing on acquiring vehicles for war and troop transportation in order to bolster their defensive capabilities.

Competitive Insight

The top companies in the armored vehicle industry are working harder than ever to maintain the market's rapid expansion on a global scale.

To obtain a competitive edge, the major market players are investing in the development of new products. Leading players are concentrating on working with businesses that produce cutting-edge systems and components so that their products can be outfitted with state-of-the-art technology for improved combat capabilities.

Oshkosh Defense is a world leader in the design, manufacture, and support of world-class military vehicles and mobility systems. Oshkosh develops and utilizes developing technologies that increase crew safety and mission effectiveness as a pioneer of combat-ready vehicle solutions. Oshkosh sets the industry standard for fleet readiness by ensuring that every solution is supported globally throughout its entire life cycle. Oshkosh Defense Vehicle Platforms include Light Tactical Vehicles, Medium Tactical Vehicles, Heavy Tactical Vehicles, Mine Resistant Ambush Protected (MRAP), Aircraft Rescue Fire-Fighting (ARFF), Government Vehicles, and Tracked Vehicles.

General Dynamics is a multinational aerospace and defense corporation. People all across the world rely on their products and services which include Gulfstream business jets and combat vehicles to nuclear-powered submarines and communications systems for their safety and security. The Combat Systems category is a leading global manufacturer and integrator of land solutions such as wheeled and tracked combat vehicles, weapons systems, and ammunition. General dynamics retain its industry-leading position by focusing on innovation, cost, and speed in order to deliver greater combat survivability, performance, and lethality.

Recent Development by Key Players

In an effort to replace the outdated M113 armored personnel carriers as quickly as possible, In October 2022, the US Army approached BAE Systems to increase manufacturing of its new Armored Multi-Purpose Vehicle (AMPV).  The army intends to purchase at least 197 AMPVs in the fiscal year 2023 to make up for the 200 M113s supplied to Ukraine.

General Dynamics Corp.'s armored combat vehicle designers will construct improved Stryker wheeled vehicles for the United States Army under a $146.7 million deal announced in November 2022.

In September 2022, Elbit Systems stated that it has been awarded an $80 million contract to supply unmanned turrets Armored Fighting Vehicles ("AFVs") of an Asian-Pacific country. The contract will be completed over the course of three years. Elbit Systems will provide the 30mm-gun unmanned light turrets with sensors and display systems for enhanced situational awareness, target acquisition capabilities, fire control systems, and weapon systems of various types under the contract, enabling significant mission performance upgrades for the AFVs.

Key Players Covered in the Report

Some of the major players operating in the global armored vehicle market include BAE Systems, Oshkosh Defense, LLC, L3Harris Technologies, Inc., General Dynamics Corporation, Lockheed Martin Corporation, Rheinmetall AG, Northrop Grumman Corporation, Elbit Systems Ltd., Hanwha Group, and Textron Inc.

Armored Vehicle Market Size and Market Analysis

Highlight opportunities using granular analytics insights. Make informed decisions with detailed market intelligence.
Download PDF

To explore more about this report - Request a free sample copy

1.    Research Overview

        1.1.    The Report Offers
        1.2.    Market Coverage
                1.2.1.    By Platform
                1.2.2.    By System
                1.2.3.    By Mode of Operation
                1.2.4.    By Mobility
                1.2.5.    By Region

        1.3.    Research Phases
        1.4.    Limitations
        1.5.    Market Methodology
                1.5.1.    Data Sources
                        1.5.1.1. Primary Research
                        1.5.1.2. Secondary Research
                1.5.2.    Methodology
                        1.5.2.1. Data Exploration
                        1.5.2.2. Forecast Parameters
                        1.5.2.3. Data Validation
                        1.5.2.4. Assumptions
                1.5.3.    Study Period & Data Reporting Unit

2.    Executive Summary

3.    Industry Overview

        3.1.    Industry Dynamics
                3.1.1.    Market Growth Drivers
                3.1.2.    Market Restraints
                3.1.3.    Key Market Trends
                3.1.4.    Major Opportunities

        3.2.    Industry Ecosystem
                3.2.1.    Porter’s Five Forces Analysis
                3.2.2.    Recent Development Analysis
                3.2.3.    Value Chain Analysis

        3.3.    Competitive Insight
                3.3.1.    Competitive Position of Industry Players
                3.3.2.    Market Attractive Analysis
                3.3.3.    Market Share Analysis

4.    Global Market Estimate and Forecast

        4.1.    Global Market Overview
        4.2.    Global Market Estimate and Forecast to 2030

5.    Market Segmentation Estimate and Forecast

        5.1.    By Platform
                5.1.1.    Combat Vehicles
                        5.1.1.1. Market Definition
                        5.1.1.2. Market Estimation and Forecast to 2030 
                5.1.2.    Combat Support Vehicles
                        5.1.2.1. Market Definition
                        5.1.2.2. Market Estimation and Forecast to 2030
                5.1.3.    Unmanned Armored Ground Vehicles
                        5.1.3.1. Market Definition
                        5.1.3.2. Market Estimation and Forecast to 2030

        5.2.    By System
                5.2.1.    Engines
                        5.2.1.1. Market Definition
                        5.2.1.2. Market Estimation and Forecast to 2030
                5.2.2.    Drive Systems
                        5.2.2.1. Market Definition
                        5.2.2.2. Market Estimation and Forecast to 2030
                5.2.3.    Turret Drives
                        5.2.3.1. Market Definition
                        5.2.3.2. Market Estimation and Forecast to 2030
                5.2.4.    Ammunition Handling System
                        5.2.4.1. Market Definition
                        5.2.4.2. Market Estimation and Forecast to 2030
                5.2.5.    Fire Control System (FCS)
                        5.2.5.1. Market Definition
                        5.2.5.2. Market Estimation and Forecast to 2030
                5.2.6.    Armaments
                        5.2.6.1. Market Definition
                        5.2.6.2. Market Estimation and Forecast to 2030
                5.2.7.    Ballistic Armor
                        5.2.7.1. Market Definition
                        5.2.7.2. Market Estimation and Forecast to 2030
                5.2.8.    Command & Control (C2) Systems
                        5.2.8.1. Market Definition
                        5.2.8.2. Market Estimation and Forecast to 2030
                5.2.9.    Countermeasure Systems
                        5.2.9.1. Market Definition
                        5.2.9.2. Market Estimation and Forecast to 2030
                5.2.10.    Navigation Systems
                        5.2.10.1. Market Definition
                        5.2.10.2. Market Estimation and Forecast to 2030
                5.2.11.    Power Systems
                        5.2.11.1. Market Definition
                        5.2.11.2. Market Estimation and Forecast to 2030
                5.2.12.    Hulls/Frames
                        5.2.12.1. Market Definition
                        5.2.12.2. Market Estimation and Forecast to 2030
                5.2.13.    Observation & Display Systems
                        5.2.13.1. Market Definition
                        5.2.13.2. Market Estimation and Forecast to 2030

        5.3.    By Mode of Operation
                5.3.1.    Manned
                        5.3.1.1. Market Definition
                        5.3.1.2. Market Estimation and Forecast to 2030
                5.3.2.    Unmanned
                        5.3.2.1. Market Definition
                        5.3.2.2. Market Estimation and Forecast to 2030

        5.4.    By Mobility
                5.4.1.    Wheeled
                        5.4.1.1. Market Definition
                        5.4.1.2. Market Estimation and Forecast to 2030
                5.4.2.    Tracked
                        5.4.2.1. Market Definition
                        5.4.2.2. Market Estimation and Forecast to 2030

                
6.    North America Market Estimate and Forecast

        6.1.    By Platform
        6.2.    By System
        6.3.    By Mode of Operation
        6.4.    By Mobility
        6.5.    By Country
                6.5.1.    U.S. Market Estimate and Forecast
                6.5.2.    Canada Market Estimate and Forecast
                6.5.3.    Mexico Market Estimate and Forecast

7.    Europe Market Estimate and Forecast

        7.1.    By Platform
        7.2.    By System
        7.3.    By Mode of Operation
        7.4.    By Mobility
        7.5.    By Country
                7.5.1.    Germany Market Estimate and Forecast
                7.5.2.    France Market Estimate and Forecast
                7.5.3.    U.K. Market Estimate and Forecast
                7.5.4.    Italy Market Estimate and Forecast
                7.5.5.    Spain Market Estimate and Forecast
                7.5.6.    Rest of Europe Market Estimate and Forecast

8.    Asia-Pacific Market Estimate and Forecast

        8.1.    By Platform
        8.2.    By System
        8.3.    By Mode of Operation
        8.4.    By Mobility
        8.5.    By Country
                8.5.1.    China Market Estimate and Forecast
                8.5.2.    Japan Market Estimate and Forecast
                8.5.3.    India Market Estimate and Forecast
                8.5.4.    South Korea Market Estimate and Forecast
                8.5.5.    Singapore Market Estimate and Forecast
                8.5.6.    Rest of Asia-Pacific Market Estimate and Forecast

9.    Rest of the World (RoW) Market Estimate and Forecast

        9.1.    By Platform
        9.2.    By System
        9.3.    By Mode of Operation
        9.4.    By Mobility
        9.5.    By Country
                9.5.1.    Brazil Market Estimate and Forecast
                9.5.2.    Saudi Arabia Market Estimate and Forecast
                9.5.3.    South Africa Market Estimate and Forecast
                9.5.4.    Other Countries Market Estimate and Forecast

10.    Company Profiles

        10.1.    BAE Systems
                10.1.1.    Snapshot
                10.1.2.    Overview
                10.1.3.    Offerings
                10.1.4.    Financial Insight
                10.1.5.    Recent Developments

        10.2.    Oshkosh Defense, LLC
                10.2.1.    Snapshot
                10.2.2.    Overview
                10.2.3.    Offerings
                10.2.4.    Financial Insight
                10.2.5.    Recent Developments

        10.3.    L3Harris Technologies, Inc.
                10.3.1.    Snapshot
                10.3.2.    Overview
                10.3.3.    Offerings
                10.3.4.    Financial Insight
                10.3.5.    Recent Developments

        10.4.    General Dynamics Corporation
                10.4.1.    Snapshot
                10.4.2.    Overview
                10.4.3.    Offerings
                10.4.4.    Financial Insight
                10.4.5.    Recent Developments

        10.5. Lockheed Martin Corporation
                10.5.1.    Snapshot
                10.5.2.    Overview
                10.5.3.    Offerings
                10.5.4.    Financial Insight
                10.5.5.    Recent Developments

        10.6. Rheinmetall AG
                10.6.1.    Snapshot
                10.6.2.    Overview
                10.6.3.    Offerings
                10.6.4.    Financial Insight
                10.6.5.    Recent Developments

        10.7.    Northrop Grumman Corporation 
                10.7.1.    Snapshot
                10.7.2.    Overview
                10.7.3.    Offerings
                10.7.4.    Financial Insight
                10.7.5.    Recent Developments

        10.8.    Elbit Systems Ltd.
                10.8.1.    Snapshot
                10.8.2.    Overview
                10.8.3.    Offerings
                10.8.4.    Financial Insight
                10.8.5.    Recent Developments

        10.9.    Hanwha Group
                10.9.1.    Snapshot
                10.9.2.    Overview
                10.9.3.    Offerings
                10.9.4.    Financial Insight
                10.9.5.    Recent Developments

        10.10. Textron Inc.
                10.10.1. Snapshot
                10.10.2. Overview
                10.10.3. Offerings
                10.10.4. Financial Insight
                10.10.5. Recent Developments

11.    Appendix

        11.1.    Exchange Rates
        11.2.    Abbreviations

Note: Financial insight and recent developments of different companies are subject to availability of information in secondary domain.

List of Tables

Table 1 Sources
Table 2 Study Periods
Table 3 Data Reporting Unit
Table 4 Global Armored Vehicle Market Size, By Platform, 2018-2021 (USD Billion)
Table 5 Global Armored Vehicle Market Size, By Platform, 2022-2030 (USD Billion)
Table 6 Global Armored Vehicle Market Size, By System, 2018-2021 (USD Billion)
Table 7 Global Armored Vehicle Market Size, By System, 2022-2030 (USD Billion)
Table 8 Global Armored Vehicle Market Size, By Mode of Operation, 2018-2021 (USD Billion)
Table 9 Global Armored Vehicle Market Size, By Mode of Operation, 2022-2030 (USD Billion)
Table 10 Global Armored Vehicle Market Size, By Mobility, 2018-2021 (USD Billion)
Table 11 Global Armored Vehicle Market Size, By Mobility, 2022-2030 (USD Billion)
Table 12 Global Armored Vehicle Market Size, by Region, 2018-2021 (USD Billion)
Table 13 Global Armored Vehicle Market Size, by Region, 2022-2030 (USD Billion)
Table 14 North America Armored Vehicle Market Size, By Platform, 2018-2021 (USD Billion)
Table 15 North America Armored Vehicle Market Size, By Platform, 2022-2030 (USD Billion)
Table 16 North America Armored Vehicle Market Size, By System, 2018-2021 (USD Billion)
Table 17 North America Armored Vehicle Market Size, By System, 2022-2030 (USD Billion)
Table 18 North America Armored Vehicle Market Size, By Mode of Operation, 2018-2021 (USD Billion)
Table 19 North America Armored Vehicle Market Size, By Mode of Operation, 2022-2030 (USD Billion)
Table 20 North America Armored Vehicle Market Size, By Mobility, 2018-2021 (USD Billion)
Table 21 North America Armored Vehicle Market Size, By Mobility, 2022-2030 (USD Billion)
Table 22 North America Armored Vehicle Market Size, by Region, 2018-2021 (USD Billion)
Table 23 North America Armored Vehicle Market Size, by Region, 2022-2030 (USD Billion)
Table 24 Europe Armored Vehicle Market Size, By Platform, 2018-2021 (USD Billion)
Table 25 Europe Armored Vehicle Market Size, By Platform, 2022-2030 (USD Billion)
Table 26 Europe Armored Vehicle Market Size, By System, 2018-2021 (USD Billion)
Table 27 Europe Armored Vehicle Market Size, By System, 2022-2030 (USD Billion)
Table 28 Europe Armored Vehicle Market Size, By Mode of Operation, 2018-2021 (USD Billion)
Table 29 Europe Armored Vehicle Market Size, By Mode of Operation, 2022-2030 (USD Billion)
Table 30 Europe Armored Vehicle Market Size, By Mobility, 2018-2021 (USD Billion)
Table 31 Europe Armored Vehicle Market Size, By Mobility, 2022-2030 (USD Billion)
Table 32 Europe Armored Vehicle Market Size, by Region, 2018-2021 (USD Billion)
Table 33 Europe Armored Vehicle Market Size, by Region, 2022-2030 (USD Billion)
Table 34 Asia-Pacific Armored Vehicle Market Size, By Platform, 2018-2021 (USD Billion)
Table 35 Asia-Pacific Armored Vehicle Market Size, By Platform, 2022-2030 (USD Billion)
Table 36 Asia-Pacific Armored Vehicle Market Size, By System, 2018-2021 (USD Billion)
Table 37 Asia-Pacific Armored Vehicle Market Size, By System, 2022-2030 (USD Billion)
Table 38 Asia-Pacific Armored Vehicle Market Size, By Mode of Operation, 2018-2021 (USD Billion)
Table 39 Asia-Pacific Armored Vehicle Market Size, By Mode of Operation, 2022-2030 (USD Billion)
Table 40 Asia-Pacific Armored Vehicle Market Size, By Mobility, 2018-2021 (USD Billion)
Table 41 Asia-Pacific Armored Vehicle Market Size, By Mobility, 2022-2030 (USD Billion)
Table 42 Asia-Pacific Armored Vehicle Market Size, by Region, 2018-2021 (USD Billion)
Table 43 Asia-Pacific Armored Vehicle Market Size, by Region, 2022-2030 (USD Billion)
Table 44 RoW Armored Vehicle Market Size, By Platform, 2018-2021 (USD Billion)
Table 45 RoW Armored Vehicle Market Size, By Platform, 2022-2030 (USD Billion)
Table 46 RoW Armored Vehicle Market Size, By System, 2018-2021 (USD Billion)
Table 47 RoW Armored Vehicle Market Size, By System, 2022-2030 (USD Billion)
Table 48 RoW Armored Vehicle Market Size, By Mode of Operation, 2018-2021 (USD Billion)
Table 49 RoW Armored Vehicle Market Size, By Mode of Operation, 2022-2030 (USD Billion)
Table 50 RoW Armored Vehicle Market Size, By Mobility, 2018-2021 (USD Billion)
Table 51 RoW Armored Vehicle Market Size, By Mobility, 2022-2030 (USD Billion)
Table 52 RoW Armored Vehicle Market Size, by Region, 2018-2021 (USD Billion)
Table 53 RoW Armored Vehicle Market Size, by Region, 2022-2030 (USD Billion)
Table 54 Snapshot – BAE Systems
Table 55 Snapshot – Oshkosh Defense, LLC
Table 56 Snapshot – L3Harris Technologies, Inc.
Table 57 Snapshot – General Dynamics Corporation
Table 58 Snapshot – Lockheed Martin Corporation
Table 59 Snapshot – Rheinmetall AG
Table 60 Snapshot – Northrop Grumman Corporation
Table 61 Snapshot – Elbit Systems Ltd.
Table 62 Snapshot – Hanwha Group
Table 63 Snapshot – Textron Inc.

List of Figures

Figure 1 Market Coverage
Figure 2 Research Phases
Figure 3 Secondary Sources for Different Parameters
Figure 4 Methodology
Figure 5 Data Mining & Exploration
Figure 6 Data Triangulation
Figure 7 Assumptions for Market Estimation and Forecast
Figure 8 Market Synopsis
Figure 9 Global Armored Vehicle Market - Growth Drivers and Restraints
Figure 10 Competitive Benchmark
Figure 11 Global Armored Vehicle Market Highlight
Figure 12 Global Armored Vehicle Market Size, By Platform, 2018-2021 (USD Billion)
Figure 13 Global Armored Vehicle Market Size, By System, 2018-2021 (USD Billion)
Figure 14 Global Armored Vehicle Market Size, By Mode of Operation, 2018-2021 (USD Billion)
Figure 15 Global Armored Vehicle Market Size, By Mobility, 2018-2021 (USD Billion)
Figure 16 Global Armored Vehicle Market Size, by Region, 2018-2021 (USD Billion)
Figure 17 North America Armored Vehicle Market Highlight
Figure 18 North America Armored Vehicle Market Size, By Platform, 2018 - 2030 (USD Billion)
Figure 19 North America Armored Vehicle Market Size, By System, 2018 - 2030 (USD Billion)
Figure 20 North America Armored Vehicle Market Size, By Mode of Operation, 2018 - 2030 (USD Billion)
Figure 21 North America Armored Vehicle Market Size, By Mobility, 2018 - 2030 (USD Billion)
Figure 22 North America Armored Vehicle Market Size, by Region, 2018 - 2030 (USD Billion)
Figure 23 Europe Armored Vehicle Market Highlight
Figure 24 Europe Armored Vehicle Market Size, By Platform, 2018 - 2030 (USD Billion)
Figure 25 Europe Armored Vehicle Market Size, By System, 2018 - 2030 (USD Billion)
Figure 26 Europe Armored Vehicle Market Size, By Mode of Operation, 2018 - 2030 (USD Billion)
Figure 27 Europe Armored Vehicle Market Size, By Mobility, 2018 - 2030 (USD Billion)
Figure 28 Europe Armored Vehicle Market Size, by Region, 2018 - 2030 (USD Billion)
Figure 29 Asia-Pacific Armored Vehicle Market Highlight
Figure 30 Asia-Pacific Armored Vehicle Market Size, By Platform, 2018 - 2030 (USD Billion)
Figure 31 Asia-Pacific Armored Vehicle Market Size, By System, 2018 - 2030 (USD Billion)
Figure 32 Asia-Pacific Armored Vehicle Market Size, By Mode of Operation, 2018 - 2030 (USD Billion)
Figure 33 Asia-Pacific Armored Vehicle Market Size, By Mobility, 2018 - 2030 (USD Billion)
Figure 34 Asia-Pacific Armored Vehicle Market Size, by Region, 2018 - 2030 (USD Billion)
Figure 35 RoW Armored Vehicle Market Highlight
Figure 36 RoW Armored Vehicle Market Size, By Platform, 2018 - 2030 (USD Billion)
Figure 37 RoW Armored Vehicle Market Size, By System, 2018 - 2030 (USD Billion)
Figure 38 RoW Armored Vehicle Market Size, By Mode of Operation, 2018 - 2030 (USD Billion)
Figure 39 RoW Armored Vehicle Market Size, By Mobility, 2018 - 2030 (USD Billion)
Figure 40 RoW Armored Vehicle Market Size, by Region, 2018 - 2030 (USD Billion)

Global Armored Vehicle Market Coverage

Platform Insight and Forecast 2025-2030

  • Combat Vehicles
    • Main Battle Tanks (MBTs)
    • Infantry Fighting Vehicles (IFVs)
    • Armored Personnel Carriers (APCs)
    • Armored Amphibious Vehicles (AAVs)
    • Light-Protected Vehicles (LPVs)
    • Mine-Resistant Ambush Protected (MRAP)
    • Air Defense Vehicles
    • Self-Protected Howitzers (SPHs)
  • Combat Support Vehicles
    • Armored Supply Tanks
    • Repair and Recovery Machines
    • Bridge-Laying Tanks
    • Mine Clearance Vehicles
    • Armored Command & Control Vehicles
  • Unmanned Armored Ground Vehicles

System Insight and Forecast 2025-2030

  • Engines
  • Drive Systems
  • Turret Drives
  • Ammunition Handling System
  • Fire Control System (FCS)
  • Armaments
  • Ballistic Armor
  • Command & Control (C2) Systems
  • Countermeasure Systems
  • Navigation Systems
  • Power Systems
  • Hulls/Frames
  • Observation & Display Systems

Mode of Operation Insight and Forecast 2025-2030

  • Manned
  • Unmanned

Mobility Insight and Forecast 2025-2030

  • Wheeled
    • 4*4
    • 6*6
    • 8*8
    • 10*10
    • 12*12
  • Tracked

Geographical Segmentation

Armored Vehicle Market by Region

North America

  • By Platform
  • By System
  • By Mode of Operation
  • By Mobility
  • By Country – U.S., Canada, and Mexico

Europe

  • By Platform
  • By System
  • By Mode of Operation
  • By Mobility
  • By Country – Germany, U.K., France, Italy, Spain, Russia, and Rest of Europe

Asia-Pacific (APAC)

  • By Platform
  • By System
  • By Mode of Operation
  • By Mobility
  • By Country – China, Japan, India, South Korea, and Rest of Asia-Pacific

Rest of the World (RoW)

  • By Platform
  • By System
  • By Mode of Operation
  • By Mobility
  • By Country – Brazil, Saudi Arabia, South Africa, U.A.E., and Other Countries


  • BAE Systems
  • Oshkosh Defense, LLC
  • L3Harris Technologies, Inc.
  • General Dynamics Corporation
  • Lockheed Martin Corporation
  • Rheinmetall AG
  • Northrop Grumman Corporation
  • Elbit Systems Ltd.
  • Hanwha Group
  • Textron Inc.

Frequently Asked Questions

The armored vehicle market growth is anticipated to be 3.6% during the forecast period.
The global armored vehicles market size is expected to reach USD 40.2 billion by 2030 from USD 25.5 billion in 2021.
The increased adoption of unmanned combat vehicles and the manufacturing of modular armored vehicles will create lucrative growth opportunities for the industry players operating in the global armored vehicle market.
North America contributes the largest share in the global armored vehicle market owing to increased expenditure on the defense budget so as to modernize the defense fleet, procure advanced defense vehicles, and strengthen armed forces.
Some of the major players in the global Armored Vehicle industry include BAE Systems, Oshkosh Defense, LLC, L3Harris Technologies, Inc., General Dynamics Corporation, Lockheed Martin Corporation, Rheinmetall AG, Northrop Grumman Corporation, Elbit Systems Ltd., Hanwha Group, and Textron Inc.

Purchase Options

Research Methodology

  •  Desk Research / Pilot Interviews
  •  Build Market Size Model
  •  Research and Analysis
  •  Final Deliverabvle

Connect With Our Sales Team