Global Electronic Warfare Market – Analysis and Forecast (2025-2030)

Industry Insights By Capability (Electronic Support, Electronic Attack and Electronic Proportion), By Platform (Airborne, Naval, Ground and Space), By Product (EW Equipment and EW Operational Support), By Technology (Antennas, Anti-jam Electronic Protection Systems, Directed Energy Weapons, IR Missile Warning Systems, Optical Attack Solutions and Others) and By Geography (North America, Europe, Asia-Pacific and Rest of the World)

About This Report Status : Published Published On : Aug, 2024 Report Code : VRAD12035 Industry : Aerospace and Defense Available Format : Page : 204

Industry Overview

Report Description

The Global Electronic Warfare Market is projected to grow from USD 10.6 billion in 2023 to USD 23.5 billion in 2030 at a CAGR of 13.4% during the forecast period from 2025 to 2030.

Electronic Warfare Market

Reveal each market segment's real performance. Access comprehensive data and strategic insights.
Download PDF

Electronic Warfare (EW) refers to the use of electromagnetic spectrum, such as signals and radio frequency. Activities such as jamming, deciphering and intercepting signals are involved to provide situational awareness to a country and help them take defensive measures, prepare for offensive situations and get diplomatic insights at every level before conflicts arise. Advanced warfare techniques can decode opposition, identify and intercept data. Also, they can project directed energy to disrupt enemy operations. The rise in regional conflicts and geopolitical tensions demand the adoption of advanced warfare methods. The rise in the use of technology in warfare has positively driven the electronic warfare market growth.

Due to increasing tactical combat operations, Russia-Ukraine War has a positive impact on the market. The Russian government invested in EW systems, that were used to jam GPS signals, detect smart bombs supplied by Western nations and allowing Russian forces to launch an aerial attack. The war has showcased the evolving role of EW in modern conflicts and highlighted the strategies and technologies employed by both sides. Moreover, the Russia-Ukraine war was closely linked with cyber operations. The conflict has driven both countries to invest in the modernization of their EW capabilities. Such developments catalyze the applications of EW in modern-day conflicts.

Market Segmentation

Insight by Capability

  • Electronic Support
  • Electronic attack
  • Electronic proportion

On the basis of capability, the Global Electronic Warfare Market is segregated into electronic support, electronic attack and electronic proportion. The electronic support segment dominated the electronic warfare market during the forecast period 2025 to 2030. The advancements in threat recognition algorithms, signal processing and spectrum management technologies influence the growth of electronic support segment in the Electronic Warfare Market.

Insight by Platform

  • Airborne
  • Naval
  • Ground
  • Space

According to the platform, The Global Electronic Warfare Market is segregated into airborne, naval, ground and space. The airborne segment dominated the market as it is driven by rising demand for self protection, signal intelligence and sophisticated surveillance in recent aircraft. Also machine learning and AI is integrated for real time threat analysis and decision making that shall enhance operational effectiveness and efficiency.

Insight by Product

  • EW Equipment
  • EW Operational Support

The Global Electronic Warfare Market based on product is divided into EW equipment and EW operational support. Among these, electronic warfare equipment segment shall dominate the market during the forecast period as there is a great development in the integrated systems that offer better capabilities across infrared, radio frequency and cyber domains.

Insight by Technology

  • Antennas
  • Anti-jam Electronic Protection Systems
  • Directed Energy Weapons
  • IR Missile Warning Systems
  • Optical Attack Solutions
  • Others

On the basis of technology, The Global Electronic Warfare Market is segmented into antennas, anti-jam electronic protection systems, directed energy weapons, IR missile warning systems, optical attack solutions, and others. IR missile warning systems dominated during the forecast period it supports various operations for Electronic Support Measures (ESM). Furthermore, the rise in government funding for threat detection and improved border security leads to the segment growth.

Global Electronic Warfare Market Report Coverage

Report Metric

Details

Historical Period

2020 - 2024

Base Year Considered

2025

Forecast Period

2026 - 2035

Market Size in 2025

U.S.D.  10.6 Billion

Revenue Forecast in 2035

U.S.D.  23.5 Billion

Growth Rate

13.4%

Segments Covered in the Report

By Capability, By Platform, By Product and By Technology

Report Scope

Market Trends, Drivers, and Restraints; Revenue Estimation and Forecast; Segmentation Analysis; Impact of COVID-19; Companies’ Strategic Developments; Market Share Analysis of Key Players; Company Profiling

Regions Covered in the Report

North America, Europe, Asia-Pacific and Rest of the World

Industry Dynamics

Growth Drivers

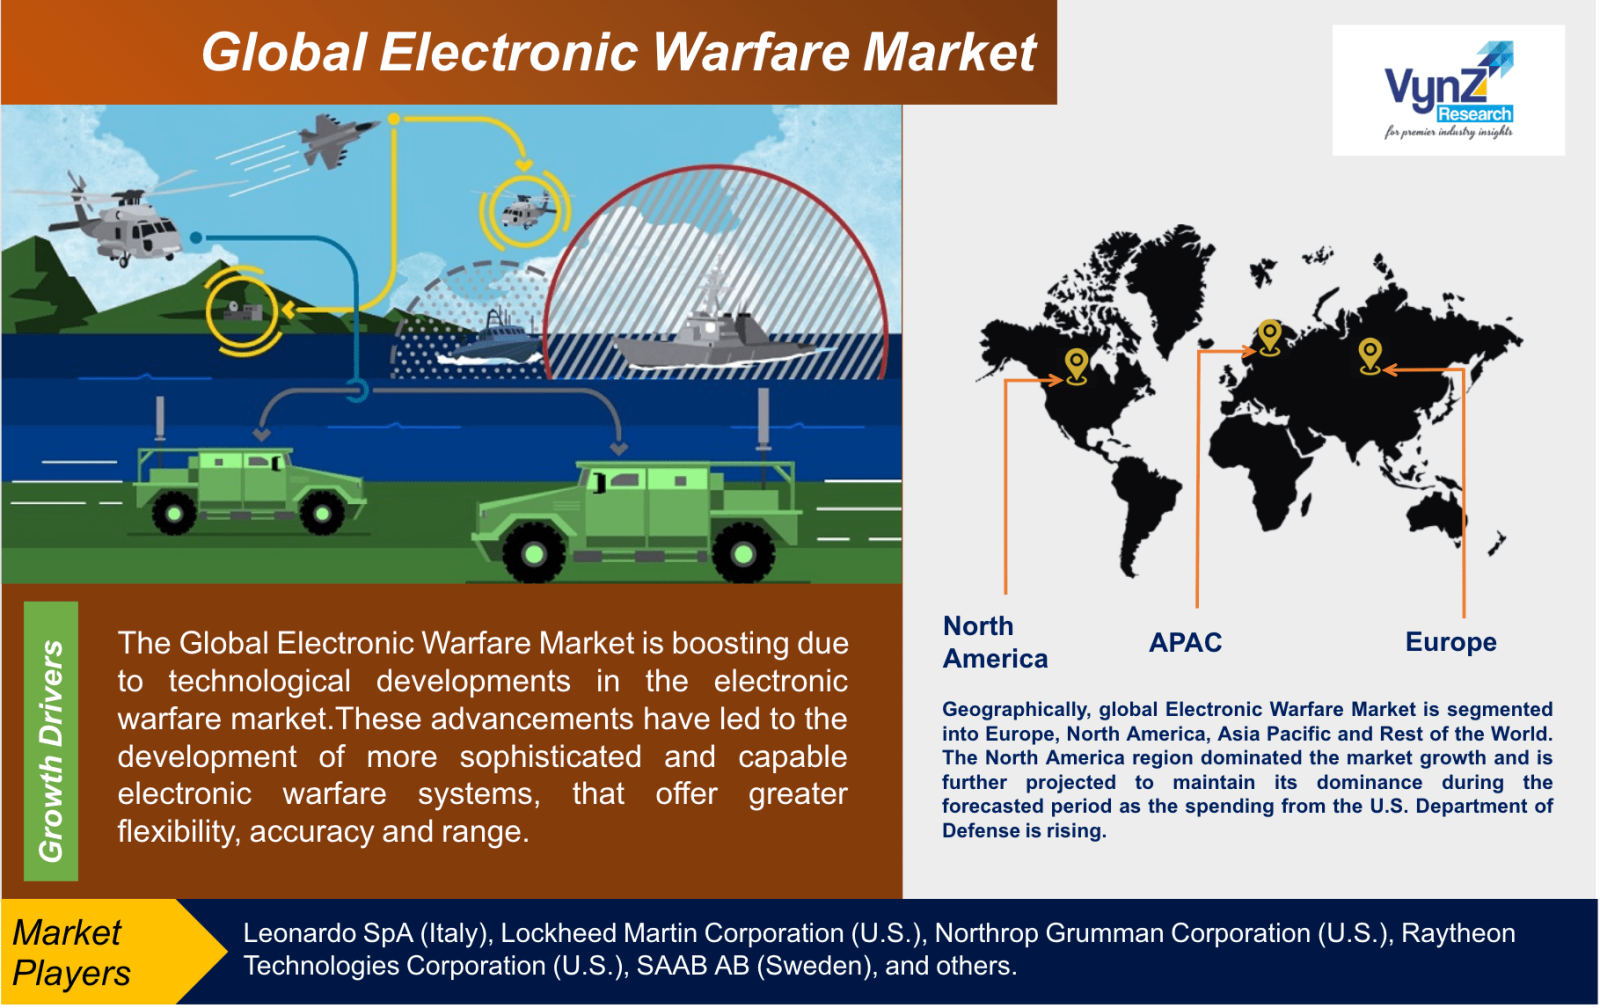
The Global Electronic Warfare Market is boosting due to technological developments in the electronic warfare market. These advancements have led to the development of more sophisticated and capable electronic warfare systems, that offer greater flexibility, accuracy and range. Also high-sensitivity sensors are being incorporated into Electronic Countermeasure Systems (ECS) that are capable of classifying and identifying a wide range of electrical signals like radar emissions and  communication transmission. The sensors are becoming compact, more energy efficient that are able to operate across several frequency ranges. To increase agility, efficiency and effectiveness, the use of a variety of cutting-edge technologies in various areas of operation is referred to as 'digital transformation. Modern electronic warfare systems are becoming more digitized and integrated with broader capabilities of the Network Centric Warfare (NCW). This enables enhanced situational awareness & coordination in the face of threats. In addition, EW has improved as a result of advances in digital signal processing and machine learning algorithms. Accurate analysis of complicated signals are enabled by these technologies with rapid identification of threats from various sources. Increasing use of warfare equipment due to deployment of cyber operations to propel market growth. Cyberspace plays a vital role in national security across domains, such as air, land, sea and space. 

Restraints

The main restraint of the Global Electronic Warfare Market is the complex electronic countermeasure systems which require seamless integration with various sensors, platforms and communication networks. Modern military operations often involve multiple domains such as land, air, sea, cyberspace and others. EW systems must be incorporated across these domains for comprehensive situational awareness and effective response. To achieve flawless integration is a challenge that may hinder the market growth. Furthermore, designing an EW system that can adapt to diverse platforms imposes a major challenge as different military platforms posses different power operational requirements and limitations.

Geographic Overview

Geographically, global Electronic Warfare Market is segmented into Europe, North America, Asia Pacific and Rest of the World. The North America region dominated the market growth and is further projected to maintain its dominance during the forecasted period as the spending from the U.S. Department of Defense is rising. Europe held a significant EW market share due to an increase in investment in the latest warfare technologies. The Asia Pacific market is also projected to grow with the highest CAGR over the forecast period. The increasing expenditure in the defense sector from India, Japan, China and Australia is responsible for the growth in this region.

Competitive Insights

The major players are actively investing in  new product launches, research and development, partnerships, expansions and acquisitions. 

Leonardo S.p.A., is an Italian multinational company that specializes in aerospace, defense and security. The company is headquartered in Rome, Italy with 180 sites worldwide. The company provides latest advances in radio frequency technology to military customers in the UK and further afield.

The Lockheed Martin Corporation is an American aerospace and defense manufacturer. The company delivers proven technologies and functional capabilities that provide real-time situational awareness which enables the U.S. Navy to intercept signals that identify both imminent and potential threats.

Key Players Covered in the Reports

Some of the key players in this market are Leonardo SpA (Italy), Lockheed Martin Corporation (U.S.), Northrop Grumman Corporation (U.S.), Raytheon Technologies Corporation (U.S.), SAAB AB (Sweden), and others.

Recent developments by Key Players

To meet the latest NATO self-protection standard STANAG 4781 with additional features including compatibility with new smart dispenser systems, Leonardo has upgraded its BriteCloud 55 T variant electronic warfare decoy. New features include BriteCloud being able to switch data with its aircraft’s on-board self-protection system that maximize the performance.

Lockheed Martin partnered with peer General Dynamics to build solid rocket motors, which propel missiles, along with surging demand driven by conflicts in the Middle East and Ukraine.

The global Electronic Warfare Market report offers a comprehensive market segmentation analysis along with estimation for the forecast period 2025–2030.

Segments Covered in the Report

Region Covered in the Report

  • North America
    • U.S.
    • Canada
    • Mexico
  • Europe
    • Germany
    • U.K.
    • France
    • Italy
    • Spain
    • Russia
    • Rest of Europe
  • Asia-Pacific (APAC)
    • China
    • Japan
    • South Korea
    • India
    • Australia
    • Rest of APAC
  • Rest of the World
    • Brazil
    • Saudi Arabia
    • South Africa
    •  U.A.E
    • Other Countries

Electronic Warfare Market Size

Highlight opportunities using granular analytics insights. Make informed decisions with detailed market intelligence.
Download PDF

Source: VynZ Research

Electronic Warfare Market Analysis

Reveal each market segment's real performance. Access comprehensive data and strategic insights.
Download PDF

1.    Research Overview

        1.1.    The Report Offers
        1.2.    Market Coverage
                1.2.1.    By Capability 
                1.2.2.    By Platform 
                1.2.3.    By Product 
                1.2.4.    By Technology 
                1.2.5.    By Region
        1.3.    Research Phases
        1.4.    Limitations
        1.5.    Market Methodology
                1.5.1.  Data Sources
                        1.5.1.1. Primary Research
                        1.5.1.2. Secondary Research
                1.5.2.  Methodology
                        1.5.2.1. Data Exploration
                        1.5.2.2. Forecast Parameters
                        1.5.2.3. Data Validation
                        1.5.2.4. Assumptions
                1.5.3.    Study Period & Data Reporting Unit

2.    Executive Summary

3.    Industry Overview

        3.1.    Industry Dynamics
                3.1.1.    Market Growth Drivers
                3.1.2.    Market Restraints
                3.1.3.    Key Market Trends
                3.1.4.    Major Opportunities
        3.2.    Industry Ecosystem
                3.2.1.    Porter’s Five Forces Analysis
                3.2.2.    Recent Development Analysis
                3.2.3.    Value Chain Analysis
        3.3.    Competitive Insight
                3.3.1.    Competitive Position of Industry Players
                3.3.2.    Market Attractive Analysis
                3.3.3.    Market Share Analysis

4.    Global Market Estimate and Forecast

        4.1.    Global Market Overview
        4.2.    Global Market Estimate and Forecast to 2030

5.    Market Segmentation Estimate and Forecast

        5.1.    By Capability 
                5.1.1.  Electronic Support
                        5.1.1.1. Market Definition
                        5.1.1.2. Market Estimation and Forecast to 2030 
                5.1.2.  Electronic Attack 
                        5.1.2.1. Market Definition
                        5.1.2.2. Market Estimation and Forecast to 2030
                5.1.3. Electronic Proportion
                        5.1.3.1. Market Definition
                        5.1.3.2. Market Estimation and Forecast to 2030
        5.2.    By Platform 
                5.2.1.  Airborne
                        5.2.1.1. Market Definition
                        5.2.1.2. Market Estimation and Forecast to 2030
                5.2.2.  Naval
                        5.2.2.1. Market Definition
                        5.2.2.2. Market Estimation and Forecast to 2030
                5.2.3.    Ground and Space
                        5.2.3.1. Market Definition
                        5.2.3.2. Market Estimation and Forecast to 2030
        5.3    By Product 
                5.3.1.  EW Equipment
                        5.3.1.1. Market Definition
                        5.3.1.2. Market Estimation and Forecast to 2030    
                5.3.2.  EW Operational Support
                        5.3.2.1. Market Definition
                        5.3.2.2. Market Estimation and Forecast to 2030            
        5.4.    By Technology 
                5.4.1.  Antennas
                        5.4.1.1. Market Definition
                        5.4.1.2. Market Estimation and Forecast to 2030
                5.4.2.  Anti-jam Electronic Protection Systems
                        5.4.2.1. Market Definition
                        5.4.2.2. Market Estimation and Forecast to 2030
                5.4.3.  IR Missile Warning Systems
                        5.4.3.1. Market Definition
                        5.4.3.2. Market Estimation and Forecast to 2030
                5.4.4.    Directed Energy Weapons
                        5.4.4.1. Market Definition
                        5.4.4.2. Market Estimation and Forecast to 2030
                5.4.5.    Optical Attack Solutions
                        5.4.5.1. Market Definition
                        5.4.5.2. Market Estimation and Forecast to 2030

6.    North America Market Estimate and Forecast

    6.1.    By Capability
    6.2.    By Platform 
    6.3.    By Product 
    6.4.    By Technology 
                6.5.1.    U.S. Market Estimate and Forecast
                6.5.2.    Canada Market Estimate and Forecast
                6.5.3.    Mexico Market Estimate and Forecast

7.    Europe Market Estimate and Forecast

    7.1.    By Capability
    7.2.    By Platform 
    7.3.    By Product 
    7.4.    By Technology 
                7.5.1.    Germany Market Estimate and Forecast
                7.5.2.    France Market Estimate and Forecast
                7.5.3.    U.K. Market Estimate and Forecast
                7.5.4.    Italy Market Estimate and Forecast
                7.5.5.    Spain Market Estimate and Forecast
                7.5.6.    Rest of Europe Market Estimate and Forecast

8.    Asia-Pacific Market Estimate and Forecast

    8.1.    By Capability
    8.2.    By Platform 
    8.3.    By Product 
    8.4.    By Technology 
    8.5.    By Country – China, Japan, India, South Korea, and Rest of Asia-Pacific
                8.5.1.    China Market Estimate and Forecast
                8.5.2.    Japan Market Estimate and Forecast
                8.5.3.    India Market Estimate and Forecast
                8.5.4.    South Korea Market Estimate and Forecast
                8.5.5.    Singapore Market Estimate and Forecast
                8.5.6.    Rest of Asia-Pacific Market Estimate and Forecast

9.    Rest of the World (RoW) Market Estimate and Forecast

    9.1.    By Capability
    9.2.    By Platform 
    9.3.    By Product 
    9.4.    By Technology 
    9.5.    By Country – Brazil, Saudi Arabia, South Africa, U.A.E., and Other Countries
                9.5.1.    Brazil Market Estimate and Forecast
                9.5.2.    Saudi Arabia Market Estimate and Forecast
                9.5.3.    South Africa Market Estimate and Forecast
                9.5.4.    Other Countries Market Estimate and Forecast

10.    Company Profiles

        10.1.   Leonardo SpA (Italy)
                10.1.1.    Snapshot
                10.1.2.    Overview
                10.1.3.    Offerings
                10.1.4.    Financial Insight
                10.1.5.    Recent Developments
        10.2.   Lockheed Martin Corporation (U.S.)
                10.2.1.    Snapshot
                10.2.2.    Overview
                10.2.3.    Offerings
                10.2.4.    Financial Insight
                10.2.5.    Recent Developments
        10.3.   Northrop Grumman Corporation (U.S.)
                10.3.1.    Snapshot
                10.3.2.    Overview
                10.3.3.    Offerings
                10.3.4.    Financial Insight
                10.3.5.    Recent Developments
        10.4.   Raytheon Technologies Corporation (U.S.)
                10.4.1.    Snapshot
                10.4.2.    Overview
                10.4.3.    Offerings
                10.4.4.    Financial Insight
                10.4.5.    Recent Developments
        10.5.   SAAB AB (Sweden)
                10.5.1.    Snapshot
                10.5.2.    Overview
                10.5.3.    Offerings
                10.5.4.    Financial Insight
                10.5.5.    Recent Developments
        10.6.   Others
                10.6.1.    Snapshot
                10.6.2.    Overview
                10.6.3.    Offerings
                10.6.4.    Financial Insight
                10.6.5.    Recent Developments
       
11.    Appendix

        11.1.    Exchange Rates
        11.2.    Abbreviations

Note: Financial insight and recent developments of different companies are subject to the availability of information in the secondary domain.

List of Tables

Table 1 Sources
Table 2 Study Periods
Table 3 Data Reporting Unit
Table 4 Global Electronic Warfare Market Size, By Capability, 2018-2023 (USD Billion)
Table 5 Global Electronic Warfare Market Size, By Capability, 2025-2030 (USD Billion)
Table 4 Global Electronic Warfare Market Size, By Platform , 2018-2023 (USD Billion)
Table 5 Global Electronic Warfare Market Size, By Platform, 2025-2030 (USD Billion)
Table 4 Global Electronic Warfare Market Size, By Product, 2018-2023 (USD Billion)
Table 5 Global Electronic Warfare Market Size, By Product, 2025-2030 (USD Billion)
Table 6 Global Electronic Warfare Market Size, By Technology, 2018-2023 (USD Billion)
Table 7 Global Electronic Warfare Market Size, By Technology, 2025-2030 (USD Billion)
Table 8 Global Electronic Warfare Market Size, by Region, 2018-2023 (USD Billion)
Table 9 Global Electronic Warfare Market Size, by Region, 2025-2030 (USD Billion)
Table 10 North America Electronic Warfare Market Size, By Capability, 2018-2023 (USD Billion)
Table 11 North America Electronic Warfare Market Size, By Capability, 2025-2030 (USD Billion)
Table 12 North America Electronic Warfare Market Size, By Platform, 2018-2023 (USD Billion)
Table 13 North America Electronic Warfare Market Size, By Platform, 2025-2030 (USD Billion)
Table 14 North America Electronic Warfare Market Size, By Product, 2018-2023 (USD Billion)
Table 15 North America Electronic Warfare Market Size, By Product, 2025-2030 (USD Billion)
Table 16 North America Electronic Warfare Market Size, By Technology, 2018-2023 (USD Billion)
Table 17 North America Electronic Warfare Market Size, By Technology, 2025-2030 (USD Billion)
Table 18 North America Electronic Warfare Market Size, By Region, 2018-2023 (USD Billion)
Table 19 North America Electronic Warfare Market Size, By Region, 2025-2030 (USD Billion)
Table 20 Europe Electronic Warfare Market Size, By Capability, 2018-2023 (USD Billion)
Table 21 Europe Electronic Warfare Market Size, By Capability, 2025-2030 (USD Billion)
Table 22 Europe Electronic Warfare Market Size, By Platform, 2018-2023 (USD Billion)
Table 23 Europe Electronic Warfare Market Size, By Platform, 2025-2030 (USD Billion)
Table 24 Europe Electronic Warfare Market Size, By Product, 2018-2023 (USD Billion)
Table 25 Europe Electronic Warfare Market Size, By Product, 2025-2030 (USD Billion)
Table 26 Europe Electronic Warfare Market Size, By Technology, 2018-2023 (USD Billion)
Table 27 Europe Electronic Warfare Market Size, By Technology, 2025-2030 (USD Billion)
Table 28 Europe Electronic Warfare Market Size, by Region, 2018-2023 (USD Billion)
Table 29 Europe Electronic Warfare Market Size, by Region, 2025-2030 (USD Billion)
Table 30 RoW Electronic Warfare Market Size, By Capability, 2018-2023 (USD Billion)
Table 31 RoW Electronic Warfare Market Size, By Capability, 2025-2030 (USD Billion)
Table 32 RoW Electronic Warfare Market Size, By Platform, 2018-2023 (USD Billion)
Table 33 RoW Electronic Warfare Market Size, By Platform, 2025-2030 (USD Billion)
Table 34 Asia-Pacific Electronic Warfare Market Size, By Product, 2018-2023 (USD Billion)
Table 35 Asia-Pacific Electronic Warfare Market Size, By Product, 2025-2030 (USD Billion)
Table 36 Asia-Pacific Electronic Warfare Market Size, Technology, 2018-2023 (USD Billion)
Table 37 Asia-Pacific Electronic Warfare Market Size, Technology, 2025-2030 (USD Billion)
Table 38 RoW Electronic Warfare Market Size, by Region, 2018-2023 (USD Billion)
Table 39 RoW Electronic Warfare Market Size, by Region, 2025-2030 (USD Billion)
Table 40 Snapshot – Leonardo SpA (Italy)
Table 41 Snapshot – Lockheed Martin Corporation (U.S.)
Table 42 Snapshot – Northrop Grumman Corporation (U.S.)
Table 43 Snapshot – Raytheon Technologies Corporation (U.S.)
Table 44 Snapshot – SAAB AB (Sweden)
Table 45 Snapshot – Others

List of Figures

Figure 1 Market Coverage
Figure 2 Research Phases
Figure 3 Secondary  Capabilitys for Different Parameters
Figure 4 Methodology
Figure 5 Data Mining & Exploration
Figure 6 Data Triangulation
Figure 7 Assumptions for Market Estimation and Forecast
Figure 8 Market Synopsis
Figure 9  Global Electronic Warfare Market - Growth Drivers and Restraints
Figure 10 Competitive Benchmark
Figure 11 Global Electronic Warfare Market Highlight
Figure 12 Global Electronic Warfare Market Size, by  Capability, 2018 – 2030 (USD Billion)
Figure 13 Global Electronic Warfare Market Size, by Platform 2018 – 2030 (USD Billion)
Figure 14 Global Electronic Warfare Market Size, by Product 2018 – 2030 (USD Billion)
Figure 15 Global Electronic Warfare Market Size, Technology   2018 – 2030 (USD Billion)
Figure 16 Global Electronic Warfare Market Size, by Region, 2018 – 2030 (USD Billion)
Figure 17 North America Electronic Warfare Market Highlight
Figure 18 North America Electronic Warfare Market Size, by Capability, 2018 – 2030 (USD Billion)
Figure 19 North America Electronic Warfare Market Size, by Platform 2018–2030 (USD Billion)
Figure 20 North America Electronic Warfare Market Size, by Product 2018–2030 (USD Billion)
Figure 21 Global Electronic Warfare Market Size, Technology   2018 – 2030 (USD Billion)
Figure 22 North America Electronic Warfare Market Size, by Country, 2018 – 2030 (USD Billion)
Figure 23 Europe Electronic Warfare Market Highlight
Figure 24 Europe Electronic Warfare Market Size, by Capability, 2018 – 2030 (USD Billion)
Figure 25 Europe Electronic Warfare Market Size, by Platform 2018 – 2030 (USD Billion)
Figure 26 Europe Electronic Warfare Market Size, by Product 2018 – 2030 (USD Billion)
Figure 27 Global Electronic Warfare Market Size, Technology   2018 – 2030 (USD Billion)
Figure 28 Europe Electronic Warfare Market Size, by Country, 2018 – 2030 (USD Billion)
Figure 29 Asia-Pacific Electronic Warfare Market Highlight
Figure 30 Asia-Pacific Electronic Warfare Market Size, by Capability, 2018 – 2030 (USD Billion)
Figure 31 Asia-Pacific Electronic Warfare Market Size, by Platform 2018 – 2030 (USD Billion)
Figure 32 Asia-Pacific Electronic Warfare Market Size, by Product 2018 – 2030 (USD Billion)
Figure 33 Global Electronic Warfare Market Size, Technology   2018 – 2030 (USD Billion)
Figure 34 Asia-Pacific Electronic Warfare Market Size, by Country, 2018 – 2030 (USD Billion)
Figure 35 RoW Electronic Warfare Market Highlight
Figure 36 RoW Electronic Warfare Market Size, by Capability, 2018 – 2030 (USD Billion)
Figure 37 RoW Electronic Warfare Market Size, by Platform 2018 – 2030 (USD Billion)
Figure 38 RoW Electronic Warfare Market Size, by Product 2018 – 2030 (USD Billion)
Figure 39 Global Electronic Warfare Market Size, Technology   2018 – 2030 (USD Billion)
Figure 40 RoW Electronic Warfare Market Size, by Country, 2018 – 2030 (USD Billion)

Global Electronic Warfare Market Coverage

By Capability  Insight and Forecast 2025-2030

  • Electronic Support
  • Electronic Attack
  • Electronic Proportion

By Platform Insight and Forecast 2025-2030

  • Airborne
  • Naval
  • Ground and Space

By Product Insight and Forecast 2025-2030

  • EW Equipment
  • EW Operational Support

By Technology

  • Antennas
  • Anti-jam Electronic Protection Systems
  • Directed Energy Weapons
  • IR Missile Warning Systems
  • Optical Attack Solutions
  • Others

Global Electronic Warfare Market by Region

North America

  • By Capability 
  • By Platform 
  • By Product 
  • By Technology
  • By Country – U.S., Canada, and Mexico

Europe

  • By Capability 
  • By Platform 
  • By Product 
  • By Technology
  • By Country – Germany, U.K., France, Italy, Spain, Russia, and Rest of Europe

Asia-Pacific (APAC)

  • By Capability 
  • By Platform 
  • By Product 
  • By Technology
  • By Country – China, Japan, India, South Korea, and Rest of Asia-Pacific

Rest of the World (Row)

  • By Capability 
  • By Platform 
  • By Product 
  • By Technology
  • By Country – Brazil, Saudi Arabia, South Africa, U.A.E., and Other Countries
  • Leonardo SpA (Italy)
  • Lockheed Martin Corporation (U.S.)
  • Northrop Grumman Corporation (U.S.)
  • Raytheon Technologies Corporation (U.S.)
  • SAAB AB (Sweden)
  • Others

Frequently Asked Questions

The Global Electronic Warfare Market is projected to grow from USD 10.6 billion in 2023 to USD 23.5 billion by 2030, with a compound annual growth rate (CAGR) of 13.4% during the forecast period from 2025 to 2030.
The growth of the Electronic Warfare market is driven by technological advancements, including the development of sophisticated electronic warfare systems, high-sensitivity sensors, and the integration of cutting-edge technologies like digital transformation and machine learning algorithms.
North America currently dominates the Electronic Warfare market, primarily due to increased spending by the U.S. Department of Defense. Europe also holds a significant market share, while the Asia Pacific region is projected to experience the highest CAGR during the forecast period, driven by growing defense expenditures in countries like India, Japan, China, and Australia.
Major players in the Global Electronic Warfare market include Leonardo S.p.A., which specializes in aerospace, defense, and security technologies and provides advanced radio frequency technology to military customers.
Recent advancements in Electronic Warfare technology include the development of more sophisticated Electronic Countermeasure Systems (ECS) with compact, energy-efficient sensors capable of classifying a wide range of electrical signals. Digital signal processing and machine learning algorithms are also enhancing the analysis and identification of complex signals.
Companies in the Electronic Warfare market are actively investing in research and development, new product launches, partnerships, expansions, and acquisitions to meet the increasing demand for advanced EW systems and technologies.

Purchase Options

Research Methodology

  •  Desk Research / Pilot Interviews
  •  Build Market Size Model
  •  Research and Analysis
  •  Final Deliverabvle

Connect With Our Sales Team

Key Takeaways