Carbon Fiber Market Overview
The global carbon fiber market is expected to grow at a reasonably high CAGR of 10.9% from its valuation of USD 5.18 billion in 2025 to reach 10.68 billion by 2030 during the forecast period ranging from 2026 to 2035.
Carbon fiber refers to the lightweight, high-strength material which is made of thin, strong, crystalline filaments of carbon. It is normally used in aerospace, automotive, and sports equipment sectors due to its excellent durability and resistance to corrosion and temperature, offering greater performance equated to traditional materials.
The growth of the global carbon fiber market is attributed to the widespread reorganization of the automotive industry. In addition, the rising number of travelers across the globe is pushing the demand for aircrafts. As a result, there will be a significant growth in the aerospace and automotive sector thereby pushing the growth of the market as well. Apart from that, the growth will also be the result of the exceptional sales in the environment and renewable energy sector in near future.
However, the growth of the market faces a significant setback due to the high cost involved as compared with other metals. This restricts its penetration in small budget and price-sensitive industries. The growth prospects of the market however are presented by the growth in the automotive industry due to higher demand for lightweight and more fuel-efficient vehicles.
Carbon Fiber Market Segmentation
Insight by Product Type
On the basis of product type, the global carbon fiber market is divided into the continuous, long, and short. Out of these segments, the continuous segment is expected to grow at the fastest rate in the forecast period due to extensive use in a structural application in aerospace, sports goods, and other industrial sectors.
Insight by Raw Material
The global carbon fiber market is split by raw material into PAN based, pitch based and rayon based categories, where the PAN based segment is expected to hold the larger market share during the forecast period in terms of revenue and is expected to grow at the fastest rate due to the rising demand in the aerospace and automotive industry and application in layup, weaving, pre-pegging, filament winding, braiding, and protrusion for the manufacturing of various parts of automotive, aerospace, energy, pipelines and tanks, sports goods, etc.
Insight by Fiber Type
According to the fiber type, the different subsegments of the global carbon fiber market include virgin and recycled categories, where the recycled segment is expected to grow at the fastest rate during the study period due to the growing demand in emerging industry sectors, despite the fact that the virgin segment holds more than 90% market share currently.
Insight by Modulus
The global carbon fiber market is also divided on the basis of modulus into the standard, intermediate, and high segments. Out of all these moduli, the intermediate segment is expected to grow at the fastest rate during the forecast period due to its high tensile strength with high level and balanced composite properties.
Insight by Application
On the basis of application, the market is bifurcated into composite and non-composite carbon fiber segments, where the former captures the largest market share and is expected to grow at the fastest rate during the period due to higher demand.
Insight by End Use
The different end users also segregate the global carbon fiber market into aerospace & defense, automotive, wind energy, sporting goods, electrical & electronics, civil engineering, pipes & tanks, marine, and others. Out of all these categories, the aerospace & defense segment is expected to hold the largest market share during the forecast period due to higher adoption and widespread use.
Global Carbon Fiber Market Report Coverage
|
Report Metric
|
Details
|
|
Historical Period
|
2020 - 2024
|
|
Base Year Considered
|
2025
|
|
Forecast Period
|
2026 - 2035
|
|
Market Size in 2025
|
U.S.D. 5.18 Billion
|
|
Revenue Forecast in 2035
|
U.S.D. 10.68 Billion
|
|
Growth Rate
|
10.8%
|
|
Segments Covered in the Report
|
By Product Type, By Raw Material, By Modulus, By Fiber Type, By Application, and By End Use
|
|
Report Scope
|
Market Trends, Drivers, and Restraints; Revenue Estimation and Forecast; Segmentation Analysis; Companies’ Strategic Developments; Market Share Analysis of Key Players; Company Profiling
|
|
Regions Covered in the Report
|
North America, Europe, Asia-Pacific, Middle East, and Rest of the World
|
Industry Dynamics
Industry Trends
A notable trend withing the industry suggests that the horizontal and vertical market integration among carbon fiber market players will intensify their presence in the global ecosystem. In addition, the growing adoption of Electric Vehicles (EVs) for more sustainable transportation, innovations and developments in the manufacturing technologies such as 3D printing, and expansion in the renewable energy sector are few other notable trends.
Carbon Fiber Market Growth Drivers
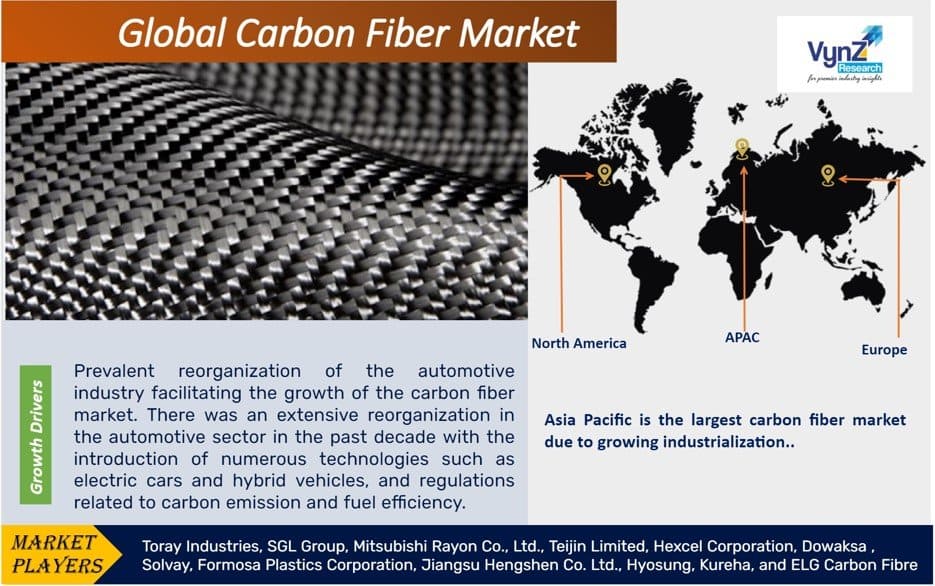
The growing importance and concerns over carbon emission and the strict regulation pushes the demand for sustainable products and therefore pushes the global carbon fiber market forward. In addition, the growing demand for the product in the aerospace and defense sectors due to its high strength-to-weight ratio contributing to fuel efficiency and performance improvements also drives the market growth. A few other notable growth factors are expansion of the automotive sector, advancements in material science due to ongoing research and development, rise in renewable energy initiatives, and favorable government initiatives and subsidies.
Carbon Fiber Market Challenges
The issues with the supply chain due to dependence on specific suppliers, which can increase cost, are a considerable challenge to the growth of the global carbon fiber market. In addition, the challenges involved in recycling and other technological barriers in implementing new manufacturing techniques are causing severe hindrance to the market growth.
Carbon Fiber Market Opportunities
The advancements in the aerospace sector and higher demand for the product along with the higher adoption in varied applications in the renewable energy sector is presenting novel growth opportunities to the market. In addition, rapid industrialization and infrastructure development in emerging economies also encourage the use of this product in the construction, transportation, and other sectors, offering new growth opportunities to the market.
Carbon Fiber Market Geographic Overview
Asia Pacific holds the largest market share primarily due to rapid industrialization. The market in this region is expected to grow more during the forecast period due to presence of some of the biggest economies. It is also attributed to the growth in the automotive sector and widespread demand.
The North American market is quite close and is expected to grow due innovations and higher adoption in the automotive industry to reduce carbon emission and increase fuel efficiency, presence of major aerospace and defense manufacturers in the region, and favorable government initiatives and environmental regulations.
Carbon Fiber Market Competitive Insight
Currently, there are a lot of organic as well as inorganic strategies adopted by the market stakeholders to sustain and expand their market presence. There is horizontal market integration among players such as SGL Carbon and Solvay collaboration to develop their composite materials based on large-tow intermediate modulus (IM) carbon fiber composites for aerospace primary structures.
Toray Industries, SGL Group, Mitsubishi Rayon Co., Ltd., Teijin Limited, Hexcel Corporation, Dowaksa, Solvay, Formosa Plastics Corporation, Jiangsu Hengshen Co. Ltd., Hyosung, Kureha, and ELG Carbon Fibre are the key players offering carbon fiber.
Recent Developments By Key Players
SGL Carbon has now received a substantial contract from a North-American automaker for high-volume serial production of carbon and glass fiber-based composite top and bottom layers for battery enclosures.
Primary Research
VynZ Research conducts extensive primary research to understand the market dynamics, validate market data, and have key opinions from industry experts. The key profiles approached within the industry include, CEO, CFO, CTO, President, Vice President, Product Managers, Regional Heads, and Others. Also, end user surveys comprising of consumers are also conducted to understand consumer behavior.
The Carbon Fiber Market report offers a comprehensive market segmentation analysis along with an estimation for the forecast period 2026–2035.
Segments Covered in the Report
- Product Type
- Raw Material
- PAN-based
- Pitch Based
- Rayon Based
- Fiber Type
- Modulus
- Standard
- Intermediate
- High
- Application
- Composite
- Prepreg
- Woven Fabric
- Molding Compound
- Non-Composite
- End Use
- Aerospace & Defence
- Automotive
- Wind Energy
- Sporting Goods
- Electrical & Electronics
- Civil Engineering
- Pipes & Tanks
- Marine
- Others
Region Covered in the Report
- North America
- Europe
- Germany
- U.K.
- France
- Italy
- Spain
- Russia
- Rest of Europe
- Asia-Pacific (APAC)
- China
- Japan
- India
- South Korea
- Rest of Asia-Pacific
- Rest of the World
- Middle East and Africa (MEA)
- South America
.png "Carbon Fiber Market Size")
Source: VynZ Research
.png)
Source: VynZ Research
