Embolotherapy Market - Analysis and Forecast (2026-2035)
Industry Insights by Product (Embolic Agents [Microspheres, Embolic coils, Liquid embolic agents, Embolic plug systems, Detachable balloons], Support Devices [Microcatheters, Guidewires]), by Procedure (Transcatheter Arterial Embolization [TAE], Transarterial Radioembolization/Selective Internal Radiation Therapy [TARE/SIRT], Transarterial Chemoembolization [TACE]), by Indication (Cancer [Liver, Kidney, Others], Neurological Diseases [Cerebral aneurysm, Arteriovenous malformation and fistulas], Peripheral Vascular Diseases, Urological & Nephrological Disorders, Gastrointestinal Disorders), by End User (Hospitals & Clinics, Ambulatory Surgical Centers [ASCs], Others), and by Geography (U.S., Canada, Germany, U.K., France, China, Japan, India, and Rest of the World)
| Status : Published | Published On : Oct, 2025 | Report Code : VRHC1210 | Industry : Healthcare | Available Format :

|
Page : 271 |
Embolotherapy Market - Analysis and Forecast (2026-2035)
Industry Insights by Product (Embolic Agents [Microspheres, Embolic coils, Liquid embolic agents, Embolic plug systems, Detachable balloons], Support Devices [Microcatheters, Guidewires]), by Procedure (Transcatheter Arterial Embolization [TAE], Transarterial Radioembolization/Selective Internal Radiation Therapy [TARE/SIRT], Transarterial Chemoembolization [TACE]), by Indication (Cancer [Liver, Kidney, Others], Neurological Diseases [Cerebral aneurysm, Arteriovenous malformation and fistulas], Peripheral Vascular Diseases, Urological & Nephrological Disorders, Gastrointestinal Disorders), by End User (Hospitals & Clinics, Ambulatory Surgical Centers [ASCs], Others), and by Geography (U.S., Canada, Germany, U.K., France, China, Japan, India, and Rest of the World)
Embolotherapy Market Overview
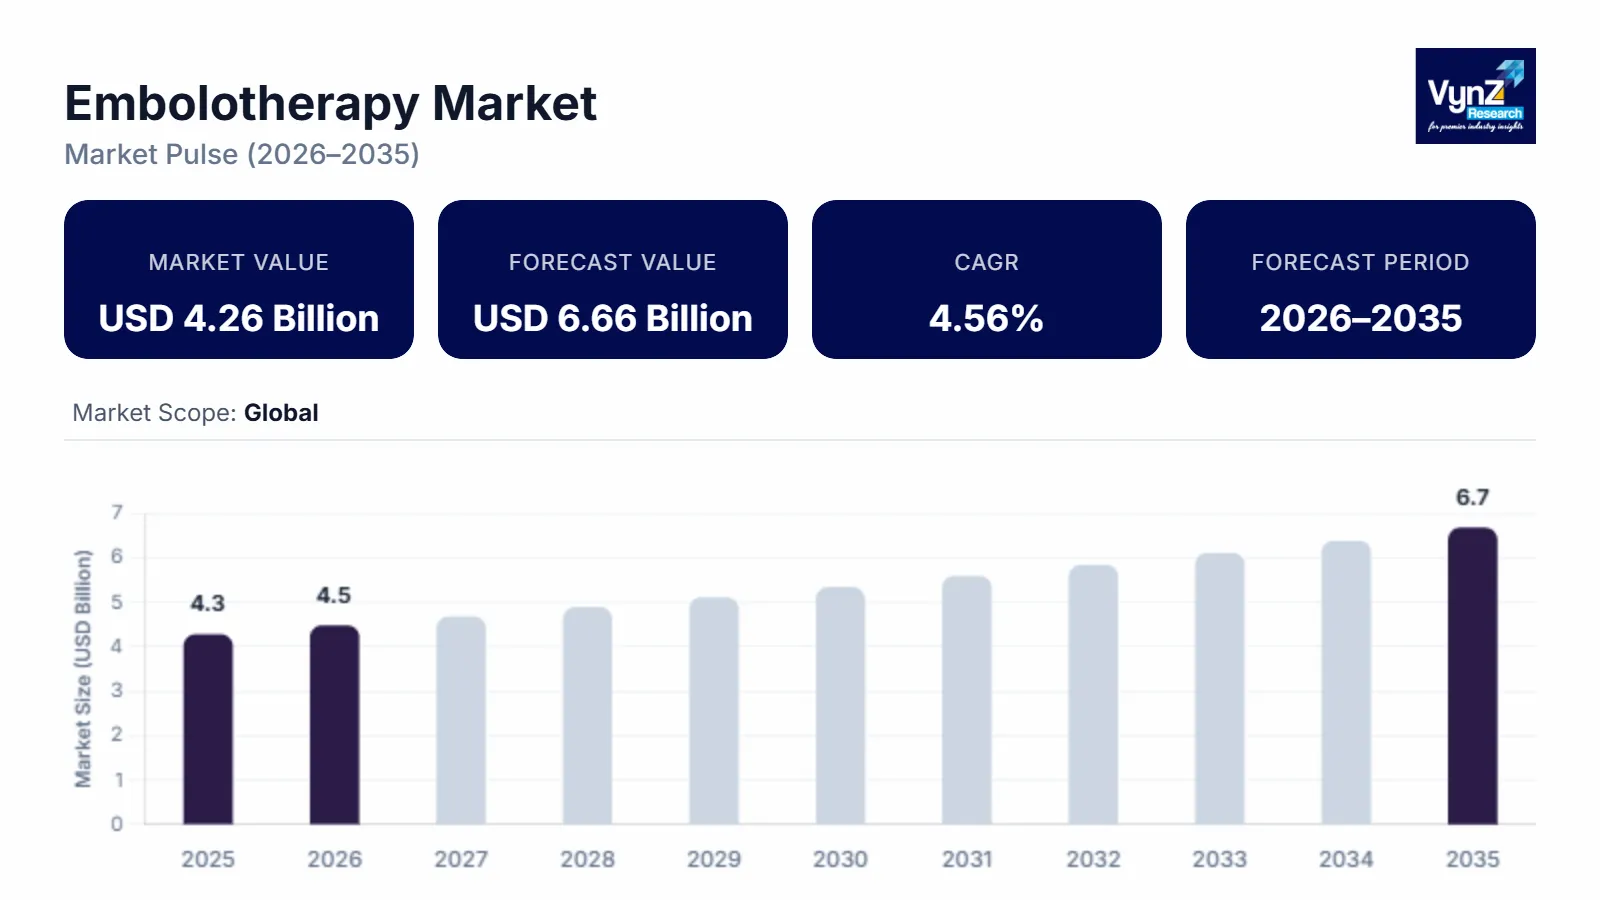
The Global Embolotherapy Market was valued at USD 4.26 billion in 2025 and is expected to reach approximately USD 4.46 billion in 2026. It is projected to reach around USD 6.66 billion by 2035, expanding at a CAGR of about 4.56 % during the forecast period from 2026 to 2035. The market is growing significantly due to the extensive incidences of liver cancer, uterine fibroids, vascular diseases, and stroke,s along with technological progressions being undertaken in this market. Furthermore, increasing preference pertaining to non-invasive processes and excessive funds, grants, and investments availed to key players by public-private enterprises for research are other factors that are bolstering the growth of the global embolotherapy market at a significant rate. Embolotherapy techniques typically involve the introduction of embolic agents or devices into blood vessels to block or occlude the blood supply to the target area. These agents can be in the form of particles, coils, liquid embolics, or other specialised devices. By cutting off the blood supply, embolisation can help shrink or destroy tumors, control bleeding, alleviate symptoms, or prevent further growth or rupture of an aneurysm. The embolotherapy market has experienced significant growth in recent years due to advancements in technology, increasing prevalence of chronic diseases, and a shift toward minimally invasive procedures. Factors such as rising cancer incidence, growing geriatric population, and the demand for alternative treatments to surgery have also contributed to the market expansion.
Embolotherapy is a form of endovascular treatment that intends to obstruct abnormal blood vessels for controlling bleeding, devascularise organs, arteriovenous malformations and close fistulae. Furthermore, embolotherapy is performing crucial role in medicine domain that aims at the accomplishment of occlusion and utilises various embolic agents and minimally invasive techniques for instance coils, Gelfoam, angiographic, balloons and catheters. This technique helps in treating wide range of problems and utilises varies therapies such as UFE, TACE and venous embolisation for the treatment of arthritis embolization and haemorrhoid and is further witnessing technological progressions that is contributing towards rampant growth of global embolotherapy market.
Embolotherapy Market Segmentation
Insight by Product
- Embolic agents
- Support devices
On the basis of product, the global embolotherapy market is categorised into embolic agents, and support devices, wherein the embolic agents category held the larger share in the market in 2025, owing to the evolution of advanced embolic agents, such as calibrated microspheres for bland embolization, and radioactive Y-90 microspheres to treat primary or secondary liver diseases.
Embolic agents are further categorized into microspheres, embolic coils, liquid embolic agents, embolic plug systems, and detachable balloons.
Support devices category is also further segmented into microcatheters and guidewires.
Insight by Procedure
- TAE (transcatheter arterial embolization)
- TACE (transarterial chemoembolization)
- TARE/SIRT (transarterial radioembolization/selective internal radiation therapy)
On the basis of procedure, the global embolotherapy market is categorised into TAE (transcatheter arterial embolization), TACE (transarterial chemoembolization) and TARE/SIRT (transarterial radioembolization/selective internal radiation therapy). Amongst these segments, TAE segment is anticipated to generate largest revenue throughout the estimated period as transarterial embolization is used for treating kidney cancer, neuroendocrine tumors and liver cancer and is further utilised for the treatment of aneurysyms, uterine fibroids and various such diseases and are commonly being known as TAE or arterial embolization and is performing vital role in strengthening the growth of the global embolotherapy market at rapid pace.
Insight by End User
- Hospitals & Clinics
- Ambulatory Surgical Centers [ASCs]
- Others
Based on end user, the global embolotherapy market is segmented into ambulatory surgical centers (ASCs), hospitals and clinics, and others. Amongst these segments, hospitals and clinics are dominating in terms of revenue throughout the estimated period owing to extensive accessibility of reimbursements policies being implemented by hospitals and clinics and excessive adoption of these devices in small clinics, big hospitals and critical care units.
Insight by Indication
- Cancer
- Neurological Diseases
- Peripheral Vascular Diseases
- Urological & Nephrological Disorders
- Gastrointestinal Disorders
Global Embolotherapy Market Report Coverage
|
Report Metric |
Details |
|
Historical Period |
2020 - 2024 |
|
Base Year Considered |
2025 |
|
Forecast Period |
2026 - 2035 |
|
Market Size in 2025 |
U.S.D. 4.26 Billion |
|
Revenue Forecast in 2035 |
U.S.D. 6.66 Billion |
|
Growth Rate |
4.56% |
|
Segments Covered in the Report |
By Product, By Procedure, By Indication and By End User |
|
Report Scope |
Market Trends, Drivers, and Restraints; Revenue Estimation and Forecast; Segmentation Analysis; Companies’ Strategic Developments; Market Share Analysis of Key Players; Company Profiling |
|
Regions Covered in the Report |
North America, Europe, Asia-Pacific, Middle East, South America and Rest of the World |
Industry Dynamics
Embolotherapy Market Growth Drivers
Increasing target population of patient along with extensive preference of patients for minimally invasive techniques are the key factors that are driving the growth of global embolotherapy market. Several patients across the globe require embolotherapy processes for treating several diseases for instance liver cancer tumors, kidney cancer, hepatocellular, renal cell carcinoma, aneurysms and varicose veins. Moreover, embolotherapy has wider usage in clinical settings such as in the treatment of non-trauma related vascular disorders and treatment of inflammation that is significantly contributing towards the growth of the global embolotherapy market.
Furthermore, improving healthcare infrastructure along with increasing expenditure on healthcare domain are other factors that are driving the growth of global embolotherapy market. Additionally, increasing burden of target diseases, grants and funds for the growth of novel offerings are other factors pertaining towards the growth of global embolotherapy market. Furthermore, excessive demand for minimally invasive surgery procedures, favourable reimbursement scenario and new product launches are further anticipated to strengthen the growth of global embolotherapy market.
Furthermore, increasing adoption of minimally invasive surgical processes such as neurological, vascular and urological and existence of consolidated market structure amongst healthcare providers along with their increasing purchasing power are the key factors that are pertaining towards the growth of global embolotherapy market.
Embolotherapy Market Trends
Interventional Radiology: In interventional radiology, embolization techniques are used to treat conditions such as uterine fibroids, benign prostatic hyperplasia, liver tumors, vascular malformations, and varicoceles.
Oncology: Embolization is employed in the treatment of certain types of tumors, particularly in the liver, such as hepatocellular carcinoma and metastatic liver tumors. It can be used as a primary treatment or as a prelude to surgery or other therapies.
Neurology: In neurointerventional procedures, embolization techniques are used to treat brain aneurysms, arteriovenous malformations (AVMs), and certain types of tumors located in the brain or spine.
Peripheral Vascular Disease: Embolization is used to treat peripheral vascular diseases like peripheral arterial occlusion, deep vein thrombosis, and arteriovenous fistulas.
Embolotherapy Market Restraints
Challenges and risks related with embolization is the key factor that is anticipated to hamper the growth of the global embolotherapy market.
Embolotherapy Market Geography Insight
North America has accounted for the largest share in embolotherapy market, globally and is predicted to grow significantly during the forecast period, owing to the increasing emphasis in the region towards development of advanced embolic agents, extensive pervasiveness of incidents that necessitates adoption of embolization processes. Moreover, established healthcare system in this region is the key factor that is further anticipated to drive the growth of embolotherapy market in this region.
Moreover, embolotherapy market in Asia-Pacific is anticipated to witness fastest growth during the forecast period owing to the increasing number of patient’s population, increasing emphasis by the government authorities in the region towards healthcare expenditure and rapid incidences of cancer among individuals. Additionally, presence of key players emphasizing upon technological advancements are the key factors that are pertaining towards the growth of embolotherapy market in this region.
Embolotherapy Market Competitive Insight
The eminent key players in the global embolotherapy market are undertaking considerable investment decisions and launching new products in order gain competitive advantage. Moreover, entering into partnership agreements and performing mergers & acquisitions are the key development strategies being implemented by the crucial players in the global embolotherapy market.
Merit Medical Systems, Inc. is a leading manufacturer and marketer of proprietary disposable medical devices. Company serves client hospitals worldwide with a domestic and international sales force and clinical support team.
Acandis is a pioneer of current and future innovations in the field of minimally invasive endovascular technologies and solutions for the treatment of neurovascular diseases based on miniaturised medical technology. It has specialised in the development, manufacturing and marketing of innovative products also for acute and preventive stroke treatment. Acandis strives to grow steadily and operate internationally in order to make innovations accessible to more people accross the globe.
Some of the players having prominent presence in the global embolotherapy market include Merit Medical Systems, Acandis GmbH, Medtronic plc, Abbott Laboratories, Boston Scientific Corporation, Cook Medical, Terumo Corporation, Stryker Corporation, Johnson & Johnson, BALT Extrusion, Sirtex Medical Limited, Kaneka Corporation, Meril Life Sciences Pvt. Ltd., Penumbra, Inc., and BTG Plc.
Recent Developments by Key Players
Merit Medical Systems, Inc. is a global leader of healthcare technology has released the basixSKY Inflation Device which is the latest addition that includes both digital and analog devices. The basixSKY is available as a standalone solution and in kits with Merit Angioplasty Packs, configured to offer complementing AccessPLUS™, Honor®, and PhD™ hemostasis valves.
Abbott has received CE Mark in Europe for its Assert-IQ™ insertable cardiac monitor (ICM) that offers physicians a new option for diagnostic evaluation and long-term monitoring of people experiencing abnormal heartbeats. Assert-IQ ICM is a new addition to Abbott's growing portfolio of connected health devices which is able to detect even hard-to-spot irregularities with heartbeats and help physicians determine the best treatment course.
Primary Research
VynZ Research conducts extensive primary research to understand the market dynamics, validate market data and have key opinions from the industry experts. The key profiles approached within the industry include CEO, CFO, CTO, President, Vice President, Product Managers, Regional Heads, and Others. Also, end-user surveys comprising of consumers are also conducted to understand consumer behavior.
The Embolotherapy Market report offers a comprehensive market segmentation analysis along with an estimation for the forecast period 2026–2035.
Segments Covered in the Report
- By Product
- Embolic Agents
- Microspheres
- Embolic Coils
- Liquid Embolic Agents
- Embolic Plug Systems
- Detachable Balloons
- Support Devices
- Microcatheters
- Guidewires
- Embolic Agents
- By Procedure
- Transcatheter Arterial Embolization (TAE)
- Transarterial Chemoembolization (TACE)
- Transarterial Radioembolization (TARE)/Selective Internal Radiation Therapy (SIRT)
- By Indication
- Cancer
- Liver
- Kidney
- Others
- Neurological Diseases
- Cerebral Aneurysm
- Arteriovenous Malformation And Fistulas
- Peripheral Vascular Diseases
- Urological and Nephrological Disorders
- Gastrointestinal Disorders
- Cancer
- By End User
- Hospitals and Clinics
- Ambulatory Surgical Centers (ASCs)
- Others
Region Covered in the Report
- North America
- U.S.
- Canada
- Mexico
- Europe
- Germany
- U.K.
- France
- Italy
- Spain
- Russia
- Rest of Europe
- Asia-Pacific (APAC)
- China
- Japan
- India
- South Korea
- Rest of Asia-Pacific
- Rest of the World (RoW)
- Brazil
- Saudi Arabia
- South Africa
- U.A.E.
- Other Countries
.png)
Source: VynZ Research
.png)
Source: VynZ Research
Frequently Asked Questions
Purchase Options
Latest Report
Research Methodology
- Desk Research / Pilot Interviews
- Build Market Size Model
- Research and Analysis
- Final Deliverable
Connect With Our Sales Team
- Toll-Free: 1 888 253 3960
- Phone: +91 9960 288 381
- Email: enquiry@vynzresearch.com
Embolotherapy Market