
Application Performance Management Market Size & Share Growth Forecast Report (2026-2035)
Industry Insight by Component (Solutions, Services, Application Performance Monitoring and Analytics, End-User Experience Monitoring, Infrastructure and Network Monitoring, Professional Services, Managed Services), by Deployment (Cloud, On-Premises), by Enterprise Size (Small and Medium-Sized Enterprises (SMEs), Large Enterprises), by End User (Banking, Financial Services and Insurance (BFSI), IT and Telecommunications, Retail and E-commerce, Healthcare and Life Sciences, Manufacturing, Government and Public Sector, Others)
| Status : Published | Published On : Oct, 2026 | Report Code : VRSME9227 | Industry : Semiconductor & Electronics | Available Format :

|
Page : 153 |
Application Performance Management Market Overview
The application performance management market was estimated at approximately USD 8.45 billion in 2025 and is projected to reach USD 9.51 billion in 2026, rising to around USD 27.45 billion by 2035, at a proposed CAGR of 12.5% from 2026 to 2035.
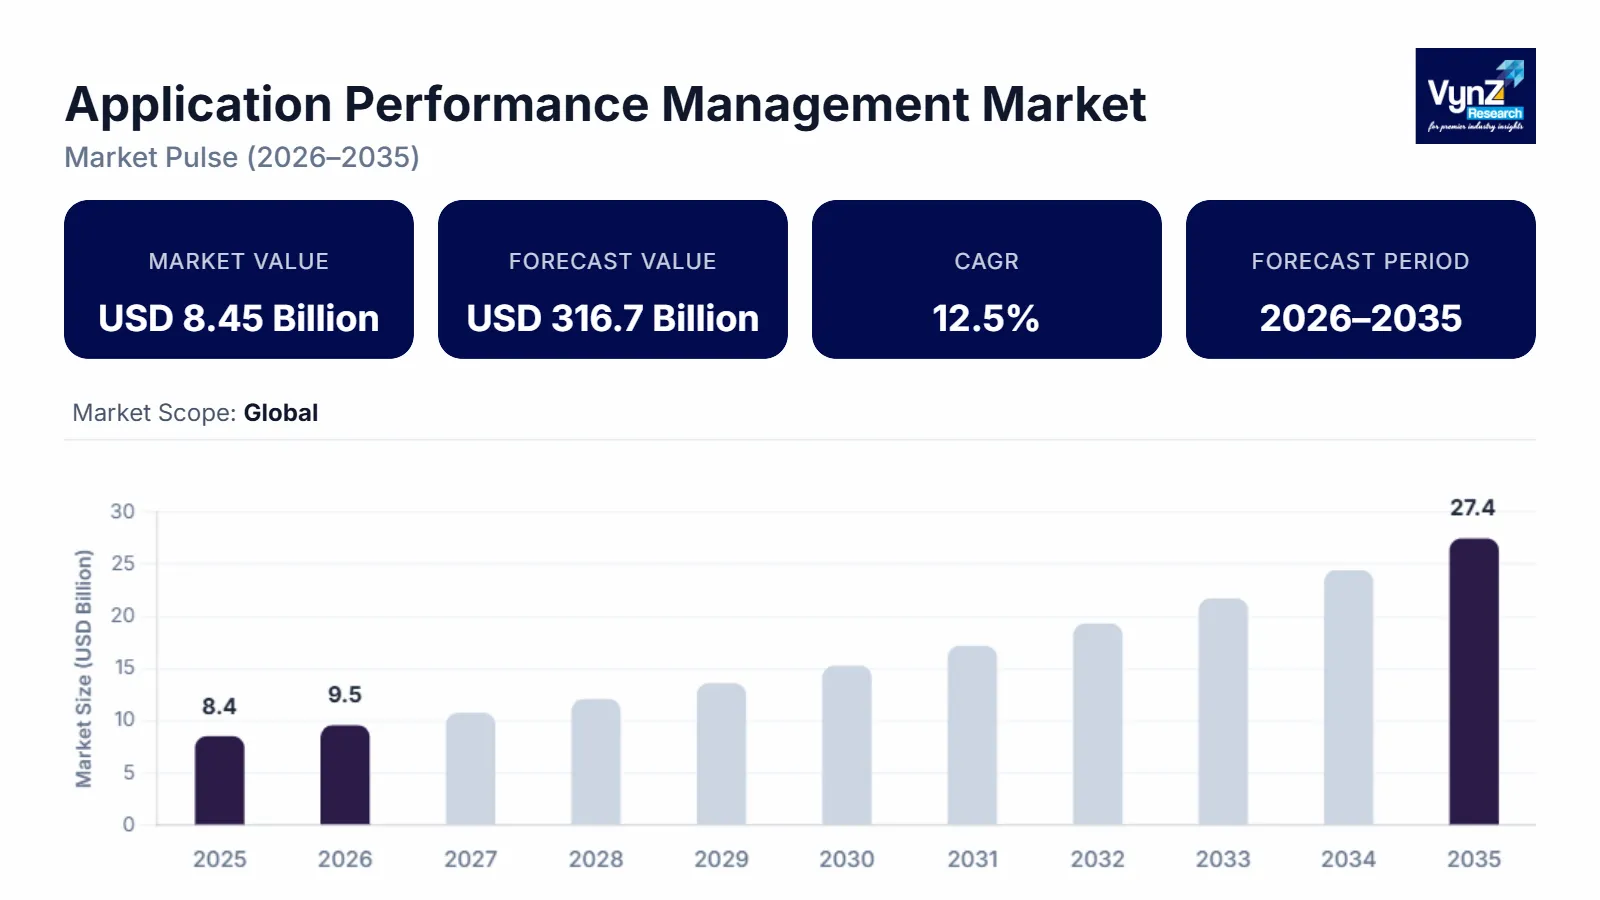
Market growth is driven by cloud-native application deployment, rising service reliability requirements, and the expansion of microservices-based architectures, alongside increasing adoption of AI-enabled observability. NIST’s SP 800-204C identifies continuous application observability as part of DevSecOps for microservices-based systems, while the U.S. Government Accountability Office’s 2025 report highlights the continuing need to modernize aging federal IT systems. These developments reinforce demand for tools that improve application visibility, identify performance issues, and support reliable digital services.
Research Methodology
The analysis draws on secondary research covering market estimates, application performance monitoring technologies, enterprise cloud adoption, vendor announcements, and industry developments. Relevant evidence was reviewed from the National Institute of Standards and Technology (NIST), Eurostat, the U.S. Government Accountability Office, and official company announcements. The VynZ Research team uses these sources to assess market structure, adoption drivers, competitive positioning, and forecast assumptions. Segment shares and forward growth rates not explicitly published by government sources are treated as market estimates rather than official statistics.
Research Highlights
- Solutions accounted for approximately 70.15% of the market in 2025, reflecting demand for integrated application monitoring and analytics capabilities.
- Cloud-based platforms represented 62.15% of the market in 2025, supported by scalability and the growing use of distributed applications.
- Large enterprises held a 57.05% share in 2025 because of their complex application estates and operational requirements.
- Small and medium-sized enterprises are forecast to record a 33.55% CAGR through 2031 as SaaS-based monitoring lowers adoption barriers.
- North America accounted for 37.75% of the market in 2025, supported by established technology infrastructure and the presence of major APM providers.
Application Performance Management Market Dynamics
Market Trends
The application performance management industry is shifting from isolated application monitoring toward unified observability platforms that correlate metrics, logs, traces, and user-experience data. This approach helps IT teams identify the source of performance issues across cloud services, databases, networks, and application code rather than relying on separate monitoring tools. Another important trend is the integration of artificial intelligence into incident detection and troubleshooting. Vendors are developing automated root-cause analysis, predictive alerts, and AI-assisted diagnostics to reduce manual investigation. NIST’s guidance on microservices-based DevSecOps also recognizes observability as a continuous monitoring function within modern application environments.
Growth Drivers
The market is supported by rising enterprise reliance on web applications, mobile platforms, cloud software, and digital transactions. Application outages and slow response times can interrupt customer-facing services and internal operations, encouraging organizations to invest in real-time monitoring and performance analytics. Complex microservices environments further increase the need for distributed tracing and dependency mapping. Cloud adoption is another major growth driver, as applications increasingly operate across public cloud, private infrastructure, and hybrid environments.
Market Restraints / Challenges
Despite strong adoption prospects, the market faces challenges related to implementation costs, data-ingestion expenses, and the complexity of integrating monitoring tools with legacy applications. Large volumes of telemetry can increase storage and processing requirements, while excessive alerts may create operational noise rather than improving incident response. Smaller organizations may find advanced platforms difficult to deploy without dedicated observability specialists. Data privacy, security, and regulatory requirements also influence platform selection, particularly when telemetry contains sensitive information or crosses geographic boundaries. NIST’s microservices security guidance emphasizes the need to address security monitoring, access management, and service resilience within distributed application systems. These requirements can increase deployment complexity and extend procurement decisions.
Market Opportunities
The expansion of AI-enabled applications creates opportunities for performance management platforms that can monitor complex workloads, trace dependencies, and identify performance degradation before it affects end users. Vendors that integrate application monitoring with automated diagnostics, developer workflows, and cloud cost visibility can address demand for faster issue resolution and more efficient operations. Small and medium-sized enterprises also represent an important growth opportunity as cloud-based subscription models reduce the need for extensive on-premises infrastructure.
Global Application Performance Management Market Report Coverage
|
Report Metric |
Details |
|
Historical Period |
2020 - 2024 |
|
Base Year Considered |
2025 |
|
Forecast Period |
2026 - 2035 |
|
Market Size in 2025 |
USD 8.45 Billion |
|
Revenue Forecast in 2035 |
USD 27.45 Billion |
|
Growth Rate |
12.5% |
|
Segments Covered in the Report |
Component, Deployment, Enterprise Size, End User |
|
Report Scope |
Market Trends, Drivers, and Restraints; Revenue Estimation and Forecast; Segmentation Analysis; Companies’ Strategic Developments; Market Share Analysis of Key Players; Company Profiling |
|
Regions Covered in the Report |
North America, Europe, Asia Pacific, Rest of the World |
|
Key Companies |
AppDynamics, BMC Software, Cisco, Datadog, Dynatrace, Elastic, IBM, New Relic, SolarWinds, Splunk |
|
Customization |
Available upon request |
Application Performance Management Market Segmentation
By Component
Solutions held the largest share, accounting for approximately 70.15% in 2025, as enterprises increasingly require application performance monitoring, analytics, end-user experience monitoring, and infrastructure visibility through integrated platforms.
Services are expected to expand at a proposed CAGR of 13.0% from 2026 to 2035, supported by demand for implementation, integration, managed monitoring, and platform optimization.
By Deployment
Cloud-based solutions accounted for approximately 62.15% of the market in 2025, reflecting their scalability, remote accessibility, and compatibility with distributed application environments.
Cloud deployment is projected to register a proposed CAGR of 14% from 2026 to 2035, driven by cloud-native development, SaaS adoption, and the growing use of hybrid and multi-cloud architectures.
By Enterprise Size
Large enterprises accounted for approximately 57.05% of the market in 2025, supported by extensive application portfolios, complex technology environments, and the need to maintain performance across multiple business units.
SMEs are expected to record a proposed CAGR of 14.5% from 2026 to 2035, as subscription-based platforms and automated instrumentation reduce the cost and expertise required for deployment.
By End User
BFSI held the largest share at approximately 23.65% in 2025, supported by high transaction volumes, digital banking services, and the need to maintain reliable customer-facing applications.
Healthcare and life sciences are expected to record a proposed CAGR of 14% from 2026 to 2035, supported by increasing use of digital health platforms, connected systems, and online services.
Regional Insights
North America
North America accounted for approximately 37.75% of the market in 2025, making it the leading regional market in Mordor Intelligence’s assessment. Demand is supported by established enterprise software adoption, extensive cloud infrastructure, and the presence of major performance monitoring vendors. The United States represents a significant contributor because businesses and public agencies depend on digital applications across financial services, retail, healthcare, and technology.
Europe
Europe is estimated to have represented approximately 24% of the market in 2025, supported by enterprise cloud adoption, digital transformation, and growing reliance on online business applications. Demand spans financial services, manufacturing, telecommunications, retail, and public-sector digital services, where application availability and response times affect operational performance.
Asia Pacific
Asia Pacific is estimated to have accounted for approximately 18% of the market in 2025 and is expected to remain a key growth region as organizations expand cloud services, digital payments, e-commerce, and mobile applications. Enterprises in major economies, including China, India, Japan, South Korea, and Australia, are investing in digital platforms that require reliable performance across expanding user bases.
Rest of the World
The Rest of the World region, comprising Latin America, the Middle East, and Africa, is estimated to have represented the remaining 20.25% of the market in 2025. Adoption is supported by digital service expansion, cloud migration, and increased use of online applications across financial services, telecommunications, retail, and government operations. Organizations are increasingly seeking better visibility into application availability and service quality as digital channels become more important.
Competitive Landscape / Company Insights
The application performance management market is competitive, with established software vendors and cloud technology providers expanding their observability capabilities. Competition centers on automated diagnostics, AI-assisted analysis, cloud compatibility, and unified visibility across applications and infrastructure. Vendors are also strengthening integrations with developer tools and incident-response workflows to improve operational efficiency. Recent product announcements from Dynatrace, Datadog, New Relic, and Google Cloud illustrate the industry’s movement toward integrated monitoring and AI-assisted troubleshooting.
Mini Profiles
AppDynamics provides application performance monitoring and business transaction visibility, helping enterprises identify application bottlenecks and connect technical performance with business outcomes.
BMC Software offers enterprise IT management and application monitoring capabilities, supporting performance analysis across complex technology environments and established enterprise systems.
Cisco provides application monitoring and observability through its software portfolio, including AppDynamics and Splunk technologies, supporting visibility across applications, infrastructure, and networks.
Datadog offers cloud application monitoring, distributed tracing, infrastructure visibility, and analytics, enabling technology teams to investigate performance issues across distributed services.
Elastic provides search-based observability capabilities for logs, metrics, and application data, helping organizations investigate system behavior and troubleshoot application performance issues.
Key Players
- AppDynamics
- BMC Software
- Cisco
- Datadog
- Dynatrace
- Elastic
- IBM
- New Relic
- SolarWinds
- Splunk
Recent Developments
Dynatrace introduced enhanced real-user monitoring capabilities in 2026, combining frontend telemetry with backend context, logs, traces, security events, and business data. The enhancements aim to improve application troubleshooting and provide more actionable insight into user experience.
IBM expanded its observability focus toward generative AI applications through Instana’s GenAI Observability capabilities in 2025. The offering helps teams monitor AI application performance, trace requests across services, and track model-related usage and costs.
New Relic launched Agentic AI Monitoring and an AI Model Context Protocol server in 2025. These capabilities are intended to provide visibility into connected AI agents and support standardized integrations across enterprise workflows.
SolarWinds introduced an AI Agent and additional AI capabilities in 2025 to help IT teams identify issues, accelerate diagnostics, and automate operational responses. The announcement reflects the growing emphasis on AI-supported observability and operational resilience.
Global Application Performance Management Market Coverage
Component Insight and Forecast 2026 - 2035
- Solutions
- Services
- Application Performance Monitoring and Analytics
- End-User Experience Monitoring
- Infrastructure and Network Monitoring
- Professional Services
- Managed Services
Deployment Insight and Forecast 2026 - 2035
- Cloud
- On-Premises
Enterprise Size Insight and Forecast 2026 - 2035
- Small and Medium-Sized Enterprises (SMEs)
- Large Enterprises
End User Insight and Forecast 2026 - 2035
- Banking
- Financial Services and Insurance (BFSI)
- IT and Telecommunications
- Retail and E-commerce
- Healthcare and Life Sciences
- Manufacturing
- Government and Public Sector
- Others
Global Application Performance Management Market by Region
- North America
- By Component
- By Deployment
- By Enterprise Size
- By End User
- By Country - U.S., Canada, Mexico
- Europe
- By Component
- By Deployment
- By Enterprise Size
- By End User
- By Country - Germany, U.K., France, Italy, Spain, Russia, Rest of Europe
- Asia-Pacific (APAC)
- By Component
- By Deployment
- By Enterprise Size
- By End User
- By Country - China, Japan, India, South Korea, Vietnam, Thailand, Malaysia, Rest of Asia-Pacific
- Rest of the World (RoW)
- By Component
- By Deployment
- By Enterprise Size
- By End User
- By Country - Brazil, Saudi Arabia, South Africa, U.A.E., Other Countries
Table of Contents for Application Performance Management Market Report
1. Research Overview
1.1. The Report Offers
1.2. Market Coverage
1.2.1. By
Component
1.2.2. By
Deployment
1.2.3. By
Enterprise Size
1.2.4. By
End User
1.3. Research Phases
1.4. Limitations
1.5. Market Methodology
1.5.1. Data Sources
1.5.1.1.
Primary Research
1.5.1.2.
Secondary Research
1.5.2. Methodology
1.5.2.1.
Data Exploration
1.5.2.2.
Forecast Parameters
1.5.2.3.
Data Validation
1.5.2.4.
Assumptions
1.5.3. Study Period & Data Reporting Unit
2. Executive Summary
3. Industry Overview
3.1. Industry Dynamics
3.1.1. Market Growth Drivers
3.1.2. Market Restraints
3.1.3. Key Market Trends
3.1.4. Major Opportunities
3.2. Industry Ecosystem
3.2.1. Porter’s Five Forces Analysis
3.2.2. Recent Development Analysis
3.2.3. Value Chain Analysis
3.3. Competitive Insight
3.3.1. Competitive Position of Industry
Players
3.3.2. Market Attractive Analysis
3.3.3. Market Share Analysis
4. Global Market Estimate and Forecast
4.1. Global Market Overview
4.2. Global Market Estimate and Forecast to 2035
5. Market Segmentation Estimate and Forecast
5.1. By Component
5.1.1. Solutions
5.1.1.1. Market Definition
5.1.1.2. Market Estimation and Forecast to 2035
5.1.2. Services
5.1.2.1. Market Definition
5.1.2.2. Market Estimation and Forecast to 2035
5.1.3. Application Performance Monitoring and Analytics
5.1.3.1. Market Definition
5.1.3.2. Market Estimation and Forecast to 2035
5.1.4. End-User Experience Monitoring
5.1.4.1. Market Definition
5.1.4.2. Market Estimation and Forecast to 2035
5.1.5. Infrastructure and Network Monitoring
5.1.5.1. Market Definition
5.1.5.2. Market Estimation and Forecast to 2035
5.1.6. Professional Services
5.1.6.1. Market Definition
5.1.6.2. Market Estimation and Forecast to 2035
5.1.7. Managed Services
5.1.7.1. Market Definition
5.1.7.2. Market Estimation and Forecast to 2035
5.2. By Deployment
5.2.1. Cloud
5.2.1.1. Market Definition
5.2.1.2. Market Estimation and Forecast to 2035
5.2.2. On-Premises
5.2.2.1. Market Definition
5.2.2.2. Market Estimation and Forecast to 2035
5.3. By Enterprise Size
5.3.1. Small and Medium-Sized Enterprises (SMEs)
5.3.1.1. Market Definition
5.3.1.2. Market Estimation and Forecast to 2035
5.3.2. Large Enterprises
5.3.2.1. Market Definition
5.3.2.2. Market Estimation and Forecast to 2035
5.4. By End User
5.4.1. Banking
5.4.1.1. Market Definition
5.4.1.2. Market Estimation and Forecast to 2035
5.4.2. Financial Services and Insurance (BFSI)
5.4.2.1. Market Definition
5.4.2.2. Market Estimation and Forecast to 2035
5.4.3. IT and Telecommunications
5.4.3.1. Market Definition
5.4.3.2. Market Estimation and Forecast to 2035
5.4.4. Retail and E-commerce
5.4.4.1. Market Definition
5.4.4.2. Market Estimation and Forecast to 2035
5.4.5. Healthcare and Life Sciences
5.4.5.1. Market Definition
5.4.5.2. Market Estimation and Forecast to 2035
5.4.6. Manufacturing
5.4.6.1. Market Definition
5.4.6.2. Market Estimation and Forecast to 2035
5.4.7. Government and Public Sector
5.4.7.1. Market Definition
5.4.7.2. Market Estimation and Forecast to 2035
5.4.8. Others
5.4.8.1. Market Definition
5.4.8.2. Market Estimation and Forecast to 2035
6. North America Market Estimate and Forecast
6.1. By
Component
6.2. By
Deployment
6.3. By
Enterprise Size
6.4. By
End User
6.4.1.
U.S. Market Estimate and Forecast
6.4.2.
Canada Market Estimate and Forecast
6.4.3.
Mexico Market Estimate and Forecast
7. Europe Market Estimate and Forecast
7.1. By
Component
7.2. By
Deployment
7.3. By
Enterprise Size
7.4. By
End User
7.4.1.
Germany Market Estimate and Forecast
7.4.2.
France Market Estimate and Forecast
7.4.3.
U.K. Market Estimate and Forecast
7.4.4.
Italy Market Estimate and Forecast
7.4.5.
Spain Market Estimate and Forecast
7.4.6.
Russia Market Estimate and Forecast
7.4.7.
Rest of Europe Market Estimate and Forecast
8. Asia-Pacific (APAC) Market Estimate and Forecast
8.1. By
Component
8.2. By
Deployment
8.3. By
Enterprise Size
8.4. By
End User
8.4.1.
China Market Estimate and Forecast
8.4.2.
Japan Market Estimate and Forecast
8.4.3.
India Market Estimate and Forecast
8.4.4.
South Korea Market Estimate and Forecast
8.4.5.
Rest of Asia-Pacific Market Estimate and Forecast
9. Rest of the World (RoW) Market Estimate and Forecast
9.1. By
Component
9.2. By
Deployment
9.3. By
Enterprise Size
9.4. By
End User
9.4.1.
Brazil Market Estimate and Forecast
9.4.2.
Saudi Arabia Market Estimate and Forecast
9.4.3.
South Africa Market Estimate and Forecast
9.4.4.
U.A.E. Market Estimate and Forecast
9.4.5.
Other Countries Market Estimate and Forecast
10. Company Profiles
10.1.
AppDynamics
10.1.1.
Snapshot
10.1.2.
Overview
10.1.3.
Offerings
10.1.4.
Financial
Insight
10.1.5.
Recent
Developments
10.2.
BMC Software
10.2.1.
Snapshot
10.2.2.
Overview
10.2.3.
Offerings
10.2.4.
Financial
Insight
10.2.5.
Recent
Developments
10.3.
Cisco
10.3.1.
Snapshot
10.3.2.
Overview
10.3.3.
Offerings
10.3.4.
Financial
Insight
10.3.5.
Recent
Developments
10.4.
Datadog
10.4.1.
Snapshot
10.4.2.
Overview
10.4.3.
Offerings
10.4.4.
Financial
Insight
10.4.5.
Recent
Developments
10.5.
Dynatrace
10.5.1.
Snapshot
10.5.2.
Overview
10.5.3.
Offerings
10.5.4.
Financial
Insight
10.5.5.
Recent
Developments
10.6.
Elastic
10.6.1.
Snapshot
10.6.2.
Overview
10.6.3.
Offerings
10.6.4.
Financial
Insight
10.6.5.
Recent
Developments
10.7.
IBM
10.7.1.
Snapshot
10.7.2.
Overview
10.7.3.
Offerings
10.7.4.
Financial
Insight
10.7.5.
Recent
Developments
10.8.
New Relic
10.8.1.
Snapshot
10.8.2.
Overview
10.8.3.
Offerings
10.8.4.
Financial
Insight
10.8.5.
Recent
Developments
10.9.
SolarWinds
10.9.1.
Snapshot
10.9.2.
Overview
10.9.3.
Offerings
10.9.4.
Financial
Insight
10.9.5.
Recent
Developments
10.10.
Splunk
10.10.1.
Snapshot
10.10.2.
Overview
10.10.3.
Offerings
10.10.4.
Financial
Insight
10.10.5.
Recent
Developments
11. Appendix
11.1. Exchange Rates
11.2. Abbreviations
Note: Financial insight and recent developments of different companies are subject to the availability of information in the secondary domain.
Frequently Asked Questions
Purchase Options
Latest Report
Research Methodology
- Desk Research / Pilot Interviews
- Build Market Size Model
- Research and Analysis
- Final Deliverable
Connect With Our Sales Team
- Toll-Free: +1-888-253-3960
- Phone: +91 9960 288 381
- Email: enquiry@vynzresearch.com
Application Performance Management Market