Microdisplays Market Overview
During the forecast period, the Global Microdisplays Market is projected to experience substantial growth, with an estimated increase from USD 0.71 billion in 2023 to USD 3.7 billion by 2030. This growth is expected to be at a remarkable compound annual growth rate (CAGR) of 38.2%.
Microdisplays are defined as a compact and small-sized display that requires magnifying optics to use it. It encompasses user-configurability technology, high resolution, and high pixel density and is used in a wide range of applications such as health monitoring, lifestyle support, entertainment, and fitness monitoring via smartwatches, smart bands, and smart glasses. Factors propelling the growth of the microdisplays market include compact size, technological development in microdisplays, increasing demand for AR devices in the healthcare sector, increasing adoption of wearable devices, increasing use of HMD in various industries, rising demand for OLED microdisplays, and increasing adoption of ADAS and HUD. There is extensive use of microdisplays in the defense & military sector for faster performance and real-time monitoring.
The COVID-19 outbreak has adversely impacted the global microdisplays market. It has disrupted the production and supply chain of consumer electronics and manufacturing industries. Many R&D activities and new product launches are postponed due to the deadly coronavirus, hampering the growth of the global microdisplays market. However, the manufacturing sector will slowly return to a normal post-COVID-19 situation resulting in a gradual supply of devices.
Microdisplays Market Segmentation
Insight by Product
The global microdisplays market is divided by its product types into near-to-eye display devices (NTE), HUD, and other segments. Out of these, the NTE display devices segment will dominate the market during the forecast period due to the rise in demand for AR glasses in industrial sectors, inspection and maintenance activities, and field staff on-the-job training. It is also attributed to the growing use of VR headsets in gaming and entertainment applications. On the other hand, the HUD segment will also grow rapidly due to the significant benefits offered to the automotive industry.
Insight by Technology
The global microdisplays market is divided by different technologies into LCD, OLED, LCoS, and DLP segments. Out of these segments, the LCD segment is expected to grow and dominate during the forecast period due to the extensive use of Electronic Viewfinders (EVFs), HUDs, and HMDs. The OLED segment, on the other hand, is also expected to grow at a higher rate due to extensive use in TVs, smartphones, and other consumer appliances because of the small size, better resolution, low cost, high pixel density, and performance.
Insight by Resolution
The global microdisplays market is also divided by resolution into 1920×1080 and >1920×1080, 1024×768 and 1280×1024, 800×600, 800×480, and 854×480, <640×480 and 640×380, <640×480 and 640×380 segments. Out of these segments, the 1920×1080 and >1920×1080 are expected to grow at a higher CAGR due to good image quality.
Insight by Brightness
According to the brightness, the global microdisplays market is divided into less than 500 nits, 500 to 1,000 nits, and more than 1,000 nits. Among these segmentations, the less than 500-nits segment is expected to hold a larger market share due to the consumer preference for using low-resolution displays in consumer electronics, military & defense, and aerospace sectors. However, the more than 1000-nits segment will grow at the fastest rate due to the growing acceptance of AR/VR devices.
Insight by Industry
The global microdisplays market is also divided by industry verticals into consumer, industrial & enterprise, automotive, military, defense and aerospace, sports & entertainment, retail & hospitality, medical, education, and others. Out of all these segments, the consumer electronics segment will grow more due to higher demand for lightweight and compact VR glasses, higher adoption of HMD in entertainment and sports, and growing demand for displays with better image quality and wider viewing angles.
Global Microdisplays Market Report Coverage
|
Report Metric
|
Details
|
|
Historical Period
|
2020 - 2024
|
|
Base Year Considered
|
2025
|
|
Forecast Period
|
2026 - 2035
|
|
Market Size in 2025
|
U.S.D. 0.71 Billion
|
|
Revenue Forecast in 2035
|
U.S.D. 3.7 Billion
|
|
Growth Rate
|
38.2%
|
|
Segments Covered in the Report
|
By Product, By Technology, By Resolution, By Brightness and By Industry
|
|
Report Scope
|
Market Trends, Drivers, and Restraints; Revenue Estimation and Forecast; Segmentation Analysis; Companies’ Strategic Developments; Market Share Analysis of Key Players; Company Profiling
|
|
Regions Covered in the Report
|
North America, Europe, Asia-Pacific, Middle East, and Rest of the World
|
Industry Dynamics
Microdisplays Industry Trends
One of the most significant industry trends in the microdisplays market is the extensive use of OLED microdisplays in the automotive and consumer electronics industries. It is also noted that there is a higher adoption of specific devices based on AR and VR, wearable devices for different purposes such as sports, fitness, defense, and more. Another prevalent market trend is the growth of nanotechnology devices.
Microdisplays Market Growth Drivers
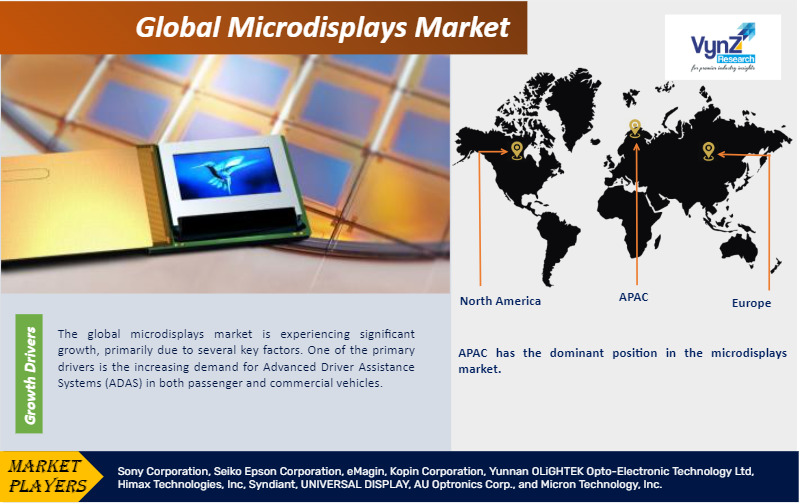
The growth of the global microdisplays market is influenced mainly by the higher demand for Advanced Driver Assistance Systems (ADAS) in both commercial and passenger vehicles and the widespread use of Near-To-Eye (NTE) device-based applications such as Head-Up Displays (HUD) and Augmented/Virtual Reality (AR/VR) devices. The continual evolution of technology and the size of the microdisplays also fuel market growth due to higher use across several industries and for diverse purposes such as healthcare, gaming, and other industrial applications. Another factor that contributes to the growth of the market is the growing demand for Organic Light-Emitting Diode (OLED) microdisplays in places needing high-quality visual displays due to higher efficiency, contrast ratio, wider viewing angles, and faster response time. There is also a growing need for using efficient holographic displays in the entertainment, design, and advertising sectors, pushing the demand for microdisplays further due to their improved imaging abilities and resolution, thereby pushing the market further forward.
Microdisplays Market Challenges
It is quite challenging for the manufacturers to maintain high resolution and wide viewing angle in a compact size which hinders production and growth of the global microdisplays market. In addition, the high manufacturing cost, reduced picture quality at high temperatures, growing R&D, and saturation of projectors and digital camera markets hinder the market growth.
Microdisplays Market Opportunities
The increase in demand for microdisplays in the healthcare sector in the form of CT scans, oxygen meters, ECG machines, and others offers new growth opportunities for the global microdisplays market. It is also attributed to the extensive use of these displays in autonomous vehicle systems, AR-based displays in the defense & military sector, and the development of next-gen micro-LED display technology.
Microdisplays Market Geographic Overview
The APAC region dominates the microdisplay market due to a large number of manufacturers, lower prices of products due to higher competition, greater penetration and adoption of microdisplay-based devices, the growing demand for ADAS in automobiles, and the expansion of the automotive industry.
North America will, however, continue growing rapidly due to the higher adoption of ICT technologies in the educational sector and the growing acceptance of these displays in aerospace, military, defense, and other sectors.
Microdisplays Market Competitive Insight
The global microdisplays market is highly competitive. Companies are focusing on product launches, mergers & acquisitions, collaborations with the government, and technological development through which market players are considerably contributing to the market growth and have a competitive edge in the market.
Seiko Epson Corporation commonly known as Epson, is a Japanese multinational electronics company and one of the world's largest manufacturers of printers and information- and imaging-related equipment.
Kopin Corporation, a leading provider of application-specific optical systems and high-performance micro-displays for defense, enterprise, consumer and medical products, and MICLEDI Microdisplays, a fabless semiconductor design and technology company developing microLED displays for Augmented Reality (AR), has announced a strategic agreement to work together to design, develop, and manufacture advanced microLED displays to provide a more immersive and information-rich AR experience for use in high-brightness light conditions.
Some of the key players operating in the microdisplays market are Sony Corporation, Seiko Epson Corporation, eMagin, Kopin Corporation, Yunnan OLiGHTEK Opto-Electronic Technology Ltd, Himax Technologies, Inc, Syndiant, UNIVERSAL DISPLAY, AU Optronics Corp., and Micron Technology, Inc.
Recent Developments by Key Players
Kopin Corporation (a developer of high-performance microdisplays) has secured a third production order for its Organic Light Emitting Diode (OLED) microdisplays, to be used in thermal imaging systems for the Indian Armed Forces. The order, consisting of over 1,200 units, is scheduled for delivery over the next six months.
Tohoku Epson Corporation, a Group company of Seiko Epson Corporation, will invest approximately 5.1-billion yen ($31.95 million) on the construction of a new factory for inkjet printheads. Epson's printing solutions business provides products and services based on original Micro Piezo inkjet technology to customers in the office, home, commercial and industrial markets.
The Microdisplays Market report offers a comprehensive market segmentation analysis along with an estimation for the forecast period 2025–2030.
Segments Covered in the Report
- By Product
- Near-to-Display Devices (NTE)
- HUD
- Others
- By Technology
- By Resolution
- 1920×1080 and >1920×1080,
- 1024×768 and 1280×1024
- 800×600, 800×480, and 854×480
- <640×480 and 640×380
- <640×480 and 640×380
- By Brightness
- Less than 500 Nits
- 500 to 1,000 Nits
- More Than 1,000 Nits
- By Industry
- Consumer
- Industrial & Enterprise
- Automotive
- Military, Defense, and Aerospace
- Sports & Entertainment
- Retail & Hospitality
- Medical
- Education
- Others
Region Covered in the Report
- North America
- Europe
- Germany
- U.K.
- France
- Italy
- Spain
- Russia
- Rest of Europe
- Asia-Pacific (APAC)
- China
- Japan
- India
- South Korea
- Rest of Asia-Pacific
- Rest of the World (RoW)
- Brazil
- Saudi Arabia
- South Africa
- U.A.E.
- Other Countries
.png "Microdisplays Market Size and Market Analysis")
