Global Commercial Space Payload Market – Analysis and Forecast (2026-2035)

Industry Insight By Product (Nano and Microsatellite, Small Satellite, Medium Satellite, and Large Satellite), By Orbit (GEO, MEO, and LEO), By Application (Communication, Earth Observation and Remote Sensing, Space Exploration, and Surveillance and Reconnaissance), and By Geography (North America, Europe, Asia-Pacific, Middle East, and Rest of the World)

About This Report Status : Published Published On : Aug, 2025 Report Code : VRAD12011 Industry : Aerospace and Defense Available Format : Page : 200

Industry Overview

Report Description

The Global Commercial Space Payload Market was valued at USD 24.1 billion in 2025 and is anticipated to reach USD 54.1 billion by 2035, witnessing a CAGR of 5.45% during the forecast period by 2035. Commercial space payloads are revenue-generating satellites or cargo that are launched into Earth's orbit by a space launch vehicle. Satellites are sophisticated radio-based instruments and communication systems that can be used for a variety of purposes, including Earth observation and remote sensing, communication, and satellite internet. The payload contains antennas, receivers, and transmitters for data transmission and storage, both in space and on the ground, to enable the delivery of satellite communication services.

Commercial Space Payload Market

Reveal each market segment's real performance. Access comprehensive data and strategic insights.
Download PDF

The commercial space payload industry makes money by launching satellites into Earth's orbit, primarily in Low Earth Orbit (LEO) and Geosynchronous Earth Orbit (GEO). Many governments and commercial organizations, including SpaceX, Ariane Space, the European Space Agency (ESA), the National Aeronautics and Space Administration (NASA), and the Japan Aerospace Exploration Agency (JAXA), began demonstrating the new propulsion system for various satellites in Low Earth Orbit between 1957 and 2021. (LEO). Since then, technology has progressed at a rapid speed, transforming the entire space industry through the development of novel goods and systems.

The pandemic has disrupted supply chains, causing satellite launches to be postponed. The market has also been harmed by a shortage of components as a result of laws governing the import and export of commodities. 

Commercial Space Payload Market Segmentation

Insight by Product

  • Nano and Microsatellite
  • Small Satellite
  • Medium Satellite
  • Large Satellite

The small satellite is anticipated to grow at a faster pace during the projected period owing to increased demand for small satellites in several industries like television & entertainment, aviation, military, and space research & development.

Insight by Orbit

  • GEO
  • MEO
  • LEO
  • Communication
  • Earth Observation and Remote Sensing
  • Space Exploration
  • Surveillance and Reconnaissance

The GEO segment is anticipated to be the fastest-growing segment during the projected period owing to increased demand for direct-to-home (D2h) broadcasting, internet, and regional mobile telecommunication services.

Insight by Application

Communication application is anticipated to have significant growth during the projected period owing to increased demand for remote sensing, Earth observation, and navigation, surveillance, and satellite internet. Moreover, the increased demand for navigation among consumers will drive the industry players to focus on the communication segment in the commercial space payload market.

Global Commercial Space Payload Market Report Coverage

Report Metric

Details

Historical Period

2020 - 2024

Base Year Considered

2025

Forecast Period

2026 - 2035

Market Size in 2025

U.S.D.  24.1 Billion

Revenue Forecast in 2035

U.S.D.  54.1 Billion

Growth Rate

5.45%

Segments Covered in the Report

By Product, By Orbit, and By Application

Report Scope

Market Trends, Drivers, and Restraints; Revenue Estimation and Forecast; Segmentation Analysis; Impact of COVID-19; Companies’ Strategic Developments; Market Share Analysis of Key Players; Company Profiling

Regions Covered in the Report

North America, Europe, Asia-Pacific, Middle East, and Rest of the World

Industry Dynamics

Industry Trends

The increased demand for Earth observation to deliver high-resolution imagery which is used in civil engineering & construction, transportation, agriculture & forestry industries, and increased investment by the defense sector to have high-speed communication services and navigation are the trends in the commercial space payload market.

Commercial Space Payload Market Growth Drivers

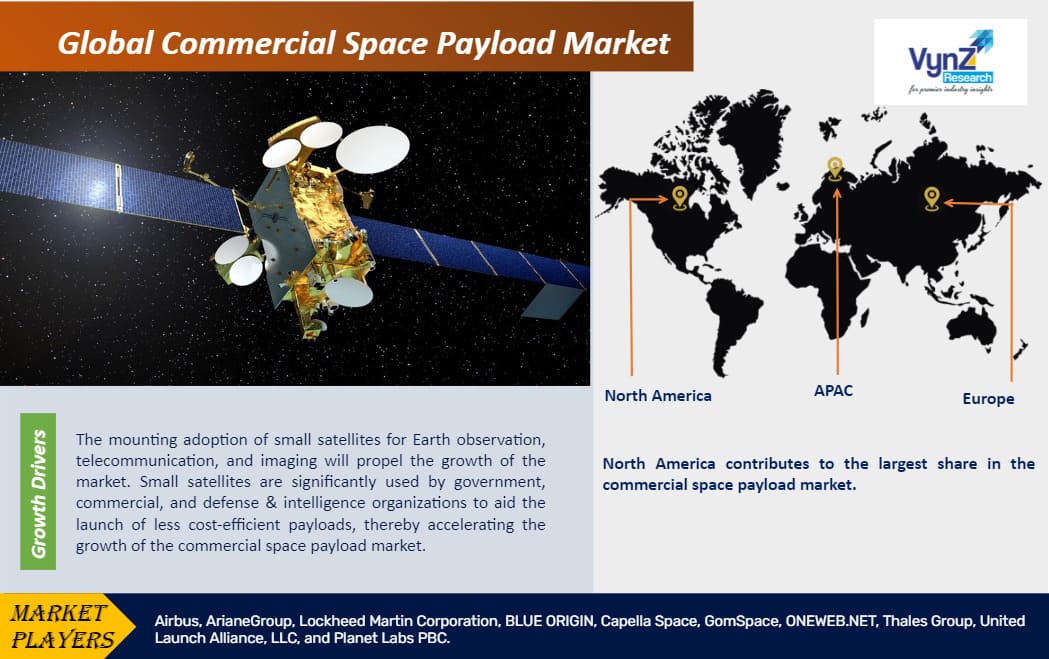
The mounting adoption of small satellites for Earth observation, telecommunication, and imaging will propel the growth of the market. Small satellites are significantly used by government, commercial, and defense & intelligence organizations to aid the launch of less cost-efficient payloads, thereby accelerating the growth of the commercial space payload market. Furthermore, technological development such as miniaturization of components, microelectronics, materials, and software, rising number of commercial satellite launches, growing deep space exploration missions, increased usage of software-defined satellites, and increasing trend of the hosted payload will accelerate the growth of the market.

Commercial Space Payload Market Challenges

The rising concerns about space debris as a result of more satellite payload launches, technical issues related to low-cost space technologies, as well as strict government rules associated with a satellite launch, are projected to impede market expansion.

Commercial Space Payload Market Opportunities

The growing investments by governments and research institutions globally, as well as increasing usage of satellite constellations for high-speed communication services, are likely to provide growth prospects during the projection period.

Commercial Space Payload Market Geographic Overview

  • North America
    • U.S.
    • Canada
    • Mexico
  • Europe
    • Germany
    • U.K.
    • France
    • Italy
    • Spain
    • Russia
    • Rest of Europe
  • Asia-Pacific (APAC)
    • China
    • Japan
    • India
    • South Korea
    • Vietnam
    • Thailand
    • Malaysia
    • Rest of Asia-Pacific
  • Rest of the World (RoW)
    • Brazil
    • Saudi Arabia
    • South Africa
    • U.A.E.
    • Other Countries

North America contributes to the largest share in the commercial space payload market owing to the rising investment in R&D that emphasizes military & defense and space exploration applications and the presence of established players like Raytheon Technologies, Lockheed Martin Corporation, and Honeywell International Inc. in the region. Also, the industry players are emphasizing adopting satellite connectivity technologies to enhance operations in the region.

Commercial Space Payload Market Competitive Insight

Some of the key players are :

There is increased commercialization of space and private funding from several organizations. With increased global competition and new entrants, the international arena is changing. Due to flexible techniques, quick development, and lower prices, large, medium-sized, and startup firms are investing in space technologies. Innovative applications, new operators, and new finance sources are all on the rise in the industry. Many startups are putting money into nanosatellite constellations in order to provide high-speed communication, navigation, and imaging services. This new ecosystem will offer highly efficient and cost-effective satellite control and monitoring software, specialized subsystems, solar panels, batteries, and rockets.

ArianeGroup designs and manufactures high-performance propulsion and equipment for satellites and other spacecraft, as well as payload equipment and instruments for commercial, institutional, and science satellites. ArianeGroup provides propulsion systems, equipment, and services for satellites of all sizes, from the largest geostationary platforms to the tiniest microsatellites, as well as other spacecraft, kick stages, service modules, landing modules. In addition to multi-payload dispensers for the launch of smallsats and constellations, their equipment includes composite structures, mechanics, star trackers, and more. They also provide a comprehensive range of launch support services, such as consultancy, testing, and propellant management.

For government and commercial customers, Lockheed Martin Corporation builds satellites and spacecraft that perform incredible feats in space. Satellites produced by Lockheed Martin provide early warning of severe weather, connect troops on the battlefield, and provide GPS directions to a billion people across the world. They'll also be driving technologies in the future to enable customers to achieve even more in space. That's why they're developing smarter satellites that work like smartphones in the sky, with software that can be updated in orbit and react to changing mission requirements on the ground.

Airbus has been contracted to provide more than fifteen satellite platforms derived from the Airbus Arrow platform and supply them to space start-up Loft Orbital. Arrow is the OneWeb constellation's primary satellite platform. There are 394 Airbus Arrow platforms in orbit for the OneWeb constellation, with another 254 on the way to complete the constellation's 648 spacecraft requirement. Loft Orbital confirms its intention to make the Airbus Arrow platform a true workhorse, enabling its service business model, with this acquisition.

ESA has chosen payloads that best fit the profile of the first mission of its new-generation Ariane 6 launch vehicle from Europe's Spaceport in French Guiana, in conjunction with ArianeGroup and Arianespace.

Orbital Reef, a commercially developed, owned, and operated space station to be built in low Earth orbit, was unveiled today by Blue Origin and Sierra Space. By supporting the emergence of a healthy ecosystem and economic model for the future, the station will usher in the next chapter of human space exploration and development.

Recent Developments by Key Players

Blue Origin has launched its 35th New Shepard suborbital mission. The Blue Origin capsule carried more than 40 scientific payloads on its suborbital flight, including 24 payloads from the NASA TechRise Student Challenge, which empowers teams of 6th-12th graders to design, build and launch experiments on NASA supported test flights.

GomSpace has signed a contract with Unseenlabs to deliver two additional cube satellites to extend the service capacity of the current generation in orbit.

The Commercial Space Payload Market report offers a comprehensive market segmentation analysis along with an estimation for the forecast period 2026–2035.


Commercial Space Payload Market Size and Market Analysis

Highlight opportunities using granular analytics insights. Make informed decisions with detailed market intelligence.
Download PDF


1.    Research Overview

        1.1.    The Report Offers
        1.2.    Market Coverage
                1.2.1.    By Product
                1.2.2.    By Orbit 
                1.2.3.    By Application             
                1.2.4.    By Region
        1.3.    Research Phases
        1.4.    Limitations
        1.5.    Market Methodology
                1.5.1.    Data Sources
                        1.5.1.1. Primary Research
                        1.5.1.2. Secondary Research

                1.5.2.    Methodology
                        1.5.2.1. Data Exploration
                        1.5.2.2. Forecast Parameters
                        1.5.2.3. Data Validation
                        1.5.2.4. Assumptions
                1.5.3.    Study Period & Data Reporting Unit

2.    Executive Summary

3.    Industry Overview

        3.1.    Industry Dynamics
                3.1.1.    Market Growth Drivers
                3.1.2.    Market Restraints
                3.1.3.    Key Market Trends
                3.1.4.    Major Opportunities

        3.2.    Industry Ecosystem
                3.2.1.    Porter’s Five Forces Analysis
                3.2.2.    Recent Development Analysis
                3.2.3.    Value Chain Analysis

        3.3.    Competitive Insight
                3.3.1.    Competitive Position of Industry Players
                3.3.2.    Market Attractive Analysis
                3.3.3.    Market Share Analysis

4.    Global Market Estimate and Forecast

        4.1.    Global Market Overview
        4.2.    Global Market Estimate and Forecast to 2030

5.    Market Segmentation Estimate and Forecast

        5.1.    By Product
                5.1.1.    Nano and Microsatellite
                        5.1.1.1. Market Definition
                        5.1.1.2. Market Estimation and Forecast to 2030  
                5.1.2.    Small Satellite
                        5.1.2.1. Market Definition
                        5.1.2.2. Market Estimation and Forecast to 2030
                5.1.3.    Medium Satellite
                        5.1.3.1. Market Definition
                        5.1.3.2. Market Estimation and Forecast to 2030  
                5.1.4.    Large Satellite
                        5.1.4.1. Market Definition
                        5.1.4.2. Market Estimation and Forecast to 2030
      
        5.2.    By Orbit
                5.2.1.    GEO
                        5.2.1.1. Market Definition
                        5.2.1.2. Market Estimation and Forecast to 2030
                5.2.2.    MEO
                        5.2.2.1. Market Definition
                        5.2.2.2. Market Estimation and Forecast to 2030
                5.2.3.    LEO
                        5.2.3.1. Market Definition
                        5.2.3.2. Market Estimation and Forecast to 2030
     
        5.3.    By Application  
                5.3.1.    Communication
                        5.3.1.1. Market Definition
                        5.3.1.2. Market Estimation and Forecast to 2030
                5.3.2.    Earth Observation and Remote Sensing
                        5.3.2.1. Market Definition
                        5.3.2.2. Market Estimation and Forecast to 2030
                5.3.3.    Space Exploration
                        5.3.3.1. Market Definition
                        5.3.3.2. Market Estimation and Forecast to 2030
                5.3.4.    Surveillance and Reconnaissance
                        5.3.4.1. Market Definition
                        5.3.4.2. Market Estimation and Forecast to 2030
             
        
6.    North America Market Estimate and Forecast

        6.1.    By Product
        6.2.    By Orbit 
        6.3.    By Application       
        6.4.    By Country – U.S., Canada, and Mexico
                6.4.1.    U.S. Market Estimate and Forecast
                6.4.2.    Canada Market Estimate and Forecast
                6.4.3.    Mexico Market Estimate and Forecast

7.    Europe Market Estimate and Forecast

        7.1.    By Product
        7.2.    By Orbit 
        7.3.    By Application        
        7.4.    By Country – Germany, U.K., France, Italy, Spain, Russia, and Rest of Europe
                7.4.1.    Germany Market Estimate and Forecast
                7.4.2.    France Market Estimate and Forecast
                7.4.3.    U.K. Market Estimate and Forecast
                7.4.4.    Italy Market Estimate and Forecast
                7.4.5.    Spain Market Estimate and Forecast
                7.4.6.    Rest of Europe Market Estimate and Forecast

8.    Asia-Pacific Market Estimate and Forecast

        8.1.    By Product
        8.2.    By Orbit 
        8.3.    By Application        
        8.4.    By Country – China, Japan, India, South Korea, and Rest of Asia-Pacific
                8.4.1.    China Market Estimate and Forecast
                8.4.2.    Japan Market Estimate and Forecast
                8.4.3.    India Market Estimate and Forecast
                8.4.4.    South Korea Market Estimate and Forecast
                8.4.5.    Singapore Market Estimate and Forecast
                8.4.6.    Rest of Asia-Pacific Market Estimate and Forecast

9.    Rest of the World (RoW) Market Estimate and Forecast

        9.1.    By Product
        9.2.    By Orbit 
        9.3.    By Application        
        9.4.    By Country – Brazil, Saudi Arabia, South Africa, U.A.E., and Other Countries
                9.4.1.    Brazil Market Estimate and Forecast
                9.4.2.    Saudi Arabia Market Estimate and Forecast
                9.4.3.    South Africa Market Estimate and Forecast
                9.4.4.    Other Countries Market Estimate and Forecast

10.    Company Profiles

        10.1.    Airbus
                10.1.1.    Snapshot
                10.1.2.    Overview
                10.1.3.    Offerings
                10.1.4.    Financial Insight
                10.1.5.    Recent Developments

        10.2.    ArianeGroup
                10.2.1.    Snapshot
                10.2.2.    Overview
                10.2.3.    Offerings
                10.2.4.    Financial Insight
                10.2.5.    Recent Developments

        10.3.    Lockheed Martin Corporation
                10.3.1.    Snapshot
                10.3.2.    Overview
                10.3.3.    Offerings
                10.3.4.    Financial Insight
                10.3.5.    Recent Developments

        10.4.    BLUE ORIGIN
                10.4.1.    Snapshot
                10.4.2.    Overview
                10.4.3.    Offerings
                10.4.4.    Financial Insight
                10.4.5.    Recent Developments

        10.5.    Capella Space
                10.5.1.    Snapshot
                10.5.2.    Overview
                10.5.3.    Offerings
                10.5.4.    Financial Insight
                10.5.5.    Recent Developments

        10.6.    GomSpace
                10.6.1.    Snapshot
                10.6.2.    Overview
                10.6.3.    Offerings
                10.6.4.    Financial Insight
                10.6.5.    Recent Developments

        10.7.    ONEWEB.NET
                10.7.1.    Snapshot
                10.7.2.    Overview
                10.7.3.    Offerings
                10.7.4.    Financial Insight
                10.7.5.    Recent Developments

        10.8.    Thales Group
                10.8.1.    Snapshot
                10.8.2.    Overview
                10.8.3.    Offerings
                10.8.4.    Financial Insight
                10.8.5.    Recent Developments

        10.9.    United Launch Alliance, LLC
                10.9.1.    Snapshot
                10.9.2.    Overview
                10.9.3.    Offerings
                10.9.4.    Financial Insight
                10.9.5.    Recent Developments

        10.10.   Planet Labs PBC
                10.10.1.   Snapshot
                10.10.2.   Overview
                10.10.3.   Offerings
                10.10.4.   Financial Insight
                10.10.5.   Recent Developments
       

11.    Appendix

        11.1.    Exchange Rates
        11.2.    Abbreviations

Note: Financial insight and recent developments of different companies are subject to the availability of information in the secondary domain.

List of Tables

Table 1 Sources
Table 2 Study Periods
Table 3 Data Reporting Unit
Table 4 Global Commercial Space Payload Market, By Product, 2018-2023 (USD Billion)
Table 5 Global Commercial Space Payload Market, By Product, 2025–2030 (USD Billion)
Table 6 Global Commercial Space Payload Market, By Orbit, 2018-2023 (USD Billion)
Table 7 Global Commercial Space Payload Market, By Orbit, 2025–2030 (USD Billion)
Table 8 Global Commercial Space Payload Market, By Application, 2018-2023 (USD Billion)
Table 9 Global Commercial Space Payload Market, By Application, 2025–2030 (USD Billion)
Table 10 Global Commercial Space Payload Market, By Region, 2018-2023 (USD Billion)
Table 11 Global Commercial Space Payload Market, By Region, 2025–2030 (USD Billion)
Table 12 North America Commercial Space Payload Market, By Product, 2018-2023 (USD Billion)
Table 13 North America Commercial Space Payload Market, By Product, 2025–2030 (USD Billion)
Table 14 North America Commercial Space Payload Market, By Orbit, 2018-2023 (USD Billion)
Table 15 North America Commercial Space Payload Market, By Orbit, 2025–2030 (USD Billion)
Table 16 North America Commercial Space Payload Market, By Application, 2018-2023 (USD Billion)
Table 17 North America Commercial Space Payload Market, By Application, 2025–2030 (USD Billion)
Table 18 North America Commercial Space Payload Market, By Region, 2018-2023 (USD Billion)
Table 19 North America Commercial Space Payload Market, By Region, 2025–2030 (USD Billion)
Table 20 Europe Commercial Space Payload Market, By Product, 2018-2023 (USD Billion)
Table 21 Europe Commercial Space Payload Market, By Product, 2025–2030 (USD Billion)
Table 22 Europe Commercial Space Payload Market, By Orbit, 2018-2023 (USD Billion)
Table 23 Europe Commercial Space Payload Market, By Orbit, 2025–2030 (USD Billion)
Table 24 Europe Commercial Space Payload Market, By Application, 2018-2023 (USD Billion)
Table 25 Europe Commercial Space Payload Market, By Application, 2025–2030 (USD Billion)
Table 26 Europe Commercial Space Payload Market, By Region, 2018-2023 (USD Billion)
Table 27 Europe Commercial Space Payload Market, By Region, 2025–2030 (USD Billion)
Table 28 Asia-Pacific Commercial Space Payload Market, By Product, 2018-2023 (USD Billion)
Table 29 Asia-Pacific Commercial Space Payload Market, By Product, 2025–2030 (USD Billion)
Table 30 Asia-Pacific Commercial Space Payload Market, By Orbit, 2018-2023 (USD Billion)
Table 31 Asia-Pacific Commercial Space Payload Market, By Orbit, 2025–2030 (USD Billion)
Table 32 Asia-Pacific Commercial Space Payload Market, By Application, 2018-2023 (USD Billion)
Table 33 Asia-Pacific Commercial Space Payload Market, By Application, 2025–2030 (USD Billion)
Table 34 Asia-Pacific Commercial Space Payload Market, By Region, 2018-2023 (USD Billion)
Table 35 Asia-Pacific Commercial Space Payload Market, By Region, 2025–2030 (USD Billion)
Table 36 RoW Commercial Space Payload Market, By Product, 2018-2023 (USD Billion)
Table 37 RoW Commercial Space Payload Market, By Product, 2025–2030 (USD Billion)
Table 38 RoW Commercial Space Payload Market, By Orbit, 2018-2023 (USD Billion)
Table 39 RoW Commercial Space Payload Market, By Orbit, 2025–2030 (USD Billion)
Table 40 RoW Commercial Space Payload Market, By Application, 2018-2023 (USD Billion)
Table 41 RoW Commercial Space Payload Market, By Application, 2025–2030 (USD Billion)
Table 42 RoW Commercial Space Payload Market, By Region, 2018-2023 (USD Billion)
Table 43 RoW Commercial Space Payload Market, By Region, 2025–2030 (USD Billion)
Table 44 Snapshot – Zeus Industrial Products, Inc.
Table 45 Snapshot – Saint-Gobain
Table 46 Snapshot – Freudenberg Medical
Table 47 Snapshot – Avient Corporation
Table 48 Snapshot – RAUMEDIC AG
Table 49 Snapshot – The Lubrizol Corporation
Table 50 Snapshot – Elkem ASA
Table 51 Snapshot – Nordson Corporation
Table 52 Snapshot – Optinova
Table 53 Snapshot – Teknor Apex

List of Figures

Figure 1 Market Coverage
Figure 2 Research Phases
Figure 3 Secondary Sources for Different Parameters
Figure 4 Methodology
Figure 5 Data Mining & Exploration
Figure 6 Data Triangulation
Figure 7 Assumptions for Market Estimation and Forecast
Figure 8 Market Synopsis
Figure 9 Global Commercial Space Payload Market- Growth Drivers and Restraints
Figure 10 Competitive Benchmark
Figure 11 Global Commercial Space Payload Market Highlight

Figure 12 Global Commercial Space Payload Market, By Product, 2018-2030 (USD Billion)
Figure 13 Global Commercial Space Payload Market, By Orbit, 2018-2030 (USD Billion)
Figure 14 Global Commercial Space Payload Market, By Application, 2018-2030 (USD Billion)
Figure 15 Global Commercial Space Payload Market, By Region, 2018-2030 (USD Billion)
Figure 16 North America Commercial Space Payload Market Highlight
Figure 17 North America Commercial Space Payload Market, By Product, 2018-2030 (USD Billion)
Figure 18 North America Commercial Space Payload Market, By Orbit, 2018-2030 (USD Billion)
Figure 19 North America Commercial Space Payload Market, By Application, 2018-2030 (USD Billion)
Figure 2 North America Commercial Space Payload Market, By Region, 2018-2030 (USD Billion)
Figure 21 Europe Commercial Space Payload Market Highlight
Figure 22 Europe Commercial Space Payload Market, By Product, 2018-2030 (USD Billion)
Figure 23 Europe Commercial Space Payload Market, By Orbit, 2018-2030 (USD Billion)
Figure 24 Europe Commercial Space Payload Market, By Application, 2018-2030 (USD Billion)
Figure 25 Europe Commercial Space Payload Market, By Region, 2018-2030 (USD Billion)
Figure 26 Asia-Pacific Commercial Space Payload Market Highlight
Figure 27 Asia-Pacific Commercial Space Payload Market, By Product, 2018-2030 (USD Billion)
Figure 28 Asia-Pacific Commercial Space Payload Market, By Orbit, 2018-2030 (USD Billion)
Figure 29 Asia-Pacific Commercial Space Payload Market, By Application, 2018-2030 (USD Billion)
Figure 30 Asia-Pacific Commercial Space Payload Market, By Region, 2018-2030 (USD Billion)
Figure 31 RoW Commercial Space Payload Market Highlight
Figure 32 RoW Commercial Space Payload Market, By Product, 2018-2030 (USD Billion)
Figure 33 RoW Commercial Space Payload Market, By Orbit, 2018-2030 (USD Billion)
Figure 34 RoW Commercial Space Payload Market, By Application, 2018-2030 (USD Billion)
Figure 35 RoW Commercial Space Payload Market, By Region, 2018-2030 (USD Billion)

Global Commercial Space Payload Market Coverage

Product Insight and Forecast 2025-2030

  • Nano and Microsatellite
  • Small Satellite
  • Medium Satellite
  • Large Satellite

Orbit Insight and Forecast 2025-2030

  • GEO
  • MEO
  • LEO

Application Insight and Forecast 2025-2030

  • Communication
  • Earth Observation and Remote Sensing
  • Space Exploration
  • Surveillance and Reconnaissance

Geographical Segmentation

Commercial Space Payload Market by Region

North America

  • By Product
  • By Orbit
  • By Application
  • By Country – U.S., Canada, and Mexico

Europe

  • By Product
  • By Orbit
  • By Application
  • By Country – Germany, U.K., France, Italy, Spain, Russia, and Rest of Europe

Asia-Pacific (APAC)

  • By Product
  • By Orbit
  • By Application
  • By Country – China, Japan, India, South Korea, and Rest of Asia-Pacific

Rest of the World (RoW)

  • By Product
  • By Orbit
  • By Application
  • By Country – Brazil, Saudi Arabia, South Africa, U.A.E., and Other Countries

Purchase Options

Research Methodology

  •  Desk Research / Pilot Interviews
  •  Build Market Size Model
  •  Research and Analysis
  •  Final Deliverabvle

Connect With Our Sales Team

Key Takeaways