
North America Electric Bus Charging Market Size & Share Growth Forecast Report (2026-2035)
Industry Insight by Charger (Depot Charging, Opportunity Charging, Others), by Type (Plug In Charging, Pantograph Charging, Inductive Charging), by Power (Less than 150 kW, 150 kW to 450 kW, Above 450 kW), by End User (Public Transit Agencies, Private Fleet Operators, Airport Shuttle Services, University and Campus Transportation, Others), by Region (United States, Canada, California, New York)
| Status : Published | Published On : Jul, 2026 | Report Code : VRAT9674 | Industry : Automotive & Transportation | Available Format :

|
Page : 145 |
North America Electric Bus Charging Market Overview
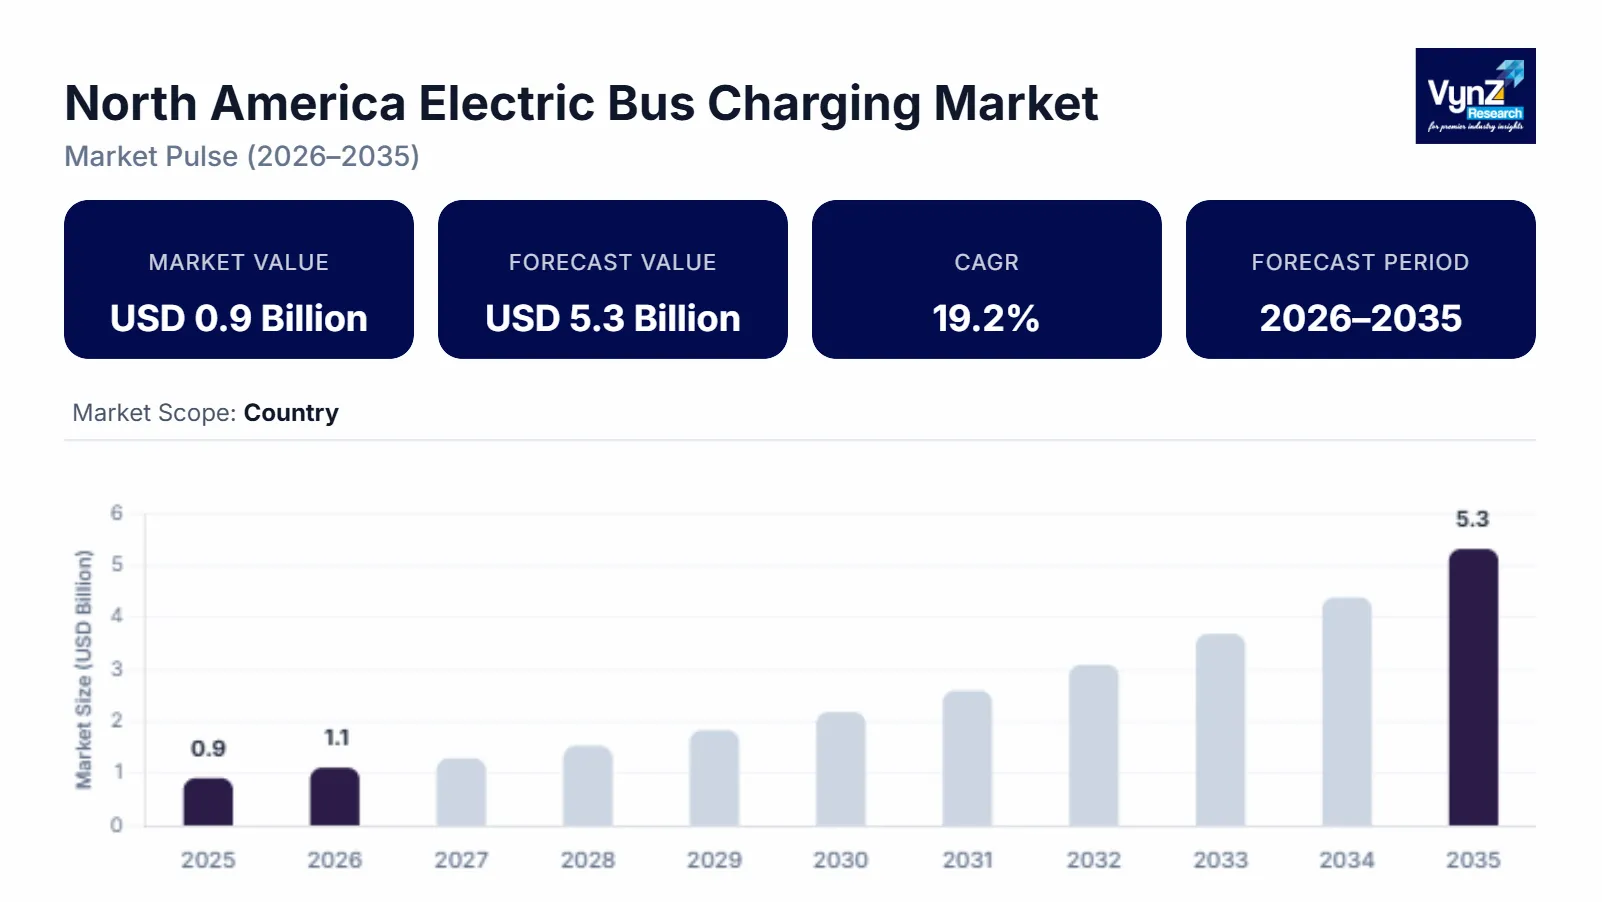
The North America electric bus charging market size was estimated at about USD 0.9 billion in 2025 and is expected to reach around USD 1.1 billion in 2026, rising to roughly USD 5.3 billion by 2035, growing at approximately 19.2% CAGR from 2026 to 2035.
Research Highlights
- Depot Charging held approximately 62.4% market share in 2025 due to expanding depot-based fleet electrification.
- Plug In Charging accounted for approximately 54.8% of the market in 2025 supported by cost effective infrastructure deployment.
- The 150 kW to 450 kW segment captured approximately 49.6% revenue share in 2025 owing to balanced charging performance and operational efficiency.
- Pantograph charging will grow at 20.4% CAGR through 2035 because of increasing deployment.
- The United States contributed approximately 46.8% of the market in 2025 supported by strong federal funding and charging infrastructure expansion.
Market growth is influenced by expanding electric bus fleet deployment, increasing investment in charging infrastructure and supportive government funding programs along with rising adoption of high-power depot and opportunity charging solutions. Growing demand for zero emission public transportation and continued investments under the U.S. Federal Transit Administration (FTA) Low or No Emission Grant Program, the Joint Office of Energy and Transportation, and Natural Resources Canada (NRCan) are further supporting market expansion across major regions including California, New York, and Quebec. According to the U.S. Department of Energy (DOE), expanding charging infrastructure remains essential for accelerating commercial electric vehicle adoption, while the U.S. Environmental Protection Agency (EPA) continues to support cleaner transit through initiatives aimed at reducing greenhouse gas emissions from the transportation sector.
North America Electric Bus Charging Market Dynamics
Market Trends
The industry is witnessing notable shifts in charging technology, fleet electrification strategies, and public transit modernization. One of the key trends is the growing deployment of high-power DC fast charging and smart charging systems, reflecting increasing preference for operational efficiency, grid optimization and reduced vehicle downtime. The U.S. Department of Energy (DOE) continues to support research and infrastructure development for commercial electric vehicle charging, while the Joint Office of Energy and Transportation promote interoperable and reliable charging networks across the region. Another emerging trend is the integration of intelligent energy management and renewable energy with charging infrastructure, driven by supportive regulations and digital advancements. These developments are encouraging companies to focus on automated charging management, energy storage integration, and scalable charging platforms.
Growth Drivers
The growth of the market is largely supported by increasing investments in zero emission public transportation, which continue to generate strong demand across municipal transit agencies and commercial fleet operators. Expanding funding for charging infrastructure and electric bus deployment is further accelerating market growth. The Federal Transit Administration (FTA) has significantly increased funding through its Low or No Emission Grant Program, while the U.S. Department of Transportation (USDOT) continues to promote sustainable transportation infrastructure. Stricter emission reduction policies are playing a crucial role in boosting market adoption and as transit authorities prioritize operational efficiency and environmental compliance, demand for advanced charging infrastructure is expected to remain strong throughout the forecast period.
Market Restraints / Challenges
Despite favorable growth prospects, the market faces certain challenges that may limit expansion. High installation costs and grid infrastructure limitations continue to affect project implementation, particularly among smaller transit operators with constrained budgets. The U.S. Department of Energy (DOE) has highlighted the need for significant grid upgrades to support widespread commercial electric vehicle charging infrastructure. Furthermore, lengthy permitting processes and dependence on utility upgrades pose operational challenges for charging infrastructure developers. Reliance on specialized electrical equipment and utility coordination can result in project delays and increased deployment costs.
Market Opportunities
The market presents significant opportunities in intelligent charging infrastructure, particularly due to rapid technological advancements and expanding public transit electrification programs. Companies offering scalable, energy efficient and software enabled charging solutions are well positioned to address increasing demand from transit agencies and fleet operators. The Joint Office of Energy and Transportation continue to support nationwide charging deployment through technical assistance and infrastructure planning initiatives. Another key opportunity lies in vehicle to grid integration and renewable energy powered charging systems, where rising investments in smart energy solutions are creating long term growth potential. Advancements in digital energy management, predictive maintenance, and automated charging platforms are expected to improve operational efficiency and customer value.
North America Electric Bus Charging Market Report Coverage
|
Report Metric |
Details |
|
Historical Period |
2020 - 2024 |
|
Base Year Considered |
2025 |
|
Forecast Period |
2026 - 2035 |
|
Market Size in 2025 |
USD 0.9 Billion |
|
Revenue Forecast in 2035 |
USD 5.3 Billion |
|
Growth Rate |
19.2% |
|
Segments Covered in the Report |
By Charger, By Type, By Power |
|
Report Scope |
Market Trends, Drivers, and Restraints; Revenue Estimation and Forecast; Segmentation Analysis; Companies’ Strategic Developments; Market Share Analysis of Key Players; Company Profiling |
|
Regions Covered in the Report |
United States, Canada, California, New York |
|
Key Companies |
ChargePoint Inc., Daimler, Eaton, EVBox, GreenPower Motor Company Inc., Schneider Electric, Scania AB, Siemens AG, Tesla, Volvo, Webasto Group |
|
Customization |
Available upon request |
North America Electric Bus Charging Market Segmentation
By Charger
Depot charging accounted for the largest market share of approximately 62.4% in 2025 and is projected to expand at an estimated 18.8% CAGR through 2035 supported by large scale fleet operations, overnight charging efficiency and lower operational costs for transit agencies. Growing procurement of battery electric buses and expanding depot electrification projects continue to strengthen demand.
Opportunity charging is expected to register the fastest growth, advancing at an estimated 20.1% CAGR during the forecast period. Rising adoption is supported by increasing deployment of high frequency urban transit routes where rapid charging improves fleet utilization and minimizes battery size requirements. Continued investments in high power charging corridors and advanced charging technologies are further supporting adoption.
By Type
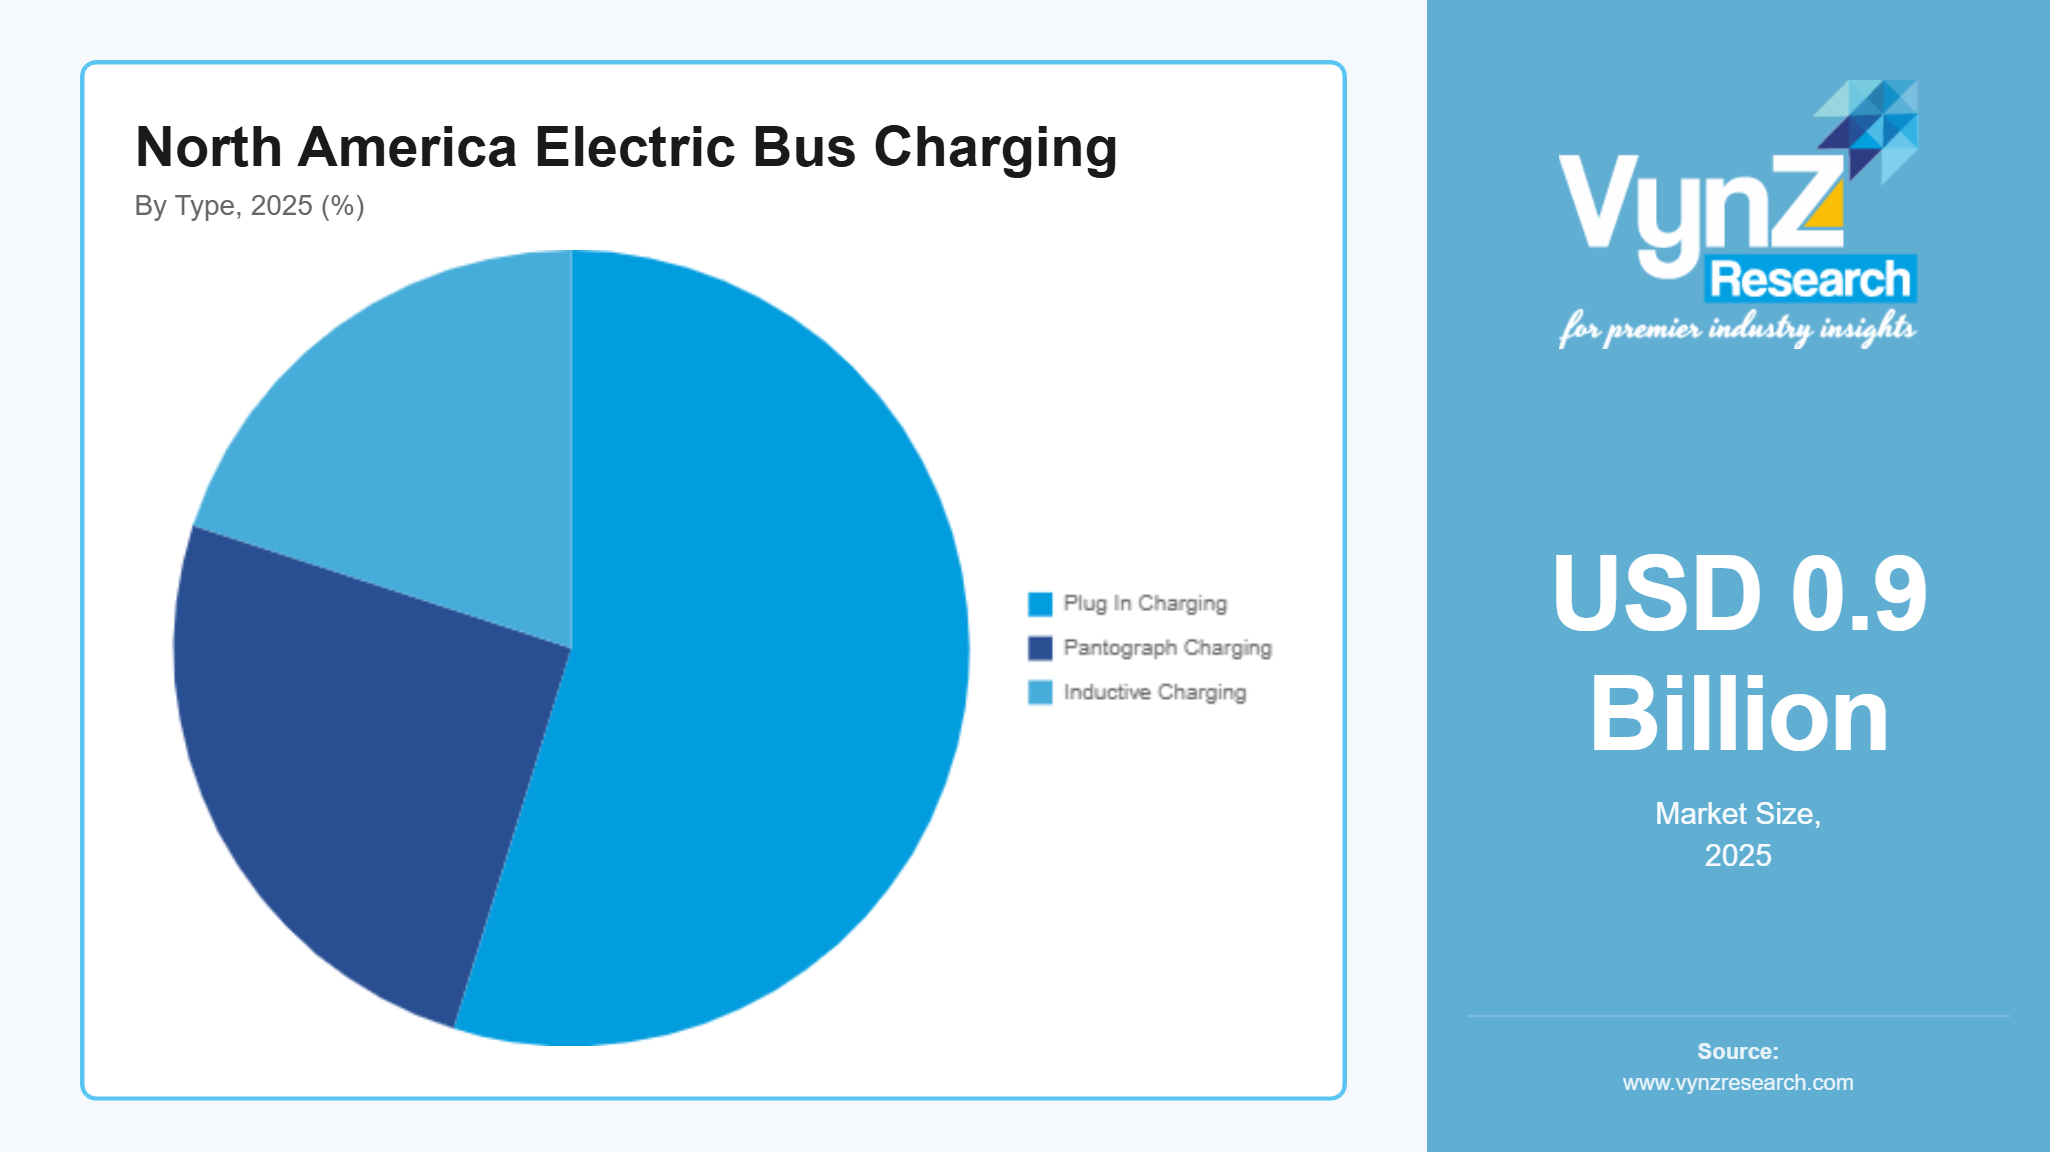
Plug in charging held the dominant share of approximately 54.8% in 2025 and is anticipated to grow at nearly 18.5% CAGR through the forecast period due to lower installation costs, compatibility with existing electric bus fleets, and relatively simple infrastructure requirements. Transit agencies continue to prioritize plug in charging for depot applications as part of fleet electrification programs.
Pantograph charging is expected to witness the fastest expansion, recording an estimated 20.4% CAGR through 2035 because of increasing deployment across high frequency urban bus networks, the need for reduced charging time and improved operational efficiency. Technological improvements in automated charging systems are further strengthening the segment's outlook.
By Power
The 150 kW to 450 kW category accounted for the largest market share of approximately 49.6% in 2025 and is expected to grow at an estimated 19.0% CAGR through 2035 due to its ability to balance charging speed, infrastructure investment and operational flexibility and increasing deployment of medium and high-capacity charging stations.
The Above 450 kW category is projected to register the fastest growth, expanding at an estimated 20.6% CAGR during the forecast period for higher deployment of ultra-fast charging systems for high utilization transit routes and next generation electric buses continue to drive investment in this segment. Utilities and transit operators are increasingly upgrading grid infrastructure to support higher charging capacities.
Regional Insights
United States
The United States accounted for approximately 46% of the market in 2025 supported by large scale electric bus deployment, increasing investments in charging infrastructure and strong federal funding. Transit agencies across major metropolitan areas continue to accelerate fleet electrification to meet emission reduction targets. Government incentives combined with rising demand for zero emission public transportation, are encouraging investments in high power charging solutions, smart charging platforms, and depot electrification projects.
Canada
The Canada market accounted for approximately 16% of regional revenue in 2025 supported by increasing investments in sustainable public transportation, provincial electrification strategies and growing adoption of battery electric buses across urban transit networks.
California
California represented approximately 11% of the regional market in 2025 due to aggressive zero emission transit policies, large scale electric bus procurement and continuous investment in charging infrastructure across municipal transit agencies. The California Air Resources Board (CARB) continues to implement the Innovative Clean Transit Regulation, supporting the transition toward fully zero emission public bus fleets, while the California Energy Commission (CEC) funds charging infrastructure and grid readiness initiatives.
New York
New York accounted for approximately 7% of the regional market in 2025 because of increasing electrification of public transportation systems, state level clean energy policies and modernization of urban transit infrastructure. The New York State Energy Research and Development Authority (NYSERDA) continues to promote clean transportation investments, while the Metropolitan Transportation Authority (MTA) is expanding electric bus deployment and supporting charging infrastructure development across its transit network.
The remaining 20% was contributed by other regions across North America that are also experiencing gradual investment in electric bus charging infrastructure and fleet electrification.
Competitive Landscape / Company Insights
The market is moderately to highly competitive, with global and regional companies focusing on charging technology innovation, software integration, strategic partnerships and network expansion to strengthen their market presence. Market participants continue to invest in high power charging systems, smart energy management platforms and interoperable charging solutions to address evolving transit requirements. The U.S. Department of Energy (DOE) and the Joint Office of Energy and Transportation continue to support the development of reliable, standardized, and scalable charging infrastructure, encouraging continuous technological advancement across the industry.
Mini Profiles
ChargePoint Inc. develops electric vehicle charging hardware, network management software, and fleet charging solutions, supported by an extensive charging network, advanced digital capabilities, and strong partnerships with commercial and public transportation operators.
Daimler focuses on electric commercial vehicles and integrated charging ecosystem solutions, supported by extensive manufacturing expertise, established fleet relationships, and continuous investment in sustainable mobility technologies.
Eaton provides power distribution, electrical infrastructure, and smart charging solutions, leveraging advanced energy management technologies, broad industrial expertise, and a strong presence across commercial electrification projects.
Schneider Electric specializes in energy management, smart charging infrastructure, and grid integration solutions, supported by global distribution capabilities, digital innovation, and expertise in sustainable electrical infrastructure.
Volvo develops battery electric buses and integrated charging technologies, emphasizing operational efficiency, fleet electrification, and long term investment in zero emission public transportation solutions.
Key Players
- ChargePoint Inc.
- Daimler
- Eaton
- EVBox
- GreenPower
- Motor Company Inc.
- Schneider Electric
- Scania AB
- Siemens AG
- Tesla
- Volvo
- Webasto Group
Recent Developments
In January 2026, Tesla expanded deployment of its next generation V4 Supercharger infrastructure with higher power capabilities designed to support commercial and heavy-duty electric vehicles. The development strengthens North America's high power charging network and improves compatibility for future electric bus and fleet applications.
In May 2025, EVBox introduced an enhanced AC and DC charging portfolio featuring improved remote monitoring and energy management capabilities for commercial fleet operators. The upgraded solutions are designed to improve charger reliability and support the growing electrification of public and commercial transport fleets.
In June 2025, Siemens AG expanded its North American eMobility portfolio by introducing advanced charging infrastructure and digital energy management solutions for commercial fleets. The initiative supports scalable charging deployment while improving grid integration and operational efficiency for fleet operators.
In March 2026, Scania AB strengthened its electrification strategy by expanding battery electric commercial vehicle solutions and supporting high-capacity charging infrastructure for heavy duty transport. The company continues collaborating with infrastructure partners to accelerate zero emission fleet operations across key markets.
In February 2026, Webasto Group expanded its commercial charging portfolio with new high power charging solutions designed for electric buses and commercial vehicle fleets. The development enhances charging flexibility while supporting faster deployment of fleet electrification projects across North America and Europe.
By Charger
- Depot Charging
- Opportunity Charging
- Others
By Type
- Plug In Charging
- Pantograph Charging
- Inductive Charging
By Power
- Less than 150 kW
- 150 kW to 450 kW
- Above 450 kW
By End User
- Public Transit Agencies
- Private Fleet Operators
- Airport Shuttle Services
- University and Campus Transportation
- Others
North America Electric Bus Charging Market Coverage
Charger Insight and Forecast 2026 - 2035
- Depot Charging
- Opportunity Charging
- Others
Type Insight and Forecast 2026 - 2035
- Plug In Charging
- Pantograph Charging
- Inductive Charging
Power Insight and Forecast 2026 - 2035
- Less than 150 kW
- 150 kW to 450 kW
- Above 450 kW
End User Insight and Forecast 2026 - 2035
- Public Transit Agencies
- Private Fleet Operators
- Airport Shuttle Services
- University and Campus Transportation
- Others
Region Insight and Forecast 2026 - 2035
- United States
- Canada
- California
- New York
North America Electric Bus Charging Market by Region
- U.S.
- By Charger
- By Type
- By Power
- By End User
- By Region
- Canada
- By Charger
- By Type
- By Power
- By End User
- By Region
- Mexico
- By Charger
- By Type
- By Power
- By End User
- By Region
Table of Contents for North America Electric Bus Charging Market Report
1. Research Overview
1.1. The Report Offers
1.2. Market Coverage
1.2.1. By
Charger
1.2.2. By
Type
1.2.3. By
Power
1.2.4. By
End User
1.2.5. By
Region
1.3. Research Phases
1.4. Limitations
1.5. Market Methodology
1.5.1. Data Sources
1.5.1.1.
Primary Research
1.5.1.2.
Secondary Research
1.5.2. Methodology
1.5.2.1.
Data Exploration
1.5.2.2.
Forecast Parameters
1.5.2.3.
Data Validation
1.5.2.4.
Assumptions
1.5.3. Study Period & Data Reporting Unit
2. Executive Summary
3. Industry Overview
3.1. Industry Dynamics
3.1.1. Market Growth Drivers
3.1.2. Market Restraints
3.1.3. Key Market Trends
3.1.4. Major Opportunities
3.2. Industry Ecosystem
3.2.1. Porter’s Five Forces Analysis
3.2.2. Recent Development Analysis
3.2.3. Value Chain Analysis
3.3. Competitive Insight
3.3.1. Competitive Position of Industry
Players
3.3.2. Market Attractive Analysis
3.3.3. Market Share Analysis
4. North Market Estimate and Forecast
4.1. North Market Overview
4.2. North Market Estimate and Forecast to 2035
5. Market Segmentation Estimate and Forecast
5.1. By Charger
5.1.1. Depot Charging
5.1.1.1. Market Definition
5.1.1.2. Market Estimation and Forecast to 2035
5.1.2. Opportunity Charging
5.1.2.1. Market Definition
5.1.2.2. Market Estimation and Forecast to 2035
5.1.3. Others
5.1.3.1. Market Definition
5.1.3.2. Market Estimation and Forecast to 2035
5.2. By Type
5.2.1. Plug In Charging
5.2.1.1. Market Definition
5.2.1.2. Market Estimation and Forecast to 2035
5.2.2. Pantograph Charging
5.2.2.1. Market Definition
5.2.2.2. Market Estimation and Forecast to 2035
5.2.3. Inductive Charging
5.2.3.1. Market Definition
5.2.3.2. Market Estimation and Forecast to 2035
5.3. By Power
5.3.1. Less than 150 kW
5.3.1.1. Market Definition
5.3.1.2. Market Estimation and Forecast to 2035
5.3.2. 150 kW to 450 kW
5.3.2.1. Market Definition
5.3.2.2. Market Estimation and Forecast to 2035
5.3.3. Above 450 kW
5.3.3.1. Market Definition
5.3.3.2. Market Estimation and Forecast to 2035
5.4. By End User
5.4.1. Public Transit Agencies
5.4.1.1. Market Definition
5.4.1.2. Market Estimation and Forecast to 2035
5.4.2. Private Fleet Operators
5.4.2.1. Market Definition
5.4.2.2. Market Estimation and Forecast to 2035
5.4.3. Airport Shuttle Services
5.4.3.1. Market Definition
5.4.3.2. Market Estimation and Forecast to 2035
5.4.4. University and Campus Transportation
5.4.4.1. Market Definition
5.4.4.2. Market Estimation and Forecast to 2035
5.4.5. Others
5.4.5.1. Market Definition
5.4.5.2. Market Estimation and Forecast to 2035
5.5. By Region
5.5.1. United States
5.5.1.1. Market Definition
5.5.1.2. Market Estimation and Forecast to 2035
5.5.2. Canada
5.5.2.1. Market Definition
5.5.2.2. Market Estimation and Forecast to 2035
5.5.3. California
5.5.3.1. Market Definition
5.5.3.2. Market Estimation and Forecast to 2035
5.5.4. New York
5.5.4.1. Market Definition
5.5.4.2. Market Estimation and Forecast to 2035
6. U.S. Market Estimate and Forecast
6.1. By
Charger
6.2. By
Type
6.3. By
Power
6.4. By
End User
6.5. By
Region
7. Canada Market Estimate and Forecast
7.1. By
Charger
7.2. By
Type
7.3. By
Power
7.4. By
End User
7.5. By
Region
8. Mexico Market Estimate and Forecast
8.1. By
Charger
8.2. By
Type
8.3. By
Power
8.4. By
End User
8.5. By
Region
9. Company Profiles
9.1.
ChargePoint Inc.
9.1.1.
Snapshot
9.1.2.
Overview
9.1.3.
Offerings
9.1.4.
Financial
Insight
9.1.5.
Recent
Developments
9.2.
Daimler
9.2.1.
Snapshot
9.2.2.
Overview
9.2.3.
Offerings
9.2.4.
Financial
Insight
9.2.5.
Recent
Developments
9.3.
Eaton
9.3.1.
Snapshot
9.3.2.
Overview
9.3.3.
Offerings
9.3.4.
Financial
Insight
9.3.5.
Recent
Developments
9.4.
EVBox
9.4.1.
Snapshot
9.4.2.
Overview
9.4.3.
Offerings
9.4.4.
Financial
Insight
9.4.5.
Recent
Developments
9.5.
GreenPower Motor Company Inc.
9.5.1.
Snapshot
9.5.2.
Overview
9.5.3.
Offerings
9.5.4.
Financial
Insight
9.5.5.
Recent
Developments
9.6.
Schneider Electric
9.6.1.
Snapshot
9.6.2.
Overview
9.6.3.
Offerings
9.6.4.
Financial
Insight
9.6.5.
Recent
Developments
9.7.
Scania AB
9.7.1.
Snapshot
9.7.2.
Overview
9.7.3.
Offerings
9.7.4.
Financial
Insight
9.7.5.
Recent
Developments
9.8.
Siemens AG
9.8.1.
Snapshot
9.8.2.
Overview
9.8.3.
Offerings
9.8.4.
Financial
Insight
9.8.5.
Recent
Developments
9.9.
Tesla
9.9.1.
Snapshot
9.9.2.
Overview
9.9.3.
Offerings
9.9.4.
Financial
Insight
9.9.5.
Recent
Developments
9.10.
Volvo
9.10.1.
Snapshot
9.10.2.
Overview
9.10.3.
Offerings
9.10.4.
Financial
Insight
9.10.5.
Recent
Developments
9.11.
Webasto Group
9.11.1.
Snapshot
9.11.2.
Overview
9.11.3.
Offerings
9.11.4.
Financial
Insight
9.11.5.
Recent
Developments
10. Appendix
10.1. Exchange Rates
10.2. Abbreviations
Note: Financial insight and recent developments of different companies are subject to the availability of information in the secondary domain.
Frequently Asked Questions
Purchase Options
Latest Report
Research Methodology
- Desk Research / Pilot Interviews
- Build Market Size Model
- Research and Analysis
- Final Deliverable
Connect With Our Sales Team
- Toll-Free: +1-888-253-3960
- Phone: +91 9960 288 381
- Email: enquiry@vynzresearch.com
North America Electric Bus Charging Market