Status : Published | Published On : Aug, 2025 | Report Code : VRCH2009 | Industry : Chemicals & Materials | Available Format :
![]() |
Page : 240 |
The global Flocculants and Coagulants Market was valued at $4.8 billion in 2025 and is expected to grow by $7.8 billion by 2035. The flocculants and coagulants market is further anticipated to grow with a CAGR of 5.3% during the forecast period in terms of value. The growth of this market is attributed to its extensive utilization of every process of water treatment as it helps in diminishing the operating costs along with eradicating the particulate compositions present in contaminated water. Flocculation and coagulation aim at removing substances from the water with the help of a chemical cleaning action and are generally undertaken at the time of the sedimentation process.
Moreover, it has been observed that increasing preference towards organic coagulants as compared to that over traditional coagulant that includes polyacrylamides and alum is further driving the growth of the global flocculants and coagulants market. Moreover, increasing industrialization has further stimulated the need for treating water resources that are ultimately bolstering the growth of the global flocculants and coagulants market.
On the basis of type, the global flocculants and coagulants market is segmented into flocculants and coagulants. Flocculants are further subcategorized as anionic, cationic, non-ionic, and amphoteric. Coagulants are further sub-categorized into organic and inorganic. Organic are further sub-categorized as polyamine and polyDADMAC. Inorganic are further sub-categorized as aluminum sulfate, poly aluminum chloride, ferric chloride, and others. Among all these segments, flocculants are projected to hold larger revenue in the global flocculants and coagulants market. This segment is observing rampant growth owing to its widespread application in several industries.
On the basis of application, the global flocculants and coagulants market is segmented into pulp & paper, oil & gas, water and wastewater treatment, mining, textile, and others. Among all these segments, the water and wastewater treatment application are anticipated to witness the fastest growth of 5.7% during the forecast period in terms of value.
Report Metric |
Details |
Historical Period |
2020 - 2024 |
Base Year Considered |
2025 |
Forecast Period |
2026 - 2035 |
Market Size in 2025 |
U.S.D. 4.8 Billion |
Revenue Forecast in 2035 |
U.S.D. 7.8 Billion |
Growth Rate |
5.3% |
Segments Covered in the Report |
By Type, and Type Application |
Report Scope |
Market Trends, Drivers, and Restraints; Revenue Estimation and Forecast; Segmentation Analysis; Impact of COVID-19; Companies’ Strategic Developments; Market Share Analysis of Key Players; Company Profiling |
Regions Covered in the Report |
North America, Europe, Asia-Pacific, Middle East, and Rest of the World |
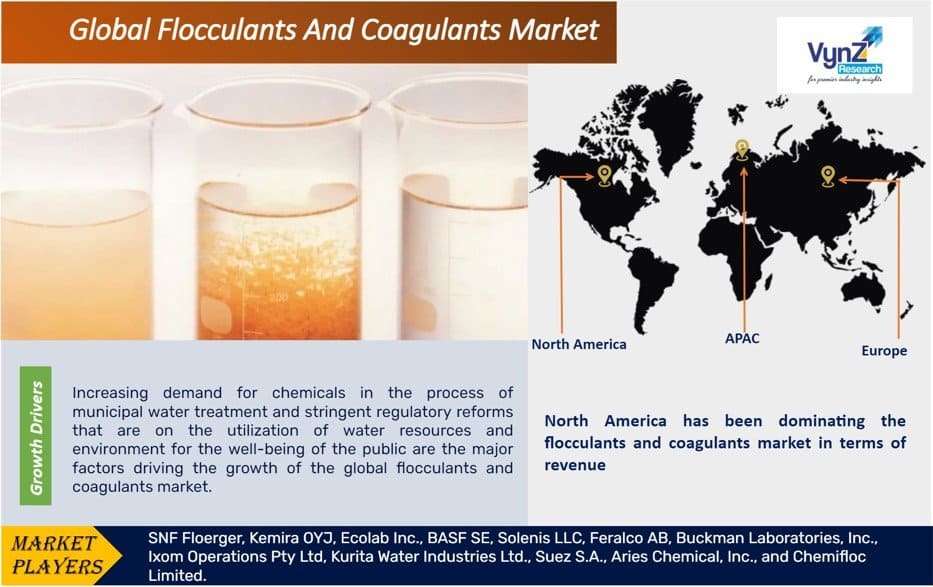
Increasing demand for chemicals in the process of municipal water treatment and stringent regulatory reforms that are on the utilization of water resources and environment for the well-being of the public are the major factors driving the growth of the global flocculants and coagulants market. The growth of the flocculants and coagulants market is highest in Asia-Pacific due to the increasing population and increasing rate of industrialization that has forced the governmental authorities of this region to execute stringent government reforms on the water treatment processes that are further exaggerating the growth of global flocculants and coagulants market.
Accelerating demand for alternative water treatment practices such as UV disinfection and RO filtration are expected to hamper the growth of global flocculants and coagulants market.
Globally industry players in global flocculants and coagulants market are leveraging market growth through technological advancements, product extensions, and the development of a competitive edge that develops competitive strength among the industry players on factors that include operational cost, innovation, product quality, and price.
Geographically, North America has been dominating the flocculants and coagulants market in terms of revenue. Infrastructural development along with the implementation of stringent government reforms are the major factors driving the growth of the flocculants and coagulants market in this region. Furthermore, it has been observed that the encounter of shale gas in North America has bolstered the demand for flocculants and coagulants in the oil & gas industry of this region.
Moreover, Asia-Pacific is expected to witness the fastest growth of 7.7% during the forecast period in terms of value due to rapid industrialization, demand for flocculants and coagulants from municipal sectors increasing demand for renewed water reservoirs. Additionally, the pulp & paper industry in this region occupies a dominant position specifically in Indonesia and China which is ultimately impacting the growth of the flocculants and coagulants market in this region.
Kemira Oyj is a chemical industry group headquartered in Helsinki, Finland. The company was has developed into a global leader in its two main segments, Industry&Water and Pulp&Paper. It has safe, sustainable chemistries which ensure hygiene, safe water, food safety and more. They are the chosen partners for water-intensive industries worldwide, helping their customers design for reuse resources, efficiency and revitalize natural systems.
SNF (a global leader in manufacturing water-soluble polymers) has developed a range of more than 1,000 products that help to preserve natural resources, encourage recycling, and improve industrial process efficiencies. SNF polymers have several complementary functionalities such as rheology modification, flocculation, coagulation and friction reduction.
Some of the key players in the global flocculants and coagulants market include SNF Floerger, Kemira OYJ, Ecolab Inc., BASF SE, Solenis LLC, Feralco AB, Buckman Laboratories, Inc., Ixom Operations Pty Ltd, Kurita Water Industries Ltd., Suez S.A., Aries Chemical, Inc., and Chemifloc Limited.
Recent Developments by Key Players
Qatar University's Gas Processing Centre developed a new method for treating wastewater using green materials. To treat colloidal suspension-contaminated wastewater with fine suspended particles, multiple green materials were examined . A new coagulant for colloidal suspensions has been discovered using natural deep eutectic solvents which are based on choline chloride.
Evoqua Water Technologies has purchased EPICOR, Inc., a leading manufacturer of ion exchange resin and resin mixtures for the energy sector. Evoqua's Integrated solutions and services segment has a stronger ability to serve power market customers with this acquisition.
The Flocculants and Coagulants Market report offers a comprehensive market segmentation analysis along with an estimation for the forecast period 2026–2035.
Segments Covered in the Report
Region Covered in the Report
Source: VynZ Research
1. Research Overview
1.1. The Report Offers
1.2. Market Coverage
1.2.1. By Type
1.2.2. By Application
1.2.3. By Region
1.3. Research Phases
1.4. Limitations
1.5. Market Size Estimations and Forecast
1.5.1. Data Sources
1.5.1.1. Primary Research
1.5.1.2. Secondary Research
1.5.2. Methodology
1.5.2.1. Data Exploration
1.5.2.2. Forecast Parameters
1.5.2.3. Data Validation
1.5.2.4. Assumptions
1.5.3. Study Period & Data Reporting Unit
2. Executive Summary
3. Market Definition
3.1. By Type
3.1.1. Flocculants
3.1.1.1. Anionic
3.1.1.2. Cationic
3.1.1.3. Non-Ionic
3.1.1.4. Amphoteric
3.1.2. Coagulants
3.1.2.1. Organic
3.1.2.1.1. Polyamine
3.1.2.1.2. PolyDADMAC
3.1.2.2. Inorganic
3.1.2.2.1. Aluminum Sulphate
3.1.2.2.2. Polyaluminum Chloride
3.1.2.2.3. Ferric Chloride
3.1.2.2.4. Others
3.2. By Application
3.2.1. Pulp and Paper
3.2.2. Oil and Gas
3.2.3. Water and Wastewater Treatment
3.2.4. Mining
3.2.5. Textile
3.2.6. Others
4. Industry Overview
4.1. Industry Dynamics
4.1.1. Major Drivers
4.1.2. Major Restraints
4.1.3. Key Trends
4.1.4. Key Opportunities
4.2. Industry Ecosystem
4.2.1. Porter’s Five Forces Analysis
4.2.2. Value Chain Analysis
4.3. Competitive Insight
4.3.1. Product Benchmarking of Key Players
4.3.2. Competitive Analysis of Key Players
5. Global Market Estimate and Forecast
5.1. By Type
5.2. By Application
5.3. By Region
6. North America Market Estimate and Forecast
6.1. By Type
6.2. By Application
6.3. By Country
6.3.1. U.S. Market Estimate and Forecast
6.3.1.1. By Type
6.3.1.2. By Application
6.3.2. Canada Market Estimate and Forecast
6.3.2.1. By Type
6.3.2.2. By Application
7. Europe Market Estimate and Forecast
7.1. By Type
7.2. By Application
7.3. By Country
7.3.1. Germany Market Estimate and Forecast
7.3.1.1. By Type
7.3.1.2. By Application
7.3.2. U.K. Market Estimate and Forecast
7.3.2.1. By Type
7.3.2.2. By Application
7.3.3. France Market Estimate and Forecast
7.3.3.1. By Type
7.3.3.2. By Application
7.3.4. Italy Market Estimate and Forecast
7.3.4.1. By Type
7.3.4.2. By Application
7.3.5. Spain Market Estimate and Forecast
7.3.5.1. By Type
7.3.5.2. By Application
7.3.6. Russia Market Estimate and Forecast
7.3.6.1. By Type
7.3.6.2. By Application
7.3.7. Netherlands Market Estimate and Forecast
7.3.7.1. By Type
7.3.7.2. By Application
7.3.8. Rest of Europe Market Estimate and Forecast
7.3.8.1. By Type
7.3.8.2. By Application
8. Asia Pacific Market Estimate and Forecast
8.1. By Type
8.2. By Application
8.3. By Country
8.3.1. China Market Estimate and Forecast
8.3.1.1. By Type
8.3.1.2. By Application
8.3.2. Japan Market Estimate and Forecast
8.3.2.1. By Type
8.3.2.2. By Application
8.3.3. India Market Estimate and Forecast
8.3.3.1. By Type
8.3.3.2. By Application
8.3.4. Australia Market Estimate and Forecast
8.3.4.1. By Type
8.3.4.2. By Application
8.3.5. South Korea Market Estimate and Forecast
8.3.5.1. By Type
8.3.5.2. By Application
8.3.6. Thailand Market Estimate and Forecast
8.3.6.1. By Type
8.3.6.2. By Application
8.3.7. Indonesia Market Estimate and Forecast
8.3.7.1. By Type
8.3.7.2. By Application
8.3.8. Rest of Asia Pacific Market Estimate and Forecast
8.3.8.1. By Type
8.3.8.2. By Application
9. Latin America Market Estimate and Forecast
9.1. By Type
9.2. By Application
9.3. By Country
9.3.1. Mexico Market Estimate and Forecast
9.3.1.1. By Type
9.3.1.2. By Application
9.3.2. Brazil Market Estimate and Forecast
9.3.2.1. By Type
9.3.2.2. By Application
9.3.3. Argentina Market Estimate and Forecast
9.3.3.1. By Type
9.3.3.2. By Application
9.3.4. Rest of Latin America Countries Market Estimate and Forecast
9.3.4.1. By Type
9.3.4.2. By Application
10. Middle East & Africa Market Estimate and Forecast
10.1. By Type
10.2. By Application
10.3. By Country
10.3.1. South Africa Market Estimate and Forecast
10.3.1.1. By Type
10.3.1.2. By Application
10.3.2. Saudi Arabia Market Estimate and Forecast
10.3.2.1. By Type
10.3.2.2. By Application
10.3.3. Rest of MEA Market Estimate and Forecast
10.3.3.1. By Type
10.3.3.2. By Application
11. Company Profiles
11.1. SNF Floerger
11.1.1. Snapshot
11.1.2. Overview
11.1.3. Offerings
11.1.4. Financial Insight
11.1.5. Recent Developments
11.2. Kemira OYJ
11.2.1. Snapshot
11.2.2. Overview
11.2.3. Offerings
11.2.4. Financial Insight
11.2.5. Recent Developments
11.3. Ecolab Inc.
11.3.1. Snapshot
11.3.2. Overview
11.3.3. Offerings
11.3.4. Financial Insight
11.3.5. Recent Developments
11.4. BASF SE
11.4.1. Snapshot
11.4.2. Overview
11.4.3. Offerings
11.4.4. Financial Insight
11.4.5. Recent Developments
11.5. Solenis LLC
11.5.1. Snapshot
11.5.2. Overview
11.5.3. Offerings
11.5.4. Financial Insight
11.5.5. Recent Developments
11.6. Feralco AB
11.6.1. Snapshot
11.6.2. Overview
11.6.3. Offerings
11.6.4. Financial Insight
11.6.5. Recent Developments
11.7. Buckman Laboratories, Inc.
11.7.1. Snapshot
11.7.2. Overview
11.7.3. Offerings
11.7.4. Financial Insight
11.7.5. Recent Developments
11.8. Ixom Operations Pty Ltd
11.8.1. Snapshot
11.8.2. Overview
11.8.3. Offerings
11.8.4. Financial Insight
11.8.5. Recent Developments
11.9. Kurita Water Industries Ltd.
11.9.1. Snapshot
11.9.2. Overview
11.9.3. Offerings
11.9.4. Financial Insight
11.9.5. Recent Developments
11.10. Suez S.A.
11.10.1. Snapshot
11.10.2. Overview
11.10.3. Offerings
11.10.4. Financial Insight
11.10.5. Recent Developments
11.11. Aries Chemical, Inc.
11.11.1. Snapshot
11.11.2. Overview
11.11.3. Offerings
11.11.4. Financial Insight
11.11.5. Recent Developments
11.12. Chemifloc Limited
11.12.1. Snapshot
11.12.2. Overview
11.12.3. Offerings
11.12.4. Financial Insight
11.12.5. Recent Developments
12. Appendix
12.1. Abbreviations
12.2. Exchange Rates
List of Tables
Table 1 Sources
Table 2 Study Periods
Table 3 Data Reporting Unit
Table 4 Global Flocculants and Coagulants Market Size, By Type, USD Billion (2018 – 2023)
Table 5 Global Flocculants and Coagulants Market Size, By Type, USD Billion (2025 – 2030)
Table 6 Global Flocculants and Coagulants Market Size, By Type, USD Billion (2018 – 2023)
Table 7 Global Flocculants and Coagulants Market Size, By Type, USD Billion (2025 – 2030)
Table 8 Global Flocculants and Coagulants Market Size, By Application, USD Billion (2018 – 2023)
Table 9 Global Flocculants and Coagulants Market Size, By Application, USD Billion (2025 – 2030)
Table 10 Global Flocculants and Coagulants Market Size, By Application, USD Billion (2018 – 2023)
Table 11 Global Flocculants and Coagulants Market Size, By Application, USD Billion (2025 – 2030)
Table 12 Global Flocculants and Coagulants Market Size, By Region, USD Billion (2018 – 2023)
Table 13 Global Flocculants and Coagulants Market Size, By Region, USD Billion (2025 – 2030)
Table 14 Global Flocculants and Coagulants Market Size, By Region, USD Billion (2018 – 2023)
Table 15 Global Flocculants and Coagulants Market Size, By Region, USD Billion (2025 – 2030)
Table 16 North America Flocculants and Coagulants Market Size, By Type, USD Billion (2018 – 2023)
Table 17 North America Flocculants and Coagulants Market Size, By Type, USD Billion (2025 – 2030)
Table 18 North America Flocculants and Coagulants Market Size, By Type, USD Billion (2018 – 2023)
Table 19 North America Flocculants and Coagulants Market Size, By Type, USD Billion (2025 – 2030)
Table 20 North America Flocculants and Coagulants Market Size, By Application, USD Billion (2018 – 2023)
Table 21 North America Flocculants and Coagulants Market Size, By Application, USD Billion (2025 – 2030)
Table 22 North America Flocculants and Coagulants Market Size, By Application, USD Billion (2018 – 2023)
Table 23 North America Flocculants and Coagulants Market Size, By Application, USD Billion (2025 – 2030)
Table 24 North America Flocculants and Coagulants Market Size, By Country, USD Billion (2018 – 2023)
Table 25 North America Flocculants and Coagulants Market Size, By Country, USD Billion (2025 – 2030)
Table 26 North America Flocculants and Coagulants Market Size, By Country, USD Billion (2018 – 2023)
Table 27 North America Flocculants and Coagulants Market Size, By Country, USD Billion (2025 – 2030)
Table 28 Europe Flocculants and Coagulants Market Size, By Type, USD Billion (2018 – 2023)
Table 29 Europe Flocculants and Coagulants Market Size, By Type, USD Billion (2025 – 2030)
Table 30 Europe Flocculants and Coagulants Market Size, By Type, USD Billion (2018 – 2023)
Table 31 Europe Flocculants and Coagulants Market Size, By Type, USD Billion (2025 – 2030
Table 32 Europe Flocculants and Coagulants Market Size, By Application, USD Billion (2018 – 2023)
Table 33 Europe Flocculants and Coagulants Market Size, By Application, USD Billion (2025 – 2030)
Table 34 Europe Flocculants and Coagulants Market Size, By Application, USD Billion (2018 – 2023)
Table 35 Europe Flocculants and Coagulants Market Size, By Application, USD Billion (2025 – 2030)
Table 36 Europe Flocculants and Coagulants Market Size, By Country, USD Billion (2018 – 2023)
Table 37 Europe Flocculants and Coagulants Market Size, By Country, USD Billion (2025 – 2030)
Table 38 Europe Flocculants and Coagulants Market Size, By Country, USD Billion (2018 – 2023)
Table 39 Europe Flocculants and Coagulants Market Size, By Country, USD Billion (2025 – 2030)
Table 40 Asia-Pacific Flocculants and Coagulants Market Size, By Type, USD Billion (2018 – 2023)
Table 41 Asia-Pacific Flocculants and Coagulants Market Size, By Type, USD Billion (2025 – 2030)
Table 42 Asia-Pacific Flocculants and Coagulants Market Size, By Type, USD Billion (2018 – 2023)
Table 43 Asia-Pacific Flocculants and Coagulants Market Size, By Type, USD Billion (2025 – 2030)
Table 44 Asia-Pacific Flocculants and Coagulants Market Size, By Application, USD Billion (2018 – 2023)
Table 45 Asia-Pacific Flocculants and Coagulants Market Size, By Application, USD Billion (2025 – 2030)
Table 46 Asia-Pacific Flocculants and Coagulants Market Size, By Application, USD Billion (2018 – 2023)
Table 47 Asia-Pacific Flocculants and Coagulants Market Size, By Application, USD Billion (2025 – 2030)
Table 48 Asia-Pacific Flocculants and Coagulants Market Size, By Country, USD Billion (2018 – 2023)
Table 49 Asia-Pacific Flocculants and Coagulants Market Size, By Country, USD Billion (2025 – 2030)
Table 50 Asia-Pacific Flocculants and Coagulants Market Size, By Country, USD Billion (2018 – 2023)
Table 51 Asia-Pacific Flocculants and Coagulants Market Size, By Country, USD Billion (2025 – 2030)
Table 52 Latin America Flocculants and Coagulants Market Size, By Type, USD Billion (2018 – 2023)
Table 53 Latin America Flocculants and Coagulants Market Size, By Type, USD Billion (2025 – 2030)
Table 54 Latin America Flocculants and Coagulants Market Size, By Type, USD Billion (2018 – 2023)
Table 55 Latin America Flocculants and Coagulants Market Size, By Type, USD Billion (2025 – 2030)
Table 56 Latin America Flocculants and Coagulants Market Size, By Application, USD Billion (2018 – 2023)
Table 57 Latin America Flocculants and Coagulants Market Size, By Application, USD Billion (2025 – 2030)
Table 58 Latin America Flocculants and Coagulants Market Size, By Application, USD Billion (2018 – 2023)
Table 59 Latin America Flocculants and Coagulants Market Size, By Application, USD Billion (2025 – 2030)
Table 60 Latin America Flocculants and Coagulants Market Size, By Country, USD Billion (2018 – 2023)
Table 61 Latin America Flocculants and Coagulants Market Size, By Country, USD Billion (2025 – 2030)
Table 62 Latin America Flocculants and Coagulants Market Size, By Country, USD Billion (2018 – 2023)
Table 63 Latin America Flocculants and Coagulants Market Size, By Country, USD Billion (2025 – 2030)
Table 64 MEA Flocculants and Coagulants Market Size, By Type, USD Billion (2018 – 2023)
Table 65 MEA Flocculants and Coagulants Market Size, By Type, USD Billion (2025 – 2030)
Table 66 MEA Flocculants and Coagulants Market Size, By Type, USD Billion (2018 – 2023)
Table 67 MEA Flocculants and Coagulants Market Size, By Type, USD Billion (2025 – 2030)
Table 68 MEA Flocculants and Coagulants Market Size, By Application, USD Billion (2018 – 2023)
Table 69 MEA Flocculants and Coagulants Market Size, By Application, USD Billion (2025 – 2030)
Table 70 MEA Flocculants and Coagulants Market Size, By Application, USD Billion (2018 – 2023)
Table 71 MEA Flocculants and Coagulants Market Size, By Application, USD Billion (2025 – 2030)
Table 72 MEA Flocculants and Coagulants Market Size, By Country, USD Billion (2018 – 2023)
Table 73 MEA Flocculants and Coagulants Market Size, By Country, USD Billion (2025 – 2030)
Table 74 MEA Flocculants and Coagulants Market Size, By Country, USD Billion (2018 – 2023)
Table 75 MEA Flocculants and Coagulants Market Size, By Country, USD Billion (2025 – 2030)
Table 76 Snapshot – SNF Floerger
Table 77 Snapshot–Kemira OYJ
Table 78 Snapshot – Ecolab Inc.
Table 79 Snapshot – BASF SE
Table 80 Snapshot–Solenis LLC
Table 81 Snapshot –Feralco AB
Table 82 Snapshot – Buckman Laboratories, Inc.
Table 83 Snapshot – Ixom Operations Pty Ltd
Table 84 Snapshot – Kurita Water Industries Ltd.
Table 85 Snapshot –Suez S.A.
Table 86 Snapshot –Aries Chemical, Inc.
Table 87 Snapshot –Chemifloc Limited
List of Figures
Table 1 Sources
Figure 1 Figure 1 Market Coverage
Figure 2 Research Phases
Figure 3 Secondary Sources for Different Parameters
Figure 4 Methodology
Figure 5 Data Mining & Exploration
Figure 6 Data Triangulation
Figure 7 Assumptions for Market Estimation and Forecast
Figure 8 Global Flocculants and Coagulants Market - Growth Drivers and Restraints
Figure 9 Value Chain Analysis
Figure 10 Competitive Benchmarking
Figure 11 Global Flocculants and Coagulants Market Highlight
Figure 12 Global Flocculants and Coagulants Market Size, By Type, USD Billion (2018 - 2030)
Figure 13 Global Flocculants and Coagulants Market Size, By Type, USD Billion (2018 - 2030)
Figure 14 Global Flocculants and Coagulants Market Size, By Application, USD Billion (2018 - 2030)
Figure 15 Global Flocculants and Coagulants Market Size, By Application, USD Billion (2018 - 2030)
Figure 16 Global Flocculants and Coagulants Market Size, By Region, USD Billion (2018 - 2030)
Figure 17 Global Flocculants and Coagulants Market Size, By Region, USD Billion (2018 - 2030)
Figure 18 North America Flocculants and Coagulants Market Highlight
Figure 19 North America Flocculants and Coagulants Market Size, By Type, USD Billion (2018 - 2030)
Figure 20 North America Flocculants and Coagulants Market Size, By Type, USD Billion (2018 - 2030)
Figure 21 North America Flocculants and Coagulants Market Size, By Application, USD Billion (2018 - 2030)
Figure 22 North America Flocculants and Coagulants Market Size, By Application, USD Billion (2018 - 2030)
Figure 23 North America Flocculants and Coagulants Market Size, By Country, USD Billion (2018 - 2030)
Figure 24 North America Flocculants and Coagulants Market Size, By Country, USD Billion (2018 - 2030)
Figure 25 Europe Flocculants and Coagulants Market Highlight
Figure 26 Europe Flocculants and Coagulants Market Size, By Type, USD Billion (2018 - 2030)
Figure 27 Europe Flocculants and Coagulants Market Size, By Type, USD Billion (2018 - 2030)
Figure 28 Europe Flocculants and Coagulants Market Size, By Application, USD Billion (2018 - 2030)
Figure 29 Europe Flocculants and Coagulants Market Size, By Application, USD Billion (2018 - 2030)
Figure 30 Europe Flocculants and Coagulants Market Size, By Country, USD Billion (2018 - 2030)
Figure 31 Europe Flocculants and Coagulants Market Size, By Country, USD Billion (2018 - 2030)
Figure 32 Asia-Pacific Flocculants and Coagulants Market Highlight
Figure 33 Asia-Pacific Flocculants and Coagulants Market Size, By Type, USD Billion (2018 - 2030)
Figure 34 Asia-Pacific Flocculants and Coagulants Market Size, By Type, USD Billion (2018 - 2030)
Figure 35 Asia-Pacific Flocculants and Coagulants Market Size, By Application, USD Billion (2018 - 2030)
Figure 36 Asia-Pacific Flocculants and Coagulants Market Size, By Application, USD Billion (2018 - 2030)
Figure 37 Asia-Pacific Flocculants and Coagulants Market Size, By Country, USD Billion (2018 - 2030)
Figure 38 Asia-Pacific Flocculants and Coagulants Market Size, By Country, USD Billion (2018 - 2030)
Figure 39 Latin America Flocculants and Coagulants Market Highlight
Figure 40 Latin America Flocculants and Coagulants Market Size, By Type, USD Billion (2018 - 2030)
Figure 41 Latin America Flocculants and Coagulants Market Size, By Type, USD Billion (2018 - 2030)
Figure 42 Latin America Flocculants and Coagulants Market Size, By Application, USD Billion (2018 - 2030)
Figure 43 Latin America Flocculants and Coagulants Market Size, By Application, USD Billion (2018 - 2030)
Figure 44 Latin America Flocculants and Coagulants Market Size, By Country, USD Billion (2018 - 2030)
Figure 45 Latin America Flocculants and Coagulants Market Size, By Country, USD Billion (2018 - 2030)
Figure 46 MEA Flocculants and Coagulants Market Highlight
Figure 47 MEA Flocculants and Coagulants Market Size, By Type, USD Billion (2018 - 2030)
Figure 48 MEA Flocculants and Coagulants Market Size, By Type, USD Billion (2018 - 2030)
Figure 49 MEA Flocculants and Coagulants Market Size, By Application, USD Billion (2018 - 2030)
Figure 50 MEA Flocculants and Coagulants Market Size, By Application, USD Billion (2018 - 2030)
Figure 51 MEA Flocculants and Coagulants Market Size, By Country, USD Billion (2018 - 2030)
Figure 52 MEA Flocculants and Coagulants Market Size, By Country, USD Billion (2018 - 2030)
Global Flocculants and Coagulants Market Coverage
Type Insight and Forecast 2025 – 2030
Application Insight and Forecast 2025 – 2030
Geographical Segmentation
Global Flocculants and coagulants Market by Region
North America
Europe
Asia-Pacific
Latin America
Middle East and Africa
Vynz Research know in your business needs, you required specific answers pertaining to the market, Hence, our experts and analyst can provide you the customized research support on your specific needs.
After the purchase of current report, you can claim certain degree of free customization within the scope of the research.
Please let us know, how we can serve you better with your specific requirements to your research needs. Vynz research promises for quick reversal for your current business requirements.
Purchase Options
Latest Report
Research Methodology
Connect With Our Sales Team
Flocculants and Coagulants Market