Green Ammonia Market Size & Share - Growth Forecast Report (2026-2035)
Industry Insight by Technology (Alkaline Water Electrolysis, Proton Exchange Membrane Electrolysis, Solid Oxide Electrolysis), by Application (Fertilizers, Power Generation, Transportation Fuel, Energy Storage, Industrial Feedstock), by Production Process (Electrolysis-Based Synthesis, Steam Methane Reforming with Carbon Capture, Biomass Gasification), by End Use Industry (Agriculture, Power and Utilities, Chemicals, Maritime and Shipping, Industrial Manufacturing)
| Status : Published | Published On : Mar, 2026 | Report Code : VRCH2128 | Industry : Chemicals & Materials | Available Format :
|
Page : 183 |
Green Ammonia Market Overview
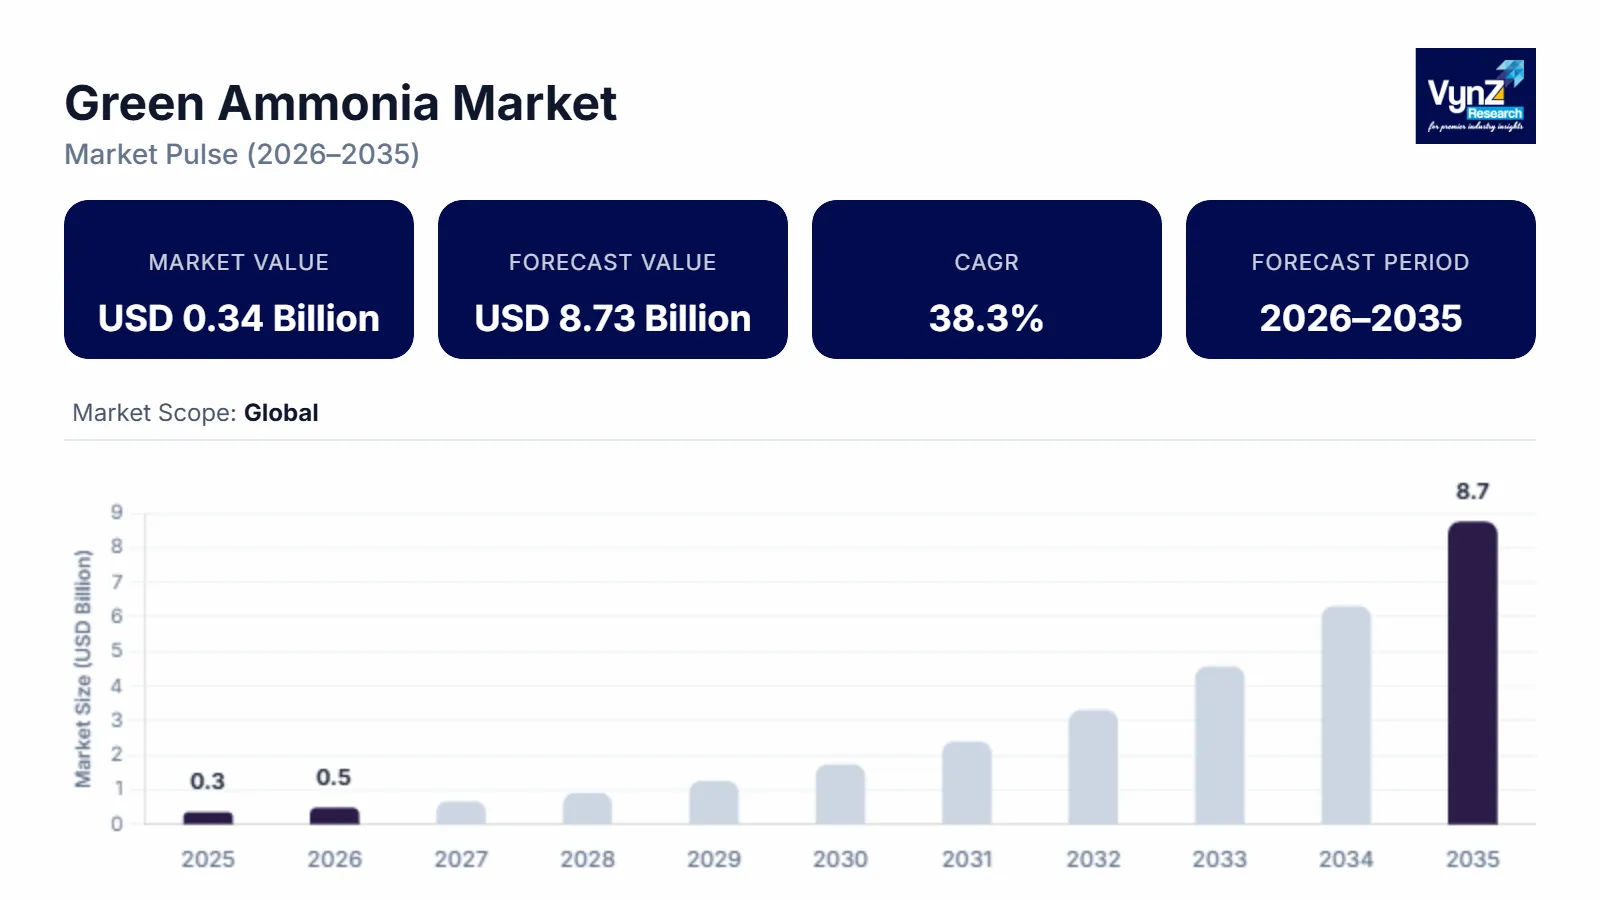
The green ammonia market which was valued at approximately USD 0.34 billion in 2025 and is estimated to rise further up to almost USD 0.47 billion in 2026, is projected to reach around USD 8.73 billion by 2035, expanding at a CAGR of about 38.3% during the forecast period 2026 to 2035.
The green ammonia market is progressing through an early commercialization phase supported by renewable hydrogen integration and industrial decarbonization strategies while the green ammonia market landscape shows increasing alignment between clean energy production and downstream fertilizer and fuel demand. Market expansion results from fast-growing renewable energy installations which industrial sectors implement through their national hydrogen roadmaps and their carbon emission regulations and their increasing use of electrolysis-based ammonia synthesis technologies.
The rising demand for low carbon fertilizers and alternative maritime fuels together with sustained investments in hydrogen hubs, port infrastructure and export-oriented production facilities drive vital economic growth in Japan, Germany and Australia. The International Energy Agency reports that global hydrogen demand reached almost 95 million tons during 2023 while multiple governments introduced incentive programs and production targets to boost clean hydrogen and its derivatives and the International Renewable Energy Agency identifies renewable based ammonia as a vital pathway for achieving long term net zero goals which will lead to structural growth potential until 2035.
Green Ammonia Market Dynamics
Market Trends
The market is moving away from pilot scale initiatives toward initial commercial execution which depends on integrated hydrogen ecosystems and export-oriented production centers. The primary trend of today operates by using renewable energy to power electrolysis processes which produce ammonia through established chemical synthesis methods. The International Energy Agency reports that more than 60 national hydrogen strategies now support industrial derivatives which include ammonia to establish better institutional frameworks and future demand forecasting.
The shipping industry now adopts green ammonia as its primary maritime fuel and energy source because of increasing global shipping decarburization regulations. The International Maritime Organization has established enhanced greenhouse gas reduction policies which aim for net zero emissions by mid-century, which has increased interest in carbon free bunker fuels. The current situation promotes investment into essential export areas by funding port development and storage space construction and creating extended purchase contracts.
Growth Drivers
The industrial sector receives ongoing demand because fertilizer and power generation and heavy transport industries expand their decarburization efforts. The industry now has sufficient supply capacity because of rising investments into renewable power systems and electrolyze production facilities. Financial assistance programs and improved policy incentives accelerate technology adoption. Industrial producers will maintain high demand for low carbon ammonia because they focus on meeting emission standards while reducing their carbon expenses. The International Energy Agency reveals that hydrogen projects will expand their capacity until 2030 when stable regulatory systems and infrastructure upgrades help project implementation.
Market Restraints / Challenges
The expensive production expenses related to renewable electricity costs and electrolyzer equipment expenses prevent operators from competing with traditional ammonia in markets with price sensitive customers. The United Nations Environment Program states that companies need permanent carbon pricing systems together with subsidy matching programs to create a business environment that supports low emission technologies.
The infrastructure system creates operational hazards which depend on its proper functioning. Project expenses escalate when grid access and renewable energy production and electrolysis water availability and export terminal readiness requirements create obstacles. The hydrogen economies face two problems which will slow down their development: a shortage of skilled workers and banks tight credit policies that follow economic downturns.
Market Opportunities
Renewable energy-rich areas present multiple business chances through establishing export-oriented production centers which provide industrial users with low carbon fuel and fertilizer supplies. Countries with strong solar and wind resources are emerging as future green ammonia suppliers. The market will develop demand for modular electrolysis systems and scalable synthesis technologies because utilities and fertilizer producers switch to using clean feedstocks.
Ammonia has potential value for both co-firing applications and grid-scale storage because it serves as a hydrogen transporter and controllable combustion fuel. The development of ammonia-friendly turbines together with advanced combustion technology systems expands the operational capabilities of these systems. The efficiency and long-term business sustainability of plant operations will improve through digital optimization tools and automated plant management solutions.
Global Green Ammonia Market Report Coverage
|
Report Metric |
Details |
|
Historical Period |
2020 - 2024 |
|
Base Year Considered |
2025 |
|
Forecast Period |
2026 - 2035 |
|
Market Size in 2025 |
USD 0.34 Billion |
|
Revenue Forecast in 2035 |
USD 8.73 Billion |
|
Growth Rate |
38.3% |
|
Segments Covered in the Report |
Technology, Application, Production Process, End Use Industry |
|
Report Scope |
Market Trends, Drivers, and Restraints; Revenue Estimation and Forecast; Segmentation Analysis; Companies’ Strategic Developments; Market Share Analysis of Key Players; Company Profiling |
|
Regions Covered in the Report |
Asia Pacific, Europe, North America, Rest of the World |
|
Key Companies |
ACME Group, Air Products and Chemicals, Inc., CF Industries Holdings, Inc., Engie, Fortescue Future Industries, Haldor Topsoe, OCI N.V., Siemens Energy, ThyssenKrupp AG, Yara International ASA |
|
Customization |
Available upon request |
Green Ammonia Market Segmentation
By Technology
The market share of alkaline electrolysis reached 52% in 2025 because of its commercial viability and its lower initial investment requirements and its ability to integrate with existing large-scale ammonia production facilities. The implementation of hydrogen hubs in their initial phase has increased capacity growth in regions that focus on creating industrial decarbonization infrastructure.
The forecast period will show proton exchange membrane electrolysis as the fastest growing technology which will achieve a 48% CAGR due to its enhanced efficiency and its ability to work with variable renewable power and its capacity for modular system installation.
Solid oxide electrolysis is gaining popularity through its high-temperature efficiency and its ability to connect with industrial systems that recycle waste heat which is expected to grow at a 42% annual growth rate.
By Application
Fertilizers represented the largest market segment in 2025 with a 44% market share because ammonia serves as a basic component for nitrogen-based agricultural products and the need for food production emission reductions has increased. Low carbon ammonia will become a permanent component of agricultural practices because global fertilizer demand keeps increasing according to the Food and Agriculture Organization as populations continue to rise.
Power generation will experience the highest growth rate which will reach a CAGR of 47% because coal dependency will decrease through co-firing programs and ammonia-powered turbine tests. Maritime transportation fuels are projected to grow at a 45% CAGR because they will implement the emissions targets which the International Maritime Organization established for international shipping. Energy storage applications are being implemented at a steady pace because grid balancing needs create demand for their functionality.
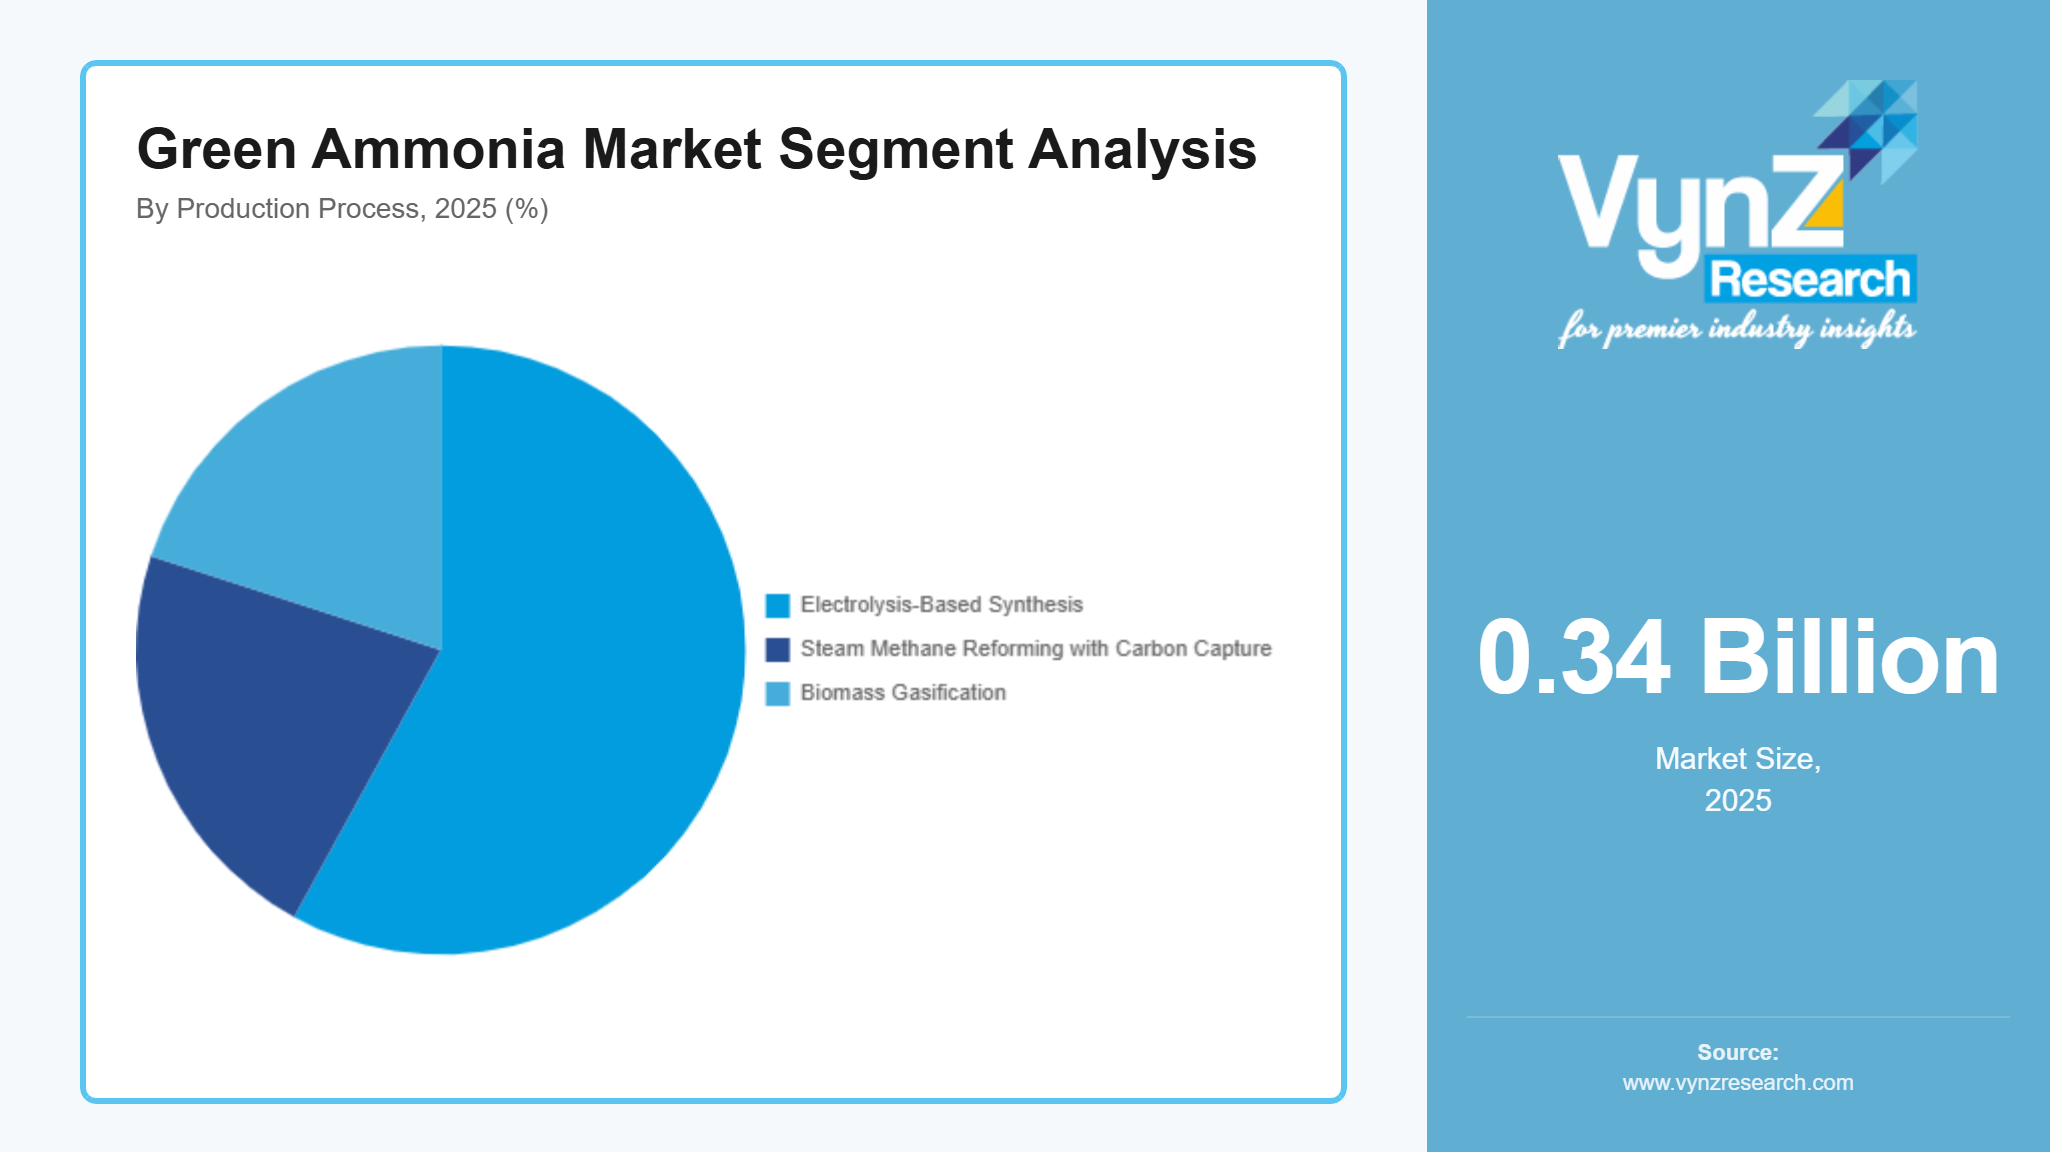
By Production Process
The market recognized electrolysis-based synthesis as the leading method in 2025 when its market share reached 58% because it enables renewable electricity usage together with carbon-free production requirements. The expansion of green hydrogen facilities throughout major renewable-resource countries is driving forward the development of this segment.
The market grows at a 39% annual growth rate because steam methane reforming with carbon capture technology develops at a controlled growth rate which depends on transitional decarbonization methods that apply to areas with current gas distribution systems. Biomass gasification-based production is developing at a 41% CAGR because regions that implement circular economy systems and use agricultural waste to produce clean ammonia are promoting its growth.
By End Use Industry
The agricultural sector had the largest revenue share of 46% in 2025 due to farmers purchasing fertilizer at a constant rate and society demanding more sustainable systems for growing crops. The combination of governmental decarbonization initiatives and climate-friendly agricultural policies is leading to the progressive replacement of traditional ammonia through alternative solutions.
The maritime and shipping industry will experience the most rapid growth which will reach a 49% CAGR because companies will reduce emissions while they shift to new marine fuel types. The power and utilities sector projects a 44% CAGR growth rate because of its ammonia co-firing initiatives and hydrogen carrier technology development while chemical and industrial manufacturing sectors adopt green ammonia as a sustainable raw material according to their enterprise transformation plans.
Regional Insights
Asia Pacific
The market in Asia Pacific reached a 31% share during 2025 due to the region's extensive renewable energy developments and hydrogen policy systems of Japan, China, Australia and India. The national energy plan of Japan includes ammonia co-firing targets while Australia builds production clusters for export that use its abundant solar and wind resources. The International Energy Agency reports that Asia Pacific currently holds the most hydrogen projects which will boost local hydrogen production capabilities and enable long-term supply agreements.
The region's major economies experience infrastructure development while companies install electrolyzers and build port-based hydrogen storage systems due to government hydrogen missions and industrial decarbonization policies.
Europe
The European market will have a 24% share in 2025 because Germany, the Netherlands, France and Spain enforce tough carbon reduction mandates and implement comprehensive clean energy policies. The European Union hydrogen strategy and carbon border adjustment measures are accelerating demand for low emission feedstocks in fertilizers, chemicals, and power generation. The supply chain readiness in the market is improved through the development of import terminals and ammonia projects. The combination of policy support mechanisms and climate aligned funding programs and industrial transition mandates creates a financing environment which improves project bankability. The International Energy Agency identifies Europe as the primary region for upcoming electrolyzer capacity declarations and hydrogen infrastructure development projects which contribute to the ongoing rise in green ammonia use.
North America
The North American market will reach a 19% share during 2025 because the United States and Canada offer federal tax incentives and clean hydrogen production credits and decarbonization commitments. The Gulf Coast of Texas and its industrial hubs develop pilot ammonia facilities which combine with renewable hydrogen production. The Department of Energy for the U.S. identifies clean hydrogen and its derivatives as vital elements for upcoming emission reduction initiatives which will create investment opportunities in fertilizer decarbonization and low carbon fuel production. The region's growth potential expands through the development of new renewable power plants and hydrogen hub systems.
Rest of the World
16% of the market is held by the Rest of the World, which includes the Middle East and Africa and Latin America. UAE, Saudi Arabia, Brazil and Chile are investing heavily in renewable-based ammonia production due to their abundance in solar and wind energy resources. The national diversification strategies together with export-focused energy transition programs create international partnerships and attract infrastructure investments.
While the total market share of Asia Pacific Europe North America and the Rest of the World reach about 90%, smaller emerging economies and early-stage projects that remain unmentioned share the remaining demand which keeps regional market distribution proportionate in the global market.
Competitive Landscape / Company Insights
The green ammonia market has a competitive landscape which combines global and regional market players who compete through technology development and partnership formation and geographic market entry. Companies enhance their market competitive position through investments in electrolyzer performance and their ability to implement renewable energy systems at large scale and build export facilities. National hydrogen strategies and clean energy incentive programs and decarbonization mandates from International Energy Agency and International Renewable Energy Agency promote capacity expansion and long-term supply agreements as market drivers for adoption.
Mini Profiles
ACME Group focuses on large-scale renewable energy and green hydrogen projects, supported by integrated solar portfolios, strategic global partnerships, and cost-efficient production models enabling competitive green ammonia exports.
CF Industries Holdings, Inc. operates in bulk fertilizer and low-carbon ammonia segments, emphasizing large-scale production efficiency, carbon reduction initiatives, and strategic decarbonization investments across North American manufacturing facilities.
Engie leverages renewable power assets, strategic partnerships, and global energy trading expertise to expand green ammonia projects, strengthening international market presence through integrated infrastructure and long-term offtake agreements.
Fortescue Future Industries focuses on green hydrogen and ammonia production, supported by strong capital backing, vertically integrated renewable assets, and global project pipelines targeting large-scale export-driven clean fuel markets.
Yara International ASA operates in premium and sustainable fertilizer segments, emphasizing low-carbon ammonia production, established global distribution networks, and strong brand recognition across agricultural and industrial end-use markets.
Key Players
- ACME Group
- Air Products and Chemicals, Inc.
- CF Industries Holdings, Inc.
- Engie
- Fortescue Future Industries
- Haldor Topsoe
- OCI N.V.
- Siemens Energy
- ThyssenKrupp AG
- Yara International ASA
Recent Developments
In February 2026, ENGIE has signed an agreement to acquire UK Power Networks (UKPN), an electricity distribution network company, for an equity value of £10.5bn. The acquisition values UKPN at an enterprise value of £15.8bn, approximately 1.5-times its estimated regulated asset value as of March 2026 and around ten-times its projected 2027 earnings before interest, taxes, depreciation and amortisation, including unregulated assets.
In January 2026, Air Products, the world’s leading supplier of hydrogen, has been awarded supply contracts from the National Aeronautics and Space Administration (NASA) totaling more than USD 140 million to provide liquid hydrogen for several NASA facilities including the world’s largest hydrogen sphere at NASA’s Kennedy Space Center, the Cape Canaveral Space Force Station and other NASA locations.
In September 2025, The memorandum of understanding (MoU) was signed on 5 September 2025 and formalizes a long-term supply agreement for green ammonia exports from India to Japan involving Indian cleantech firm ACME Cleantech and Japanese partners, with the broader context of the India–Japan Clean Energy Partnership and decarbonization goals. It was signed during Indian Prime Minister Narendra Modi’s official visit to Japan in the presence of both countries’ leaders.
Global Green Ammonia Market Coverage
Technology Insight and Forecast 2026 - 2035
- Alkaline Water Electrolysis
- Proton Exchange Membrane Electrolysis
- Solid Oxide Electrolysis
Application Insight and Forecast 2026 - 2035
- Fertilizers
- Power Generation
- Transportation Fuel
- Energy Storage
- Industrial Feedstock
Production Process Insight and Forecast 2026 - 2035
- Electrolysis-Based Synthesis
- Steam Methane Reforming with Carbon Capture
- Biomass Gasification
End Use Industry Insight and Forecast 2026 - 2035
- Agriculture
- Power and Utilities
- Chemicals
- Maritime and Shipping
- Industrial Manufacturing
Global Green Ammonia Market by Region
- North America
- By Technology
- By Application
- By Production Process
- By End Use Industry
- By Country - U.S., Canada, Mexico
- Europe
- By Technology
- By Application
- By Production Process
- By End Use Industry
- By Country - Germany, U.K., France, Italy, Spain, Russia, Rest of Europe
- Asia-Pacific (APAC)
- By Technology
- By Application
- By Production Process
- By End Use Industry
- By Country - China, Japan, India, South Korea, Vietnam, Thailand, Malaysia, Rest of Asia-Pacific
- Rest of the World (RoW)
- By Technology
- By Application
- By Production Process
- By End Use Industry
- By Country - Brazil, Saudi Arabia, South Africa, U.A.E., Other Countries
Table of Contents for Green Ammonia Market Report
1. Research Overview
1.1. The Report Offers
1.2. Market Coverage
1.2.1. By
Technology
1.2.2. By
Application
1.2.3. By
Production Process
1.2.4. By
End Use Industry
1.3. Research Phases
1.4. Limitations
1.5. Market Methodology
1.5.1. Data Sources
1.5.1.1.
Primary Research
1.5.1.2.
Secondary Research
1.5.2. Methodology
1.5.2.1.
Data Exploration
1.5.2.2.
Forecast Parameters
1.5.2.3.
Data Validation
1.5.2.4.
Assumptions
1.5.3. Study Period & Data Reporting Unit
2. Executive Summary
3. Industry Overview
3.1. Industry Dynamics
3.1.1. Market Growth Drivers
3.1.2. Market Restraints
3.1.3. Key Market Trends
3.1.4. Major Opportunities
3.2. Industry Ecosystem
3.2.1. Porter’s Five Forces Analysis
3.2.2. Recent Development Analysis
3.2.3. Value Chain Analysis
3.3. Competitive Insight
3.3.1. Competitive Position of Industry
Players
3.3.2. Market Attractive Analysis
3.3.3. Market Share Analysis
4. Global Market Estimate and Forecast
4.1. Global Market Overview
4.2. Global Market Estimate and Forecast to 2035
5. Market Segmentation Estimate and Forecast
5.1. By Technology
5.1.1. Alkaline Water Electrolysis
5.1.1.1. Market Definition
5.1.1.2. Market Estimation and Forecast to 2035
5.1.2. Proton Exchange Membrane Electrolysis
5.1.2.1. Market Definition
5.1.2.2. Market Estimation and Forecast to 2035
5.1.3. Solid Oxide Electrolysis
5.1.3.1. Market Definition
5.1.3.2. Market Estimation and Forecast to 2035
5.2. By Application
5.2.1. Fertilizers
5.2.1.1. Market Definition
5.2.1.2. Market Estimation and Forecast to 2035
5.2.2. Power Generation
5.2.2.1. Market Definition
5.2.2.2. Market Estimation and Forecast to 2035
5.2.3. Transportation Fuel
5.2.3.1. Market Definition
5.2.3.2. Market Estimation and Forecast to 2035
5.2.4. Energy Storage
5.2.4.1. Market Definition
5.2.4.2. Market Estimation and Forecast to 2035
5.2.5. Industrial Feedstock
5.2.5.1. Market Definition
5.2.5.2. Market Estimation and Forecast to 2035
5.3. By Production Process
5.3.1. Electrolysis-Based Synthesis
5.3.1.1. Market Definition
5.3.1.2. Market Estimation and Forecast to 2035
5.3.2. Steam Methane Reforming with Carbon Capture
5.3.2.1. Market Definition
5.3.2.2. Market Estimation and Forecast to 2035
5.3.3. Biomass Gasification
5.3.3.1. Market Definition
5.3.3.2. Market Estimation and Forecast to 2035
5.4. By End Use Industry
5.4.1. Agriculture
5.4.1.1. Market Definition
5.4.1.2. Market Estimation and Forecast to 2035
5.4.2. Power and Utilities
5.4.2.1. Market Definition
5.4.2.2. Market Estimation and Forecast to 2035
5.4.3. Chemicals
5.4.3.1. Market Definition
5.4.3.2. Market Estimation and Forecast to 2035
5.4.4. Maritime and Shipping
5.4.4.1. Market Definition
5.4.4.2. Market Estimation and Forecast to 2035
5.4.5. Industrial Manufacturing
5.4.5.1. Market Definition
5.4.5.2. Market Estimation and Forecast to 2035
6. North America Market Estimate and Forecast
6.1. By
Technology
6.2. By
Application
6.3. By
Production Process
6.4. By
End Use Industry
6.4.1.
U.S. Market Estimate and Forecast
6.4.2.
Canada Market Estimate and Forecast
6.4.3.
Mexico Market Estimate and Forecast
7. Europe Market Estimate and Forecast
7.1. By
Technology
7.2. By
Application
7.3. By
Production Process
7.4. By
End Use Industry
7.4.1.
Germany Market Estimate and Forecast
7.4.2.
France Market Estimate and Forecast
7.4.3.
U.K. Market Estimate and Forecast
7.4.4.
Italy Market Estimate and Forecast
7.4.5.
Spain Market Estimate and Forecast
7.4.6.
Russia Market Estimate and Forecast
7.4.7.
Rest of Europe Market Estimate and Forecast
8. Asia-Pacific (APAC) Market Estimate and Forecast
8.1. By
Technology
8.2. By
Application
8.3. By
Production Process
8.4. By
End Use Industry
8.4.1.
China Market Estimate and Forecast
8.4.2.
Japan Market Estimate and Forecast
8.4.3.
India Market Estimate and Forecast
8.4.4.
South Korea Market Estimate and Forecast
8.4.5.
Rest of Asia-Pacific Market Estimate and Forecast
9. Rest of the World (RoW) Market Estimate and Forecast
9.1. By
Technology
9.2. By
Application
9.3. By
Production Process
9.4. By
End Use Industry
9.4.1.
Brazil Market Estimate and Forecast
9.4.2.
Saudi Arabia Market Estimate and Forecast
9.4.3.
South Africa Market Estimate and Forecast
9.4.4.
U.A.E. Market Estimate and Forecast
9.4.5.
Other Countries Market Estimate and Forecast
10. Company Profiles
10.1.
ACME Group
10.1.1.
Snapshot
10.1.2.
Overview
10.1.3.
Offerings
10.1.4.
Financial
Insight
10.1.5.
Recent
Developments
10.2.
Air Products and Chemicals, Inc.
10.2.1.
Snapshot
10.2.2.
Overview
10.2.3.
Offerings
10.2.4.
Financial
Insight
10.2.5.
Recent
Developments
10.3.
CF Industries Holdings, Inc.
10.3.1.
Snapshot
10.3.2.
Overview
10.3.3.
Offerings
10.3.4.
Financial
Insight
10.3.5.
Recent
Developments
10.4.
Engie
10.4.1.
Snapshot
10.4.2.
Overview
10.4.3.
Offerings
10.4.4.
Financial
Insight
10.4.5.
Recent
Developments
10.5.
Fortescue Future Industries
10.5.1.
Snapshot
10.5.2.
Overview
10.5.3.
Offerings
10.5.4.
Financial
Insight
10.5.5.
Recent
Developments
10.6.
Haldor Topsoe
10.6.1.
Snapshot
10.6.2.
Overview
10.6.3.
Offerings
10.6.4.
Financial
Insight
10.6.5.
Recent
Developments
10.7.
OCI N.V.
10.7.1.
Snapshot
10.7.2.
Overview
10.7.3.
Offerings
10.7.4.
Financial
Insight
10.7.5.
Recent
Developments
10.8.
Siemens Energy
10.8.1.
Snapshot
10.8.2.
Overview
10.8.3.
Offerings
10.8.4.
Financial
Insight
10.8.5.
Recent
Developments
10.9.
ThyssenKrupp AG
10.9.1.
Snapshot
10.9.2.
Overview
10.9.3.
Offerings
10.9.4.
Financial
Insight
10.9.5.
Recent
Developments
10.10.
Yara International ASA
10.10.1.
Snapshot
10.10.2.
Overview
10.10.3.
Offerings
10.10.4.
Financial
Insight
10.10.5.
Recent
Developments
11. Appendix
11.1. Exchange Rates
11.2. Abbreviations
Note: Financial insight and recent developments of different companies are subject to the availability of information in the secondary domain.
Frequently Asked Questions
Purchase Options
Latest Report
Research Methodology
- Desk Research / Pilot Interviews
- Build Market Size Model
- Research and Analysis
- Final Deliverable
Connect With Our Sales Team
- Toll-Free: +1-888-253-3960
- Phone: +91 9960 288 381
- Email: enquiry@vynzresearch.com
Green Ammonia Market