
Waste Water Treatment Chemicals Market Size & Share Growth Forecast Report (2026-2035)
Industry Insight by Product Type (Coagulants and flocculants, Biocides and disinfectants, pH adjusters and softeners, Defoamers and antifoaming agents, Other specialty treatment chemicals), by Application (Municipal wastewater treatment, Industrial effluent treatment, Sludge treatment, Other specialized applications), by Treatment Stage (Primary treatment, Secondary treatment, Tertiary and advanced treatment, Sludge handling and conditioning), by End Use (Municipal utilities, Industrial facilities, Commercial and institutional users, Other end users)
| Status : Published | Published On : Oct, 2026 | Report Code : VRCH2147 | Industry : Chemicals & Materials | Available Format :

|
Page : 154 |
Waste Water Treatment Chemicals Market Overview
The global waste water treatment chemicals market size was estimated at approximately USD 38.81 billion in 2025 and is expected to reach around USD 40.32 billion in 2026, rising to roughly USD 56.76 billion by 2035, growing at an estimated 3.87% CAGR from 2026 to 2035.
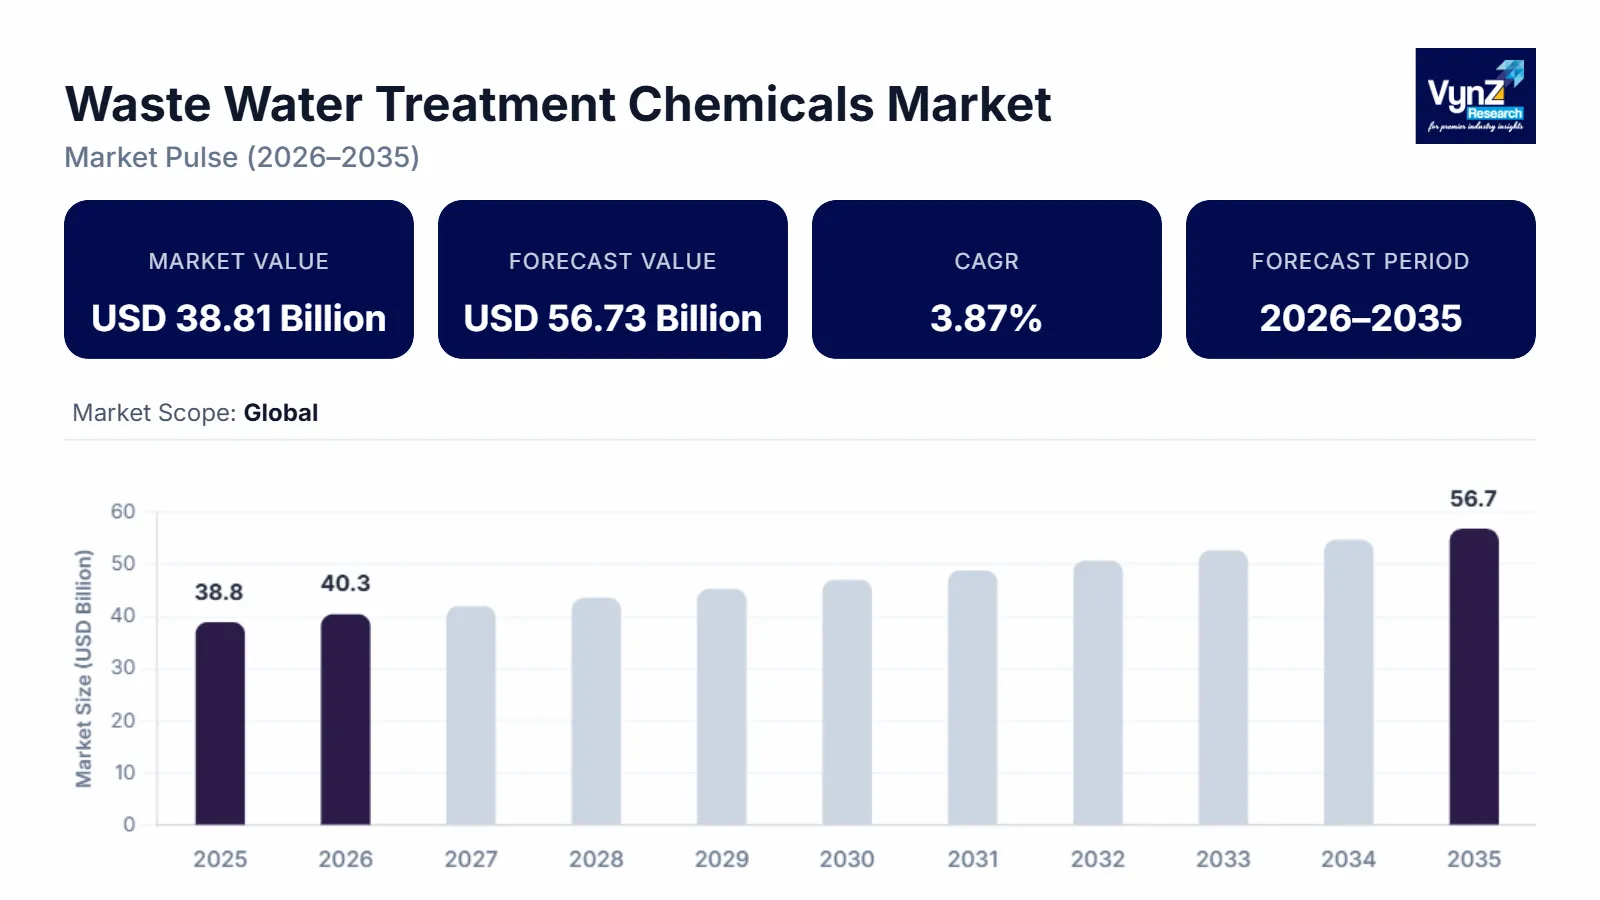
Market growth is driven by stricter wastewater discharge requirements, rising industrial water reuse, and expansion of municipal sewage-treatment infrastructure. The UN-Water Progress on Wastewater Treatment 2024 Update reported that, among the countries for which data were available, 60% of total wastewater was safely treated in 2022. The report cautions that the data were insufficient to establish a complete global estimate. In India, the Ministry of Housing and Urban Affairs' AMRUT 2.0 program is supporting sewage treatment and reuse infrastructure, strengthening demand for coagulants, flocculants, disinfectants, and pH-control chemicals.
Research Methodology
VynZ Research assesses the market through secondary research, including company disclosures, product information, regulatory publications, government wastewater infrastructure reports, and established market studies. The VynZ Research team compares market estimates, reviews demand across chemical categories and end-use industries, and evaluates regional investment trends. The forecast considers wastewater generation, treatment infrastructure, discharge standards, industrial water reuse, chemical costs, and product innovation. Segment-level growth figures are analytical estimates and should not be interpreted as government-published statistics.
Research Highlights
- Coagulants and flocculants accounted for an estimated 31% share in 2025, supported by their role in removing suspended solids and improving clarification.
- Industrial effluent treatment is estimated to represent approximately 38% of application demand in 2025, owing to manufacturing wastewater and stricter discharge requirements.
- Primary treatment accounted for an estimated 32.22% share in 2025 in the broader water treatment chemicals market, reflecting the regular use of chemicals in coagulation and flocculation.
- Advanced and tertiary treatment chemicals are estimated to grow at approximately 5.2% CAGR from 2026 to 2035, due to demand for improved effluent quality and water reuse.
- Asia-Pacific is estimated to hold approximately 29% of market revenue in 2025, for urban wastewater infrastructure investment and industrial expansion.
Waste Water Treatment Chemicals Market Dynamics
Market Trends
The industry is moving toward chemical formulations that improve contaminant removal while reducing sludge, chemical consumption, and operating costs. Digital monitoring and automated dosing are also gaining importance, as treatment facilities seek more consistent effluent quality and better control over chemical use. Another emerging trend is the growing focus on PFAS management and more sustainable treatment materials.
Growth Drivers
The market is supported by the need to treat municipal sewage and industrial effluent before discharge or reuse. UN-Water's 2024 update highlights the global need to reduce untreated wastewater and increase safe reuse, while India's AMRUT 2.0 program supports sewage infrastructure development and capacity upgrades. These investments sustain demand for chemicals used in clarification, disinfection, pH adjustment, and sludge management. Industrial compliance is another major driver. Manufacturing, power generation, oil and gas, food processing, and chemical production require treatment programs suited to their wastewater composition. Increasing water scarcity and reuse targets further support chemical demand because reclaimed water often requires controlled clarification, contaminant removal, and disinfection before reuse.
Market Restraints / Challenges
Chemical price volatility can affect supplier margins and increase operating expenses for wastewater-treatment facilities. The broader water treatment chemicals sector faces exposure to changing input costs, including chemicals used in coagulants, pH adjustment, and specialty formulations. Smaller operators may find it difficult to absorb repeated price increases while maintaining treatment performance. A second challenge is the need to manage chemical dosage, sludge generation, and residual contaminants without compromising discharge quality. Wastewater composition can vary significantly between industrial sites and even across production cycles. Treatment facilities therefore require testing, skilled operators, safe storage, and monitoring systems, adding complexity and cost to chemical procurement and use.
Market Opportunities
Water reuse and recycling offer opportunities for suppliers that can provide chemical programs tailored to changing wastewater quality. India's Ministry of Housing and Urban Affairs reported that AMRUT 2.0 projects covered 6,739 MLD of sewage-treatment capacity, including new capacity and augmentation, with 2,093 MLD planned for recycling or reuse. This creates potential demand for clarification chemicals, disinfection products, and sludge-conditioning solutions. A further opportunity lies in automated dosing and specialized formulations for industrial effluent. Suppliers combining treatment chemicals with testing, monitoring, and technical services can help customers improve consistency and reduce unnecessary chemical consumption. Solutions designed for difficult-to-treat wastewater, including streams containing persistent contaminants, may also gain importance as treatment standards evolve.
Global Waste Water Treatment Chemicals Market Report Coverage
|
Report Metric |
Details |
|
Historical Period |
2020 - 2024 |
|
Base Year Considered |
2025 |
|
Forecast Period |
2026 - 2035 |
|
Market Size in 2025 |
USD 38.81 Billion |
|
Revenue Forecast in 2035 |
USD 56.76 Billion |
|
Growth Rate |
3.87% |
|
Segments Covered in the Report |
Product Type, Application, Treatment Stage, End Use |
|
Report Scope |
Market Trends, Drivers, and Restraints; Revenue Estimation and Forecast; Segmentation Analysis; Companies’ Strategic Developments; Market Share Analysis of Key Players; Company Profiling |
|
Regions Covered in the Report |
North America, Europe, Asia-Pacific, Latin America, Middle East and Africa |
|
Key Companies |
BASF SE, Chemtrade Logistics, Dow, Ecolab, Kemira, Kurita Water Industries, SNF, Solenis, SUEZ, Veolia |
|
Customization |
Available upon request |
Waste Water Treatment Chemicals Market Segmentation
By Product Type
Coagulants and flocculants are estimated to have accounted for approximately 31% of market revenue in 2025, supported by their use in suspended-solids removal, clarification, and sludge treatment. Their demand spans municipal wastewater plants and industrial facilities, where chemical treatment helps separate contaminants before later treatment stages.
Biocides and disinfectants are estimated to grow at approximately 5% CAGR from 2026 to 2035, supported by the need to control microorganisms and improve treated-water quality. Demand depends on wastewater composition, treatment objectives, and applicable discharge or reuse requirements.
By Application
Industrial effluent treatment is estimated to account for approximately 38% of application demand in 2025, reflecting the need to manage wastewater generated by manufacturing, power generation, oil and gas, food processing, and chemical production.
Municipal wastewater treatment is estimated to grow at approximately 4.4% CAGR from 2026 to 2035, supported by sewage-treatment investment and the expansion of collection and treatment infrastructure.
By Treatment Stage
Primary treatment accounted for an estimated 32.22% share in 2025 because the performance of initial treatment can influence the load placed on later processes.
Tertiary and advanced treatment chemicals are estimated to grow at approximately 5.2% CAGR from 2026 to 2035, supported by demand for improved effluent quality and reclaimed water.
By End Use
Municipal utilities are estimated to account for approximately 35% of market demand in 2025, reflecting their ongoing need to treat sewage and maintain water-quality standards before discharge or reuse.
Industrial facilities are estimated to grow at approximately 4.8% CAGR from 2026 to 2035, owing to wastewater compliance requirements, manufacturing activity, and efforts to reuse process water.
Regional Insights
North America
North America is estimated to account for approximately 30% of the global market in 2025, supported by municipal treatment infrastructure, industrial wastewater requirements, and investment in water reuse. Demand comes from utilities and industrial sites that need consistent treatment performance and compliance with discharge conditions. The U.S. Environmental Protection Agency's Clean Water Act framework regulates pollutant discharges and establishes a regulatory basis for wastewater treatment investment.
Asia Pacific
Asia Pacific is estimated to hold approximately 29% of market revenue in 2025, driven by urban growth, industrial activity, and investment in sewage infrastructure. China, India, Japan, and Southeast Asian economies represent important demand centers, with requirements varying across municipal systems and manufacturing industries. India's Ministry of Housing and Urban Affairs reported in March 2025 that AMRUT 2.0 projects covered 6,739 MLD of new or augmented sewage-treatment capacity, creating opportunities for treatment chemicals and associated services.
Europe
Europe is estimated to account for approximately 20% of market revenue in 2025, supported by established wastewater infrastructure, industrial treatment requirements, and continued focus on environmental protection. Demand is generated by municipal utilities and industrial operators seeking reliable contaminant removal, sludge management, and compliance with discharge standards. European Union wastewater policy has increasingly emphasized treatment performance and pollution reduction, supporting the need for effective treatment processes and monitoring.
The remaining estimated 21% of market revenue in 2025 is attributed to Latin America, the Middle East, and Africa, where demand varies with municipal infrastructure investment, industrial development, water scarcity, and the pace of wastewater-treatment project implementation.
Competitive Landscape / Company Insights
The market is competitive, with global suppliers and regional specialists offering coagulants, flocculants, disinfectants, pH-control products, and other treatment chemicals. Companies compete through formulation performance, technical service, supply reliability, and customized treatment programs. Digital dosing and monitoring are becoming more important as customers seek consistent treatment outcomes and better control of chemical consumption. The broader sector includes established suppliers such as BASF, Ecolab, Kemira, Kurita, Solenis, SUEZ, and Veolia.
Mini Profiles
BASF SE supplies chemical products and specialty materials, including water-treatment monomers and flocculants, supported by its manufacturing and research capabilities.
Chemtrade Logistics supplies industrial chemicals used in water and wastewater treatment, including coagulants and other products for municipal and industrial customers.
Dow provides specialty materials and chemical technologies used in industrial water management, helping customers address process performance and operational requirements.
SNF specializes in water-soluble polymers, including flocculants used in clarification, solid-liquid separation, and sludge dewatering across municipal and industrial facilities.
SUEZ provides water and wastewater treatment technologies and services, supporting municipal and industrial customers with treatment, resource recovery, and water-reuse solutions.
Key Players
- BASF SE
- Chemtrade Logistics
- Dow
- Ecolab
- Kemira
- Kurita Water Industries
- SNF
- Solenis
- SUEZ
- Veolia
Recent Developments
Ecolab’s 3D TRASAR for Effluent solution features automated chemical dosing and monitoring of parameters such as turbidity and pH. The system is designed to support wastewater treatment performance and compliance through improved process visibility.
Kemira completed a full-scale U.S. trial of its chlorine-free KemConnect DEX wastewater treatment solution with Capital Region Water. The trial demonstrated an approach to reducing bacteria counts while adapting to changing water conditions.
Kurita Water Industries began full-scale joint development efforts to commercialize PFAS-free components for water treatment facilities, including a diaphragm valve developed with Asahi Yukizai. The initiative includes prototype development and demonstration testing using actual water-treatment facilities.
Solenis completed its acquisition of NCH Corporation, broadening its reach across water treatment and related specialty chemical services. The transaction supports its expansion of customer coverage and service capabilities.
Veolia joined a consortium developing a major industrial wastewater reuse project for the SATORP petrochemical complex in Jubail Industrial City, Saudi Arabia. The planned facility is designed to treat and reuse approximately 8.8 million cubic metres of industrial effluent annually.
Global Waste Water Treatment Chemicals Market Coverage
Product Type Insight and Forecast 2026 - 2035
- Coagulants and flocculants
- Biocides and disinfectants
- pH adjusters and softeners
- Defoamers and antifoaming agents
- Other specialty treatment chemicals
Application Insight and Forecast 2026 - 2035
- Municipal wastewater treatment
- Industrial effluent treatment
- Sludge treatment
- Other specialized applications
Treatment Stage Insight and Forecast 2026 - 2035
- Primary treatment
- Secondary treatment
- Tertiary and advanced treatment
- Sludge handling and conditioning
End Use Insight and Forecast 2026 - 2035
- Municipal utilities
- Industrial facilities
- Commercial and institutional users
- Other end users
Global Waste Water Treatment Chemicals Market by Region
- North America
- By Product Type
- By Application
- By Treatment Stage
- By End Use
- By Country - U.S., Canada, Mexico
- Europe
- By Product Type
- By Application
- By Treatment Stage
- By End Use
- By Country - Germany, U.K., France, Italy, Spain, Russia, Rest of Europe
- Asia-Pacific (APAC)
- By Product Type
- By Application
- By Treatment Stage
- By End Use
- By Country - China, Japan, India, South Korea, Vietnam, Thailand, Malaysia, Rest of Asia-Pacific
- Rest of the World (RoW)
- By Product Type
- By Application
- By Treatment Stage
- By End Use
- By Country - Brazil, Saudi Arabia, South Africa, U.A.E., Other Countries
Table of Contents for Waste Water Treatment Chemicals Market Report
1. Research Overview
1.1. The Report Offers
1.2. Market Coverage
1.2.1. By
Product Type
1.2.2. By
Application
1.2.3. By
Treatment Stage
1.2.4. By
End Use
1.3. Research Phases
1.4. Limitations
1.5. Market Methodology
1.5.1. Data Sources
1.5.1.1.
Primary Research
1.5.1.2.
Secondary Research
1.5.2. Methodology
1.5.2.1.
Data Exploration
1.5.2.2.
Forecast Parameters
1.5.2.3.
Data Validation
1.5.2.4.
Assumptions
1.5.3. Study Period & Data Reporting Unit
2. Executive Summary
3. Industry Overview
3.1. Industry Dynamics
3.1.1. Market Growth Drivers
3.1.2. Market Restraints
3.1.3. Key Market Trends
3.1.4. Major Opportunities
3.2. Industry Ecosystem
3.2.1. Porter’s Five Forces Analysis
3.2.2. Recent Development Analysis
3.2.3. Value Chain Analysis
3.3. Competitive Insight
3.3.1. Competitive Position of Industry
Players
3.3.2. Market Attractive Analysis
3.3.3. Market Share Analysis
4. Global Market Estimate and Forecast
4.1. Global Market Overview
4.2. Global Market Estimate and Forecast to 2035
5. Market Segmentation Estimate and Forecast
5.1. By Product Type
5.1.1. Coagulants and flocculants
5.1.1.1. Market Definition
5.1.1.2. Market Estimation and Forecast to 2035
5.1.2. Biocides and disinfectants
5.1.2.1. Market Definition
5.1.2.2. Market Estimation and Forecast to 2035
5.1.3. pH adjusters and softeners
5.1.3.1. Market Definition
5.1.3.2. Market Estimation and Forecast to 2035
5.1.4. Defoamers and antifoaming agents
5.1.4.1. Market Definition
5.1.4.2. Market Estimation and Forecast to 2035
5.1.5. Other specialty treatment chemicals
5.1.5.1. Market Definition
5.1.5.2. Market Estimation and Forecast to 2035
5.2. By Application
5.2.1. Municipal wastewater treatment
5.2.1.1. Market Definition
5.2.1.2. Market Estimation and Forecast to 2035
5.2.2. Industrial effluent treatment
5.2.2.1. Market Definition
5.2.2.2. Market Estimation and Forecast to 2035
5.2.3. Sludge treatment
5.2.3.1. Market Definition
5.2.3.2. Market Estimation and Forecast to 2035
5.2.4. Other specialized applications
5.2.4.1. Market Definition
5.2.4.2. Market Estimation and Forecast to 2035
5.3. By Treatment Stage
5.3.1. Primary treatment
5.3.1.1. Market Definition
5.3.1.2. Market Estimation and Forecast to 2035
5.3.2. Secondary treatment
5.3.2.1. Market Definition
5.3.2.2. Market Estimation and Forecast to 2035
5.3.3. Tertiary and advanced treatment
5.3.3.1. Market Definition
5.3.3.2. Market Estimation and Forecast to 2035
5.3.4. Sludge handling and conditioning
5.3.4.1. Market Definition
5.3.4.2. Market Estimation and Forecast to 2035
5.4. By End Use
5.4.1. Municipal utilities
5.4.1.1. Market Definition
5.4.1.2. Market Estimation and Forecast to 2035
5.4.2. Industrial facilities
5.4.2.1. Market Definition
5.4.2.2. Market Estimation and Forecast to 2035
5.4.3. Commercial and institutional users
5.4.3.1. Market Definition
5.4.3.2. Market Estimation and Forecast to 2035
5.4.4. Other end users
5.4.4.1. Market Definition
5.4.4.2. Market Estimation and Forecast to 2035
6. North America Market Estimate and Forecast
6.1. By
Product Type
6.2. By
Application
6.3. By
Treatment Stage
6.4. By
End Use
6.4.1.
U.S. Market Estimate and Forecast
6.4.2.
Canada Market Estimate and Forecast
6.4.3.
Mexico Market Estimate and Forecast
7. Europe Market Estimate and Forecast
7.1. By
Product Type
7.2. By
Application
7.3. By
Treatment Stage
7.4. By
End Use
7.4.1.
Germany Market Estimate and Forecast
7.4.2.
France Market Estimate and Forecast
7.4.3.
U.K. Market Estimate and Forecast
7.4.4.
Italy Market Estimate and Forecast
7.4.5.
Spain Market Estimate and Forecast
7.4.6.
Russia Market Estimate and Forecast
7.4.7.
Rest of Europe Market Estimate and Forecast
8. Asia-Pacific (APAC) Market Estimate and Forecast
8.1. By
Product Type
8.2. By
Application
8.3. By
Treatment Stage
8.4. By
End Use
8.4.1.
China Market Estimate and Forecast
8.4.2.
Japan Market Estimate and Forecast
8.4.3.
India Market Estimate and Forecast
8.4.4.
South Korea Market Estimate and Forecast
8.4.5.
Rest of Asia-Pacific Market Estimate and Forecast
9. Rest of the World (RoW) Market Estimate and Forecast
9.1. By
Product Type
9.2. By
Application
9.3. By
Treatment Stage
9.4. By
End Use
9.4.1.
Brazil Market Estimate and Forecast
9.4.2.
Saudi Arabia Market Estimate and Forecast
9.4.3.
South Africa Market Estimate and Forecast
9.4.4.
U.A.E. Market Estimate and Forecast
9.4.5.
Other Countries Market Estimate and Forecast
10. Company Profiles
10.1.
BASF SE
10.1.1.
Snapshot
10.1.2.
Overview
10.1.3.
Offerings
10.1.4.
Financial
Insight
10.1.5.
Recent
Developments
10.2.
Chemtrade Logistics
10.2.1.
Snapshot
10.2.2.
Overview
10.2.3.
Offerings
10.2.4.
Financial
Insight
10.2.5.
Recent
Developments
10.3.
Dow
10.3.1.
Snapshot
10.3.2.
Overview
10.3.3.
Offerings
10.3.4.
Financial
Insight
10.3.5.
Recent
Developments
10.4.
Ecolab
10.4.1.
Snapshot
10.4.2.
Overview
10.4.3.
Offerings
10.4.4.
Financial
Insight
10.4.5.
Recent
Developments
10.5.
Kemira
10.5.1.
Snapshot
10.5.2.
Overview
10.5.3.
Offerings
10.5.4.
Financial
Insight
10.5.5.
Recent
Developments
10.6.
Kurita Water Industries
10.6.1.
Snapshot
10.6.2.
Overview
10.6.3.
Offerings
10.6.4.
Financial
Insight
10.6.5.
Recent
Developments
10.7.
SNF
10.7.1.
Snapshot
10.7.2.
Overview
10.7.3.
Offerings
10.7.4.
Financial
Insight
10.7.5.
Recent
Developments
10.8.
Solenis
10.8.1.
Snapshot
10.8.2.
Overview
10.8.3.
Offerings
10.8.4.
Financial
Insight
10.8.5.
Recent
Developments
10.9.
SUEZ
10.9.1.
Snapshot
10.9.2.
Overview
10.9.3.
Offerings
10.9.4.
Financial
Insight
10.9.5.
Recent
Developments
10.10.
Veolia
10.10.1.
Snapshot
10.10.2.
Overview
10.10.3.
Offerings
10.10.4.
Financial
Insight
10.10.5.
Recent
Developments
11. Appendix
11.1. Exchange Rates
11.2. Abbreviations
Note: Financial insight and recent developments of different companies are subject to the availability of information in the secondary domain.
Frequently Asked Questions
Purchase Options
Latest Report
Research Methodology
- Desk Research / Pilot Interviews
- Build Market Size Model
- Research and Analysis
- Final Deliverable
Connect With Our Sales Team
- Toll-Free: +1-888-253-3960
- Phone: +91 9960 288 381
- Email: enquiry@vynzresearch.com
Waste Water Treatment Chemicals Market