Status : Published | Published On : Apr, 2024 | Report Code : VRICT5179 | Industry : ICT & Media | Available Format :
![]() |
Page : 198 |
The Global FPGA Market is expected to reach USD 26.8 billion in 2030 from USD 11.7 billion in 2023 with a compound annual growth rate CAGR of 17.2% throughout the forecast period (2025-2030).
The increasing demand for streaming data processing and efficient data flow in various applications is driving the market growth. The adoption of FPGA architecture is on the rise due to its capabilities, such as high compute density and low power consumption. Also the rising trend for the adoption of field programmable gate array in areas of network processing, deep packet inspection and security is projected to drive their demand over the forecast period. Product launches by major players, such as ultra-low power consumption, handheld and mobile applications are anticipated to drive the market growth over the forecast period.
Market Segmentation
Insight by Configuration
Based on configuration, the FPGA market is segmented into low-end, mid-end and high-end FPGA. The high-end FPGA segment accounted for the largest market share of over as they are attributed to their enhanced features, such as substantial memory capacity, large number of logic elements and a wide array of advanced functionalities.
Mid-range FPGAs are expected to register the highest CAGR over the forecast period, due to their features like small form factor, low power consumption and high performance for FPGA-based devices.
Insight by Node Size
The FPGA Market is segmented by node size as below 16nm, 20-90nm and 90nm. The 20-90 nm segment dominated the market during the forecast period as this node size are recognized for their low power consumption and durability.
Insight by Technology
On the basis of Technology, the FPGA Market is divided into SRAM, Antifuse, Flash. The Static Random-Access Memory (SRAM) segment accounted for the largest market share during the forecast period due to the properties that include re-programmability, high integration and better flexibility for various applications.
Insight by Vertical
Based on application, the FPGA Market is segmented into consumer electronics, telecom, industrial, automotive, healthcare, multimedia, military & aerospace, broadcasting, datacenter and computing. The telecom sector dominated the market during the forecast period. FPGA market expanded due to the growing usage of field programmable gate arrays in telecom sector for numerous applications like data packet processing, optical transport network and packet switching
Report Metric |
Details |
Historical Period |
2020 - 2024 |
Base Year Considered |
2025 |
Forecast Period |
2026 - 2035 |
Market Size in 2025 |
U.S.D. 11.7 Billion |
Revenue Forecast in 2035 |
U.S.D. 26.8 Billion |
Growth Rate |
17.2% |
Segments Covered in the Report |
By Configuration, By Node size, By Technology, By Vertical |
Report Scope |
Market Trends, Drivers, and Restraints; Revenue Estimation and Forecast; Segmentation Analysis; Impact of COVID-19; Companies’ Strategic Developments; Market Share Analysis of Key Players; Company Profiling |
Regions Covered in the Report |
North America, Asia-Pacific, Europe and Rest of the World |
Industry Dynamics
Growth Drivers
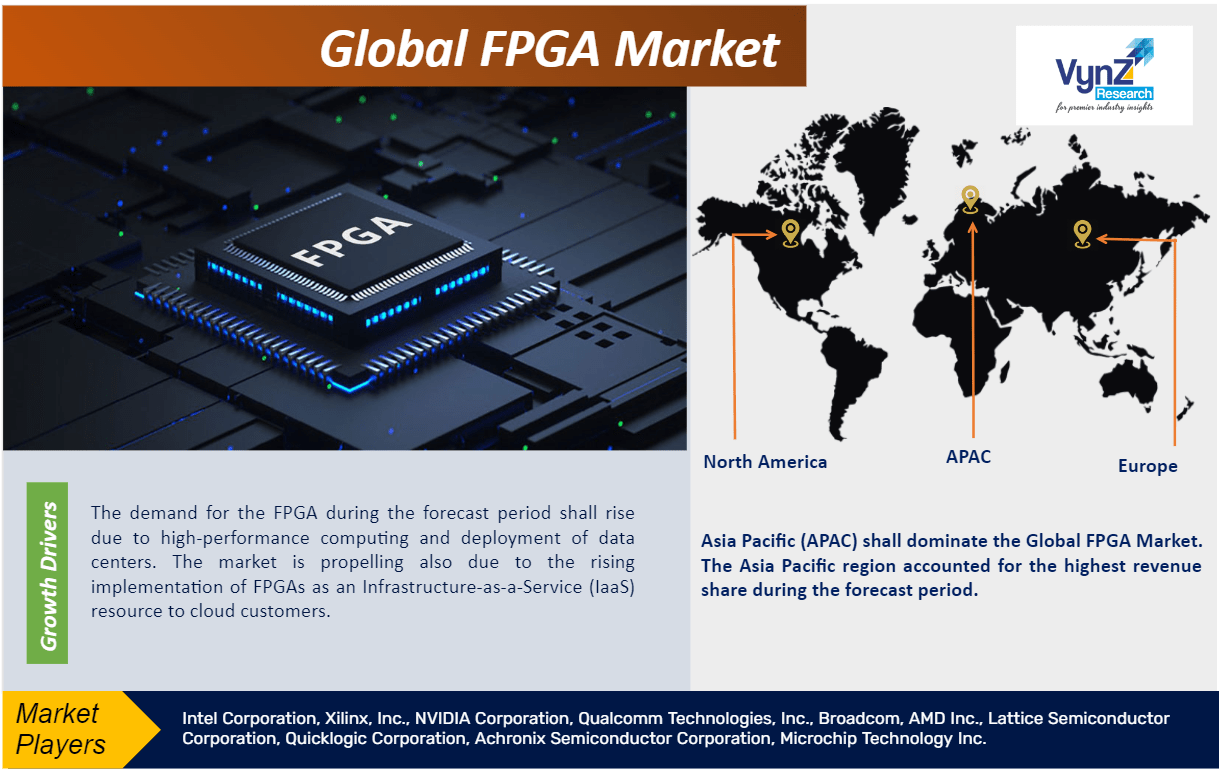
The demand for the FPGA during the forecast period shall rise due to high-performance computing and deployment of data centers. The market is propelling also due to the rising implementation of FPGAs as an Infrastructure-as-a-Service (IaaS) resource to cloud customers. Various cloud service providers are deploying field programming gate arrays to enhance their service-oriented tasks such as webpage ranking, memory caching, network encryption, high-frequency trading, deep learning and video conversion. FPGAs are used for machine learning and deep learning in the technology industry. FPGAs provide a combination of speed, and flexibility, programmability, cost effective and complexity to develop custom application-specific integrated circuits (ASICs). In addition, growth and advancement in technology development for 5G networking infrastructure and an increase in the use of FPGA in various end-user industries are some of the factors driving the studied market growth. In addition, many market players are continuously investing in the latest technology to develop innovative products. Furthermore, the automotive industry has too appear as a significant driver for stimulating the market demand. Various companies are entering into collaboration and partnerships to enhance their product offering along with increasing their geographical presence in the market. Also, to align with the evolving requirements of the automotive industry, major players are continuously upgrading their product portfolio.
Restraints
The main constraint of the FPGA Market is the high cost of FPGAs. Other types of programmable logic devices (PLDs) are less expensive than FPGAs. This high cost limits the adoption of FPGAs, especially in small and medium-sized enterprises (SMEs). FPGAs are more complex to design than other PLDs hence their design complexity is also the another restraint for the market which increases the cost and time. The total cost of ownership (TCO) of FPGAs increases as the FPGA market consume more power than other PLDs.
Geographic Overview
Geographically, Asia Pacific (APAC) shall dominate the Global FPGA Market. The Asia Pacific region accounted for the highest revenue share during the forecast period. China accounted for the largest revenue share in the region due to continuous investments and initiatives undertaken by the government to augment the industry growth. In April 2023, China's southern Guangdong province launched the second phase of semiconductor fund with an investment of over USD 4.3 billion which shall help the region to build self-reliance in key technology areas such as semiconductors. Such initiatives are expected to drive the FPGA market in the region.
Competitive Insights
Intel Corp (Intel) designs and develops technology products and components. The company has a large product portfolio that includes chipsets, embedded processors, graphic, microprocessors and microcontrollers, programmable devices, network and communication, laptops, gaming systems and ethernet products.
AMD, founded in 1969 as a Silicon Valley start-up is the high performance and adaptive computing leader, powering the products and services that help solve the world’s most important challenges. AMD has grown into a global company setting the standard for modern computing, with many important industry firsts and major technological achievements.
The key players of the global FPGA Market include Intel Corporation, Xilinx, Inc., NVIDIA Corporation, Qualcomm Technologies, Inc., Broadcom, AMD Inc., Lattice Semiconductor Corporation, Quicklogic Corporation, Achronix Semiconductor Corporation, Microchip Technology Inc.
Recent Development by Key Players
Recently, Intel has built the world's largest neuromorphic system, code-named Hala Point, this large-scale neuromorphic system, initially deployed at Sandia National Laboratories, which utilizes Intel’s Loihi 2 processor and focus at supporting research for future brain-inspired artificial intelligence (AI) to tackle challenges related to the efficiency and sustainability of today’s AI.
Lattice Collaborates with NVIDIA to Accelerate Edge AI. This collaboration with Lattice will accelerate innovations in sensor processing and help simplify the deployment of edge-to-cloud AI applications.
The global FPGA Market report offers a comprehensive market segmentation analysis along with estimation for the forecast period 2025–2030.
Segments Covered in the Report
Region Covered in the Report
Source: VynZ Research
1. Research Overview
1.1. The Report Offers
1.2. Market Coverage
1.2.1. By Configuration
1.2.2. By Node size
1.2.3. By Technology
1.2.4. By Vertical
1.2.6. By Region
1.3. Research Phases
1.4. Limitations
1.5. Market Methodology
1.5.1. Data Sources
1.5.1.1. Primary Research
1.5.1.2. Secondary Research
1.5.2. Methodology
1.5.2.1. Data Exploration
1.5.2.2. Forecast Parameters
1.5.2.3. Data Validation
1.5.2.4. Assumptions
1.5.3. Study Period & Data Reporting Unit
2. Executive Summary
3. End-user Type Overview
3.1. End-user Type Dynamics
3.1.1. Market Growth Drivers
3.1.2. Market Restraints
3.1.3. Key Market Trends
3.1.4. Major Opportunities
3.2. End-user Type Ecosystem
3.2.1. Porter’s Five Forces Analysis
3.2.2. Recent Development Analysis
3.2.3. Value Chain Analysis
3.3. Competitive Insight
3.3.1. Competitive Position of End-user Type Players
3.3.2. Market Attractive Analysis
3.3.3. Market Share Analysis
4. Global Market Estimate and Forecast
4.1. Global Market Overview
4.2. Global Market Estimate and Forecast to 2030
5. Market Segmentation Estimate and Forecast
5.1. By Configuration
5.1.1. Low-end
5.1.1.1. Market Definition
5.1.1.2. Market Estimation and Forecast to 2030
5.1.2 Mid-end
5.1.2.1. Market Definition
5.1.2.2. Market Estimation and Forecast to 2030
5.1.3. High-end
5.1.3.1. Market Definition
5.1.3.2. Market Estimation and Forecast to 2030
5.2. By Node size
5.2.1. 16nm
5.2.1.1. Market Definition
5.2.1.2. Market Estimation and Forecast to 2030
5.2.2. 20-90nm
5.2.2.1. Market Definition
5.2.2.2. Market Estimation and Forecast to 2030
5.2.3. 90nm
5.2.3.1. Market Definition
5.2.3.2. Market Estimation and Forecast to 2030
5.3 By Technology
5.3.1. SRAM
5.3.1.1. Market Definition
5.3.1.2. Market Estimation and Forecast to 2030
5.3.2. Antifuse
5.3.2.1. Market Definition
5.3.2.2. Market Estimation and Forecast to 2030
5.3.3. Flash
5.3.3.1. Market Definition
5.3.3.2. Market Estimation and Forecast to 2030
5.4. By Vertical
5.4.1. Consumer Electronics
5.4.1.1. Market Definition
5.4.1.2. Market Estimation and Forecast to 2030
5.4.2. Telecom
5.4.2.1. Market Definition
5.4.2.2. Market Estimation and Forecast to 2030
5.4.3. Industrial
5.4.3.1. Market Definition
5.4.3.2. Market Estimation and Forecast to 2030
5.4.4. Automotive
5.4.4.1. Market Definition
5.4.4.2. Market Estimation and Forecast to 2030
5.4.5. Healthcare
5.4.5.1. Market Definition
5.4.5.2. Market Estimation and Forecast to 2030
5.4.6. Military & Aerospace
5.4.6.1. Market Definition
5.4.6.2. Market Estimation and Forecast to 2030
5.4.7. Broadcasting
5.4.7.1. Market Definition
5.4.7.2. Market Estimation and Forecast to 2030
5.4.8. Datacenter and Computing
5.4.8.1. Market Definition
5.4.8.2. Market Estimation and Forecast to 2030
5.4.9. Multimedia
5.4.9.1. Market Definition
5.4.9.2. Market Estimation and Forecast to 2030
5.4.10. Military & Aerospace
5.4.10.1 Market Definition
5.4.10,2. Market Estimation and Forecast to 2030
5.4.11. Broadcasting
5.4.11.1. Market Definition
5.4.11.2. Market Estimation and Forecast to 2030
5.4.12. Datacenter and Computing
5.4.12.1. Market Definition
5.4.12.2. Market Estimation and Forecast to 2030
6. North America Market Estimate and Forecast
6.1. By Configuration
6.2. By Node size
6.3. By Technology
6.4. By Vertical
6.5. By Country – China, Japan, India, South Korea, and Rest of Asia-Pacific
6.5.1. U.S. Market Estimate and Forecast
6.5.2. Canada Market Estimate and Forecast
6.5.3. Mexico Market Estimate and Forecast
7. Europe Market Estimate and Forecast
7.1. By Configuration
7.2. By Node size
7.3. By Technology
7.4. By Vertical
7.5. By Country – China, Japan, India, South Korea, and Rest of Asia-Pacific
7.5.1. Germany Market Estimate and Forecast
7.5.2. France Market Estimate and Forecast
7.5.3. U.K. Market Estimate and Forecast
7.5.4. Italy Market Estimate and Forecast
7.5.5. Spain Market Estimate and Forecast
7.5.6. Rest of Europe Market Estimate and Forecast
8. Asia-Pacific Market Estimate and Forecast
8.1. By Configuration
8.2. By Node size
8.3. By Technology
8.4. By Vertical
8.5. By Country – China, Japan, India, South Korea, and Rest of Asia-Pacific
8.5.1. China Market Estimate and Forecast
8.5.2. Japan Market Estimate and Forecast
8.5.3. India Market Estimate and Forecast
8.5.4. South Korea Market Estimate and Forecast
8.5.5. Singapore Market Estimate and Forecast
8.5.6. Rest of Asia-Pacific Market Estimate and Forecast
9. Rest of the World (RoW) Market Estimate and Forecast
9.1. By Configuration
9.2. By Node size
9.3. By Technology
9.4. By Vertical
9.5. By Country – Brazil, Saudi Arabia, South Africa, U.A.E., and Other Countries
9.5.1. Brazil Market Estimate and Forecast
9.5.2. Saudi Arabia Market Estimate and Forecast
9.5.3. South Africa Market Estimate and Forecast
9.5.4. Other Countries Market Estimate and Forecast
10. Company Profiles
10.1. Intel Corporation
10.1.1. Snapshot
10.1.2. Overview
10.1.3. Offerings
10.1.4. Financial Insight
10.1.5. Recent Developments
10.2. Xilinx, Inc.
10.2.1. Snapshot
10.2.2. Overview
10.2.3. Offerings
10.2.4. Financial Insight
10.2.5. Recent Developments
10.3. NVIDIA Corporation
10.3.1. Snapshot
10.3.2. Overview
10.3.3. Offerings
10.3.4. Financial Insight
10.3.5. Recent Developments
10.4. Qualcomm Technologies, Inc.
10.4.1. Snapshot
10.4.2. Overview
10.4.3. Offerings
10.4.4. Financial Insight
10.4.5. Recent Developments
10.5. Broadcom
10.5.1. Snapshot
10.5.2. Overview
10.5.3. Offerings
10.5.4. Financial Insight
10.5.5. Recent Developments
10.6. AMD Inc.
10.6.1. Snapshot
10.6.2. Overview
10.6.3. Offerings
10.6.4. Financial Insight
10.6.5. Recent Developments
10.7. Lattice Semiconductor Corporation
10.7.1. Snapshot
10.7.2. Overview
10.7.3. Offerings
10.7.4. Financial Insight
10.7.5. Recent Developments
10.8. Quicklogic Corporation
10.8.1. Snapshot
10.8.2. Overview
10.8.3. Offerings
10.8.4. Financial Insight
10.8.5. Recent Developments
10.9. Achronix Semiconductor Corporation
10.9.1. Snapshot
10.9.2. Overview
10.9.3. Offerings
10.9.4. Financial Insight
10.9.5. Recent Developments
10.10. Microchip Technology Inc.
10.10.1. Snapshot
10.10.2. Overview
10.10.3. Offerings
10.10.4. Financial Insight
10.10.5. Recent Development
11. Appendix
11.1. Exchange Rates
11.2. Abbreviations
Note: Financial insight and recent developments of different companies are subject to the availability of information in the secondary domain.
List of Tables
Table 1 Configuration
Table 2 Study Periods
Table 3 Data Reporting Unit
Table 4 Global FPGA Market Size, by Configuration , 2018-2023 (USD Billion)
Table 5 Global FPGA Market Size, by Configuration , 2025-2030 (USD Billion)
Table 6 Global FPGA Market Size, by Node size, 2018-2023 (USD Billion)
Table 7 Global FPGA Market Size, by Node size, 2025-2030 (USD Billion)
Table 8 Global FPGA Market Size, by Technology, 2018-2023 (USD Billion)
Table 9 Global FPGA Market Size, by Technology, 2025-2030 (USD Billion)
Table 10 Global FPGA Market Size, by Vertical , 2018-2023 (USD Billion)
Table 11 Global FPGA Market Size, by Vertical , 2025-2030 (USD Billion)
Table 12 Global FPGA Market Size, by Region, 2018-2023 (USD Billion)
Table 13 Global FPGA Market Size, by Region, 2025-2030 (USD Billion)
Table 14 North America FPGA Market Size, by Configuration , 2018-2023 (USD Billion)
Table 15 North America FPGA Market Size, by Configuration , 2025-2030 (USD Billion)
Table 16 North America FPGA Market Size, by Node size, 2018-2023 (USD Billion)
Table 17 North America FPGA Market Size, by Node size, 2025-2030 (USD Billion)
Table 18 North America FPGA Market Size, by Technology, 2018-2023 (USD Billion)
Table 19 North America FPGA Market Size, by Technology, 2025-2030 (USD Billion)
Table 20 North America FPGA Market Size, by Vertical , 2018-2023 (USD Billion)
Table 21 North America FPGA Market Size, by Vertical , 2025-2030 (USD Billion)
Table 22 North America FPGA Market Size, by Country, 2018-2023 (USD Billion)
Table 23 North America FPGA Market Size, by Country, 2025-2030 (USD Billion)
Table 24 Europe FPGA Market Size, by Configuration , 2018-2023 (USD Billion)
Table 25 Europe FPGA Market Size, by Configuration, 2025-2030 (USD Billion)
Table 26 Europe FPGA Market Size, by Node size, 2018-2023 (USD Billion)
Table 27 Europe FPGA Market Size, by Node size, 2025-2030 (USD Billion)
Table 28 Europe FPGA Market Size, by Technology, 2018-2023 (USD Billion)
Table 29 Europe FPGA Market Size, by Technology, 2025-2030 (USD Billion)
Table 30 Europe FPGA Market Size, by Vertical , 2018-2023 (USD Billion)
Table 31 Europe FPGA Market Size, by Vertical , 2025-2030 (USD Billion)
Table 32 Europe FPGA Market Size, by Country, 2018-2023 (USD Billion)
Table 33 Europe FPGA Market Size, by Country, 2025-2030 (USD Billion)
Table 34 Asia-Pacific FPGA Market Size, by Configuration, 2018-2023 (USD Billion)
Table 35 Asia-Pacific FPGA Market Size, by Configuration, 2025-2030 (USD Billion)
Table 36 Asia-Pacific FPGA Market Size, by Node size, 2018-2023 (USD Billion)
Table 37 Asia-Pacific FPGA Market Size, by Node size, 2025-2030 (USD Billion)
Table 38 Asia-Pacific FPGA Market Size, by Technology, 2018-2023 (USD Billion)
Table 39 Asia-Pacific FPGA Market Size, by Technology, 2025-2030 (USD Billion)
Table 40 Asia-Pacific FPGA Market Size, by Vertical, 2018-2023 (USD Billion)
Table 41 Asia-Pacific FPGA Market Size, by Vertical, 2025-2030 (USD Billion)
Table 42 Asia-Pacific FPGA Market Size, by Country, 2018-2023 (USD Billion)
Table 43 Asia-Pacific FPGA Market Size, by Country, 2025-2030 (USD Billion)
Table 44 RoW FPGA Market Size, by Configuration, 2018-2023 (USD Billion)
Table 45 RoW FPGA Market Size, by Configuration, 2025-2030 (USD Billion)
Table 46 RoW FPGA Market Size, by Node size, 2018-2023 (USD Billion)
Table 47 RoW FPGA Market Size, by Node size, 2025-2030 (USD Billion)
Table 48 RoW FPGA Market Size, by Technology, 2018-2023 (USD Billion)
Table 49 RoW FPGA Market Size, by Technology, 2025-2030 (USD Billion)
Table 50 RoW FPGA Market Size, by Vertical , 2018-2023 (USD Billion)
Table 51 RoW FPGA Market Size, by Vertical , 2025-2030 (USD Billion)
Table 52 RoW FPGA Market Size, by Country, 2018-2023 (USD Billion)
Table 53 RoW FPGA Market Size, by Country, 2025-2030 (USD Billion)
Table 54 Snapshot – Intel Corporation
Table 55 Snapshot – Xilinx, Inc.
Table 56 Snapshot – NVIDIA Corporation
Table 57 Snapshot – Qualcomm Technologies, Inc.
Table 58 Snapshot – Broadcom
Table 59 Snapshot – AMD Inc.
Table 60 Snapshot – Lattice Semiconductor Corporation
Table 61 Snapshot – Quicklogic Corporation
Table 62 Snapshot – Achronix Semiconductor Corporation
Table 63 Snapshot – Microchip Technology Inc.
List of Figures
Figure 1 Market Coverage
Figure 2 Research Phases
Figure 3 Secondary Configuration s for Different Parameters
Figure 4 Methodology
Figure 5 Data Mining & Exploration
Figure 6 Data Triangulation
Figure 7 Assumptions for Market Estimation and Forecast
Figure 8 Market Synopsis
Figure 9 Global FPGA Market - Growth Drivers and Restraints
Figure 10 Competitive Benchmark
Figure 11 Global FPGA Market Highlight
Figure 12 Global FPGA Market Size, by Configuration, 2018 – 2030 (USD Billion)
Figure 13 Global FPGA Market Size, by Node size 2018 – 2030 (USD Billion)
Figure 14 Global FPGA Market Size, by Technology 2018 – 2030 (USD Billion)
Figure 15 Global FPGA Market Size, by Vertical 2018 – 2030 (USD Billion)
Figure 16 Global FPGA Market Size, by Region, 2018 – 2030 (USD Billion)
Figure 17 North America FPGA Market Highlight
Figure 18 North America FPGA Market Size, by Configuration, 2018 – 2030 (USD Billion)
Figure 19 North America FPGA Market Size, by Node size 2018–2030 (USD Billion)
Figure 20 North America FPGA Market Size, by Technology 2018–2030 (USD Billion)
Figure 21 North America FPGA Market Size, by Vertical 2018–2030 (USD Billion)
Figure 22 North America FPGA Market Size, by Country, 2018 – 2030 (USD Billion)
Figure 23Europe FPGA Market Highlight
Figure 24 Europe FPGA Market Size, by Configuration , 2018 – 2030 (USD Billion)
Figure 25 Europe FPGA Market Size, by Node size 2018 – 2030 (USD Billion)
Figure 26 Europe FPGA Market Size, by Technology 2018 – 2030 (USD Billion)
Figure 27 Europe FPGA Market Size, by Vertical 2018 – 2030 (USD Billion)
Figure 28 Europe FPGA Market Size, by Country, 2018 – 2030 (USD Billion)
Figure 29 Asia-Pacific FPGA Market Highlight
Figure 30 Asia-Pacific FPGA Market Size, by Configuration , 2018 – 2030 (USD Billion)
Figure 31 Asia-Pacific FPGA Market Size, by Node size 2018 – 2030 (USD Billion)
Figure 32 Asia-Pacific FPGA Market Size, by Technology 2018 – 2030 (USD Billion)
Figure 33 Asia-Pacific FPGA Market Size, by Vertical 2018 – 2030 (USD Billion)
Figure 34 Asia-Pacific FPGA Market Size, by Country, 2018 – 2030 (USD Billion)
Figure 35 RoW FPGA Market Highlight
Figure 36 RoW FPGA Market Size, by Configuration, 2018 – 2030 (USD Billion)
Figure 37 RoW FPGA Market Size, by Node size 2018 – 2030 (USD Billion)
Figure 38 RoW FPGA Market Size, by Technology 2018 – 2030 (USD Billion)
Figure 39 RoW FPGA Market Size, by Vertical 2018 – 2030 (USD Billion)
Figure 40 RoW FPGA Market Size, by Country, 2018 – 2030 (USD Billion)
FPGA Market Coverage
By Configuration Insight and Forecast 2025-2030
By Node size Insight and Forecast 2025-2030
By Technology Insight and Forecast 2025-2030
By Vertical Insight and Forecast 2025-2030
Global FPGA by Region
North America
Europe
Asia-Pacific (APAC)
Rest of the World (RoW)
Vynz Research know in your business needs, you required specific answers pertaining to the market, Hence, our experts and analyst can provide you the customized research support on your specific needs.
After the purchase of current report, you can claim certain degree of free customization within the scope of the research.
Please let us know, how we can serve you better with your specific requirements to your research needs. Vynz research promises for quick reversal for your current business requirements.
Purchase Options
Latest Report
Research Methodology
Connect With Our Sales Team