Europe Vertical Farming Market Overview
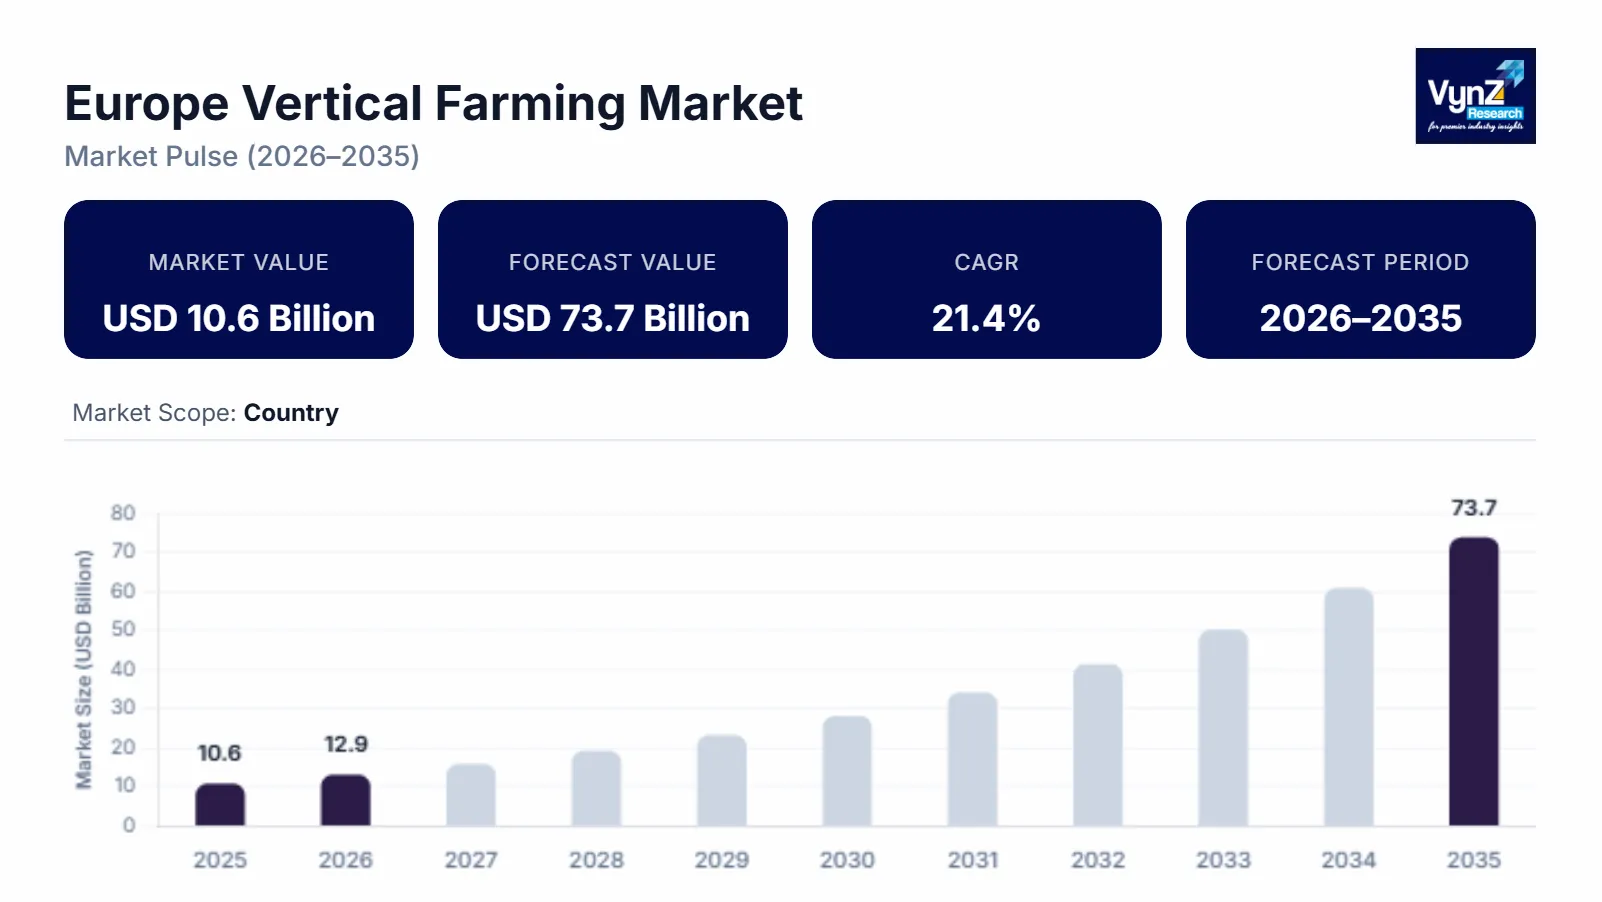
The Europe vertical farming market size was estimated at about USD 10.6 billion in 2025 and is expected to reach around USD 12.8 billion in 2026 rising up to roughly USD 73.7 billion by 2035, growing at about 21.4% CAGR from 2026 to 2035.
Research Highlights
- Hardware systems led with 57% share in 2025 due to infrastructure expansion.
- Hydroponics dominated with 63% share in 2025 supported by higher adoption.
- Indoor warehouse farms held 50% share in 2025 driven by urban industrial space conversion.
- Software platforms projected fastest growth at 22.1% CAGR supported by EU digital agriculture programs.
- Netherlands led with approximately 17% share in 2025 driven by advanced greenhouse and agri tech.
The main reason for the market growing is that more farmers, food producers and policymakers are using it to make sure food production is stable. Vertical farming is a way to grow food in a controlled environment, which helps when there is less water and the weather is bad. Some studies by the FAO and UNDP show that vertical farming can use up to 90% less water. The fact that there isn’t a lot of land to grow food on is also making the market for vertical farming grow.
The government is also helping the vertical farming market grow with programs like Horizon Europe, The Common Agricultural Policy, The European Agricultural Fund for Rural Development and The LIFE Program. These programs are especially helping in countries like Germany, the Netherlands, Spain, Italy and the UK, helping to meet food demand.
Europe Vertical Farming Market Dynamics
Market Trends
The market is moving towards hydroponic and aeroponic farming to use resources efficiently and have stable crop production. Food producers are using automated farming and AI to monitor crops and control the climate and more farming projects are underway in cities. A lot of money is being invested in making irrigation systems, energy-efficient lighting and other farming tools.
Growth Drivers
Farmers want to use automated irrigation, energy-efficient farming and AI to monitor crops and this is pushing the market forward. Issues like production delay and limited transportation are other concerns about having food and people want to buy food that is produced locally. Bad weather, less rain and too much heat is also affecting the market, according to the European Environment Agency. The market is growing substantially in the Netherlands, Germany, France and the U.K because of advanced farming technology, help from Horizon Europe and money from the European Agricultural Fund for Rural Development.
Market Restraints / Challenges
The significant challenge in this market is that it costs a lot to set up systems to control the climate and lighting and to use automated technology. It also costs a lot for electricity, which makes it hard to farm in remote areas and does not help the market grow. Additionally, it is hard to adopt this kind of farming because it is complicated to run and manage and it is hard to understand the data, preventing small farmers and businesses from using vertical farming.
Market Opportunities
Producers want to farm in a way that is strong, advanced and can produce food all year round and this is creating new opportunities for the market. Consumers, stores and restaurants want to buy food that is produced locally which is opening new avenues for the market to grow. Other good openings include less reliance on supply chains, better tools to help with crop production using computers to predict what will happen, using renewable energy and using advanced farming systems.
Europe Vertical Farming Market Report Coverage
|
Report Metric
|
Details
|
|
Historical Period
|
2020 - 2024
|
|
Base Year Considered
|
2025
|
|
Forecast Period
|
2026 - 2035
|
|
Market Size in 2025
|
U.S.D. 10.6 Billion
|
|
Revenue Forecast in 2035
|
U.S.D. 73.7 Billion
|
|
Growth Rate
|
21.4%
|
|
Segments Covered in the Report
|
Offering, Growth Mechanism, Structure, Crop Type
|
|
Report Scope
|
Market Trends, Drivers, and Restraints; Revenue Estimation and Forecast; Segmentation Analysis; Companies’ Strategic Developments; Market Share Analysis of Key Players; Company Profiling
|
|
Regions Covered in the Report
|
U.K., France, Sweden, Netherlands, Rest of Europe
|
Europe Vertical Farming Market Segmentation
By Offering
In 2025 hardware systems held 57% of the market share because farmers need these systems for controlled environment agriculture and therefore food producers are investing more in LED grow lighting, sensors and climate control equipment to promote farming and uninterrupted food production all year.
Growth is also increasing because a large number of automated agricultural facilities are being used and more energy efficient LED lighting are being developed. More farmers are using environment friendly monitoring systems and higher investments are made in weather-resilient agricultural infrastructure.
Software platforms will grow at 22.1% from 2026 to 2035 which is primarily due to wider acceptance and use of data analytics and farm monitoring software by famers and AI technology to monitor crops.
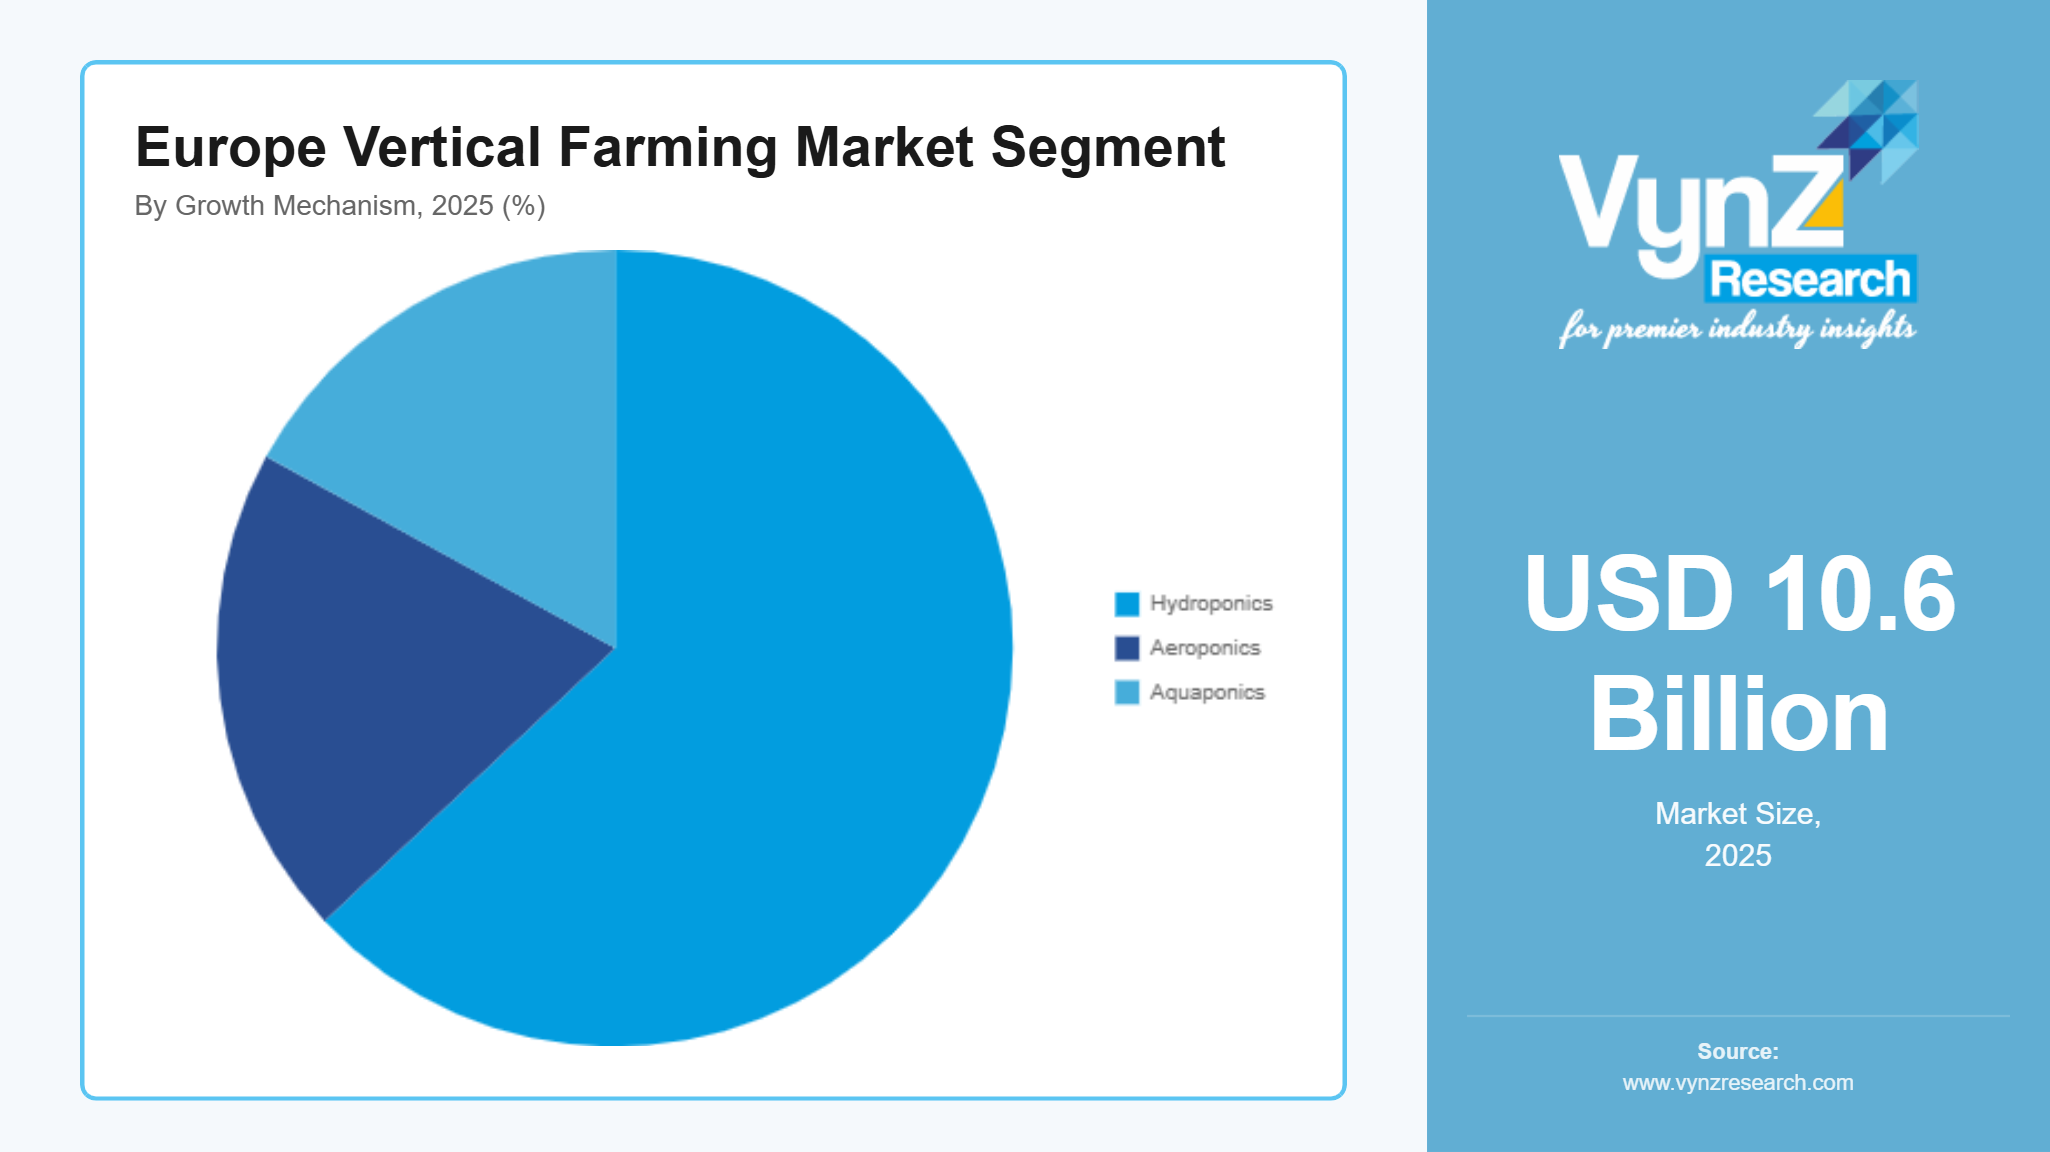
By Growth Mechanism
Hydroponics had 63% of the market share in 2025 and this is mainly attributed to its ability to help with productivity without using excessive water. The Food and Agriculture Organization says that hydroponics can reduce water usage by 90% and more.
Aeroponics will grow at 23% CAGR in the forecast period due to wider adoption and use across Europe to ensure that plants receive proper nutrients directly and more exposure to oxygen to help them grow faster.
By Structure
Indoor warehouse farms contributed roughly 50% share in the market in 2025 since it can be used anywhere and its greater efficiency to control the environment which eventually helps food producers and farmers to achieve food resilience and sustainability.
The shipping segment is expected to grow at 22.4% from 2026 to 2035 due to its efficient modular design, low-cost implementation requirements and quicker deployment abilities.
By Crop Type
In 2025 leafy greens accounted for 62% of the market share because they are easy to grow indoors and do not cost a lot to produce.
Microgreens will grow at 23.3% in the forecast period since consumers want to buy food that is rich in nutrients and look fresh, especially restaurants and hotels that have a huge daily procurement requirement.
Regional Insights
The United Kingdom
The United Kingdom held nearly 28% of the market revenue in 2025 which is due to the wider availability and acceptance of locally produce food. There is also a notable shift towards controlled environment agriculture in the UK and farmers want to produce food throughout the year. This is pushing higher investments in cities like London and Manchester in CEA which is further promoted by the government with its Environmental Improvement Plan 2023.
France
France contributed to about 19% of the market revenue in 2025mainly due to the preference of people to grow food in a controlled environment and promote sustainability. The Ecophyto program of the government is helping farmers with this as it promotes farming techniques that use less fertilizers and water which is useful especially in cities like Paris and Lyon.
Sweden
Sweden accounted for approximately 11% of the market revenue in 2025 subject to its strong sustainability programs and wider objectives to become climate neutral in agriculture with the use of vertical farming in urban regions and cities like Stockholm.
The Netherlands
The Netherlands held about 17% of the market revenue in 2025 mainly characterized by its advanced technology, higher investment in research in agriculture and supportive government policies which is promoting controlled environment agriculture primarily in cities like Amsterdam.
Rest of Europe
The rest of Europe together contributed nearly 25% of the market revenue in 2025 which includes major countries like Germany and Spain due to their extensive urbanization efforts and higher demand for local food endorsing market expansion. The European Union is helping with this through the Common Agricultural Policy and the European Green Deal.
Competitive Landscape / Company Insights
The market is very competitive since companies are working on automation, using AI to improve crops and partnering with farmers and research institutes to innovate. The European Union is helping with this through funding and supportive policies and is giving about 95.5 billion euros to help with research and development. The Common Agricultural Policy is also helping with about 387 billion euros which will further help with the development of controlled environment agriculture in Europe.
Mini Profiles
AeroFarms focuses on advanced indoor vertical farming solutions, supported by strong technological innovation and large scale controlled environment agriculture systems, enabling consistent leafy greens production and high resource efficiency.
Beijing IEDA Protected Horticulture Co. Ltd. operates in large scale commercial greenhouse and protected cultivation segments, emphasizing engineering driven farming systems and integration of advanced horticulture infrastructure across urban agriculture projects.
BrightFarms Inc. focuses on fresh produce greenhouse farming, supported by strong retail distribution partnerships and regional supply chain integration, ensuring consistent supply of locally grown leafy greens to supermarkets.
Gotham Greens operates in premium urban agriculture segments, emphasizing hydroponic greenhouse design, sustainable production methods, and strong retail brand positioning across major metropolitan food markets.
Lufa Farms Inc. focuses on rooftop greenhouse farming solutions, supported by local urban production networks and direct to consumer distribution models, enabling fresh produce supply within city based food ecosystems.
Key Players
AeroFarms
Beijing IEDA Protected Horticulture Co. Ltd.
BrightFarms Inc.
Farmed Here LLC
Gotham Greens
Green Sense Farms
Home Town Farms
Infinite Harvest Inc.
Lufa Farms Inc.
Metropolitan Farms
Recent Developments
In February 2025, AeroFarms expanded its controlled environment agriculture operations through the development of enhanced indoor vertical farming capacity focused on leafy greens production. The initiative strengthened year round output efficiency and supported sustainable urban food supply systems aligned with resource efficient agriculture frameworks.
In June 2025, Infinite Harvest Inc. upgraded its indoor vertical farming infrastructure through the integration of advanced automation and climate control technologies. The enhancement improved operational precision, optimized hydroponic yield performance, and strengthened scalability across controlled environment agriculture facilities.
In September 2025, Farmed Here LLC expanded its distribution partnerships with regional retail and grocery networks to improve access to locally produced fresh greens. The development reinforced supply chain efficiency and supported growing demand for sustainable urban agriculture based food products.
In January 2026, Green Sense Farms implemented AI driven crop monitoring systems across its vertical farming facilities to enhance precision agriculture capabilities. The upgrade improved environmental control accuracy and optimized resource utilization across hydroponic cultivation systems.
In April 2026, Gotham Greens strengthened its urban farming operations through sustainability focused infrastructure enhancements aimed at improving energy efficiency and production consistency. The initiative reinforced its position in controlled environment agriculture and supported long term operational resilience.
