Haptic Technology Market Overview
The Global Haptic Technology Market is projected to experience significant growth, with a predicted market size of USD 10.5 billion by 2030, compared to USD 4.2 billion in 2023. This represents a robust compound annual growth rate (CAGR) of 12.5% throughout the forecast period. Haptic technology enables immersive three-dimensional communication by delivering sensory experiences through pressure, motion, or vibration. It has diverse applications, including the creation of virtual objects, enhancement of control devices, and numerous other uses in the electronics industry. Haptic technology finds extensive utilization in wearables, game controllers, phones, virtual reality, the automotive sector, and various other fields. The market's expansion can be attributed to the increasing integration of technology in consumer electronics products and touch-enabled home appliances. With the assistance of haptic technology's vibration feedback, users can enhance the accuracy of touchscreens, improving their overall user experience.
The adoption of touch screens in devices like media players and home appliances to provide users with a positive experience is propelling the market growth of the haptic technology industry. Haptic Technology Market is also anticipated to grow as consumers seek more gaming technology for better gaming experiences. Since the definition of haptic is "able to contact," technology played a role in the development of the sense of touch. Large aircraft are deploying haptic technology, which is used to give negative feedback when it detects errors. The Haptic Technology identified the error or risk. The market for haptic technology is expanding more quickly and has a wider range of applications.
Haptic Technology Market Industry Trends
The market for haptic technology is expected to increase as a result of the expanding trend of technological integration in augmented reality-enabled devices and gaming consoles. Haptic technology is used in gaming input devices like joysticks and remote consoles to produce various vibration intensities that improve the user experience. One of the main elements driving market demand is the haptics’ capacity to simulate the user's feeling of touch by producing mechanical signals.
The COVID-19 pandemic has led to decline in the growth of haptic technology market owing to disruption in production and supply chain, shut down of government and private sectors, lockdown and social distancing norms, and lack of labor force. This has led to sharp decline in the sales of consumer electronics, touchscreen devices, and automobile industry, thereby affecting the manufacturing process of the haptic technology.
Haptic Technology Market Segmentation
Insight by Component
Software category is anticipated to grow at a high CAGR during the forecast period as it offers various advantages like pre-defined built-in tactile effects and adding features to enhance device performance, thereby propelling segment growth. Furthermore, increased adoption in electronic devices, gaming applications, surgical equipment’s, wearable devices will drive market revenue for haptic technology. To create high-quality haptic interactions, the virtualization software must have performance-oriented features. Due to advancements in consumer electronics technology and an increase in the popularity of haptic-enabled devices, the software category is predicted to expand rapidly over the projection period.
Insight by Feedback Type
- Tactile Feedback
- Force Feedback
The tactile feedback category dominates the global haptic technology market as it offers customers to personalize their messaging alerts and other notifications on smartphones, resulting in positive impact on the haptic technology. Moreover, increased demand from consumers to have a simulating experience while using smartphones and deployment in IoT-enabled devices like wristbands and smart watches will help consumers to keep track of their health, thereby driving the market growth.
Insight by Application
- Healthcare
- Consumer Devices
- Automotive & Transportation
- Commercial & Industrial
- Education & Research
- Others
Consumer devices dominate the haptic technology market owing to rising demand for consumer electronic devices like home appliances, laptops, tablets, smartphones, etc. Haptic technology is highly adopted in gaming consoles like Xbox, PlayStation, etc. as it offers a sense of touch and provides real-time experience, thus acting as a catalyst to market growth. Haptic feedback is used and serves as an important tool in wearable devices such as smartwatches and fitness trackers, allowing for faster operation, longer battery life, and easier-to-use activities. These wearable gadgets use haptics to communicate information and deliver realistic user experiences.
Global Haptic Technology Market Report Coverage
|
Report Metric
|
Details
|
|
Historical Period
|
2020 - 2024
|
|
Base Year Considered
|
2025
|
|
Forecast Period
|
2026 - 2035
|
|
Market Size in 2025
|
U.S.D. 4.2 Billion
|
|
Revenue Forecast in 2035
|
U.S.D. 10.5 Billion
|
|
Growth Rate
|
12.5%
|
|
Segments Covered in the Report
|
By Component, By Feedback Type, and By Application
|
|
Report Scope
|
Market Trends, Drivers, and Restraints; Revenue Estimation and Forecast; Segmentation Analysis; Companies’ Strategic Developments; Market Share Analysis of Key Players; Company Profiling
|
|
Regions Covered in the Report
|
North America, Europe, Asia-Pacific, Middle East, and Rest of the World
|
Industry Dynamics
Haptic Technology Market Growth Drivers
Rising Demand for Smartphones with Simulated User Experiences
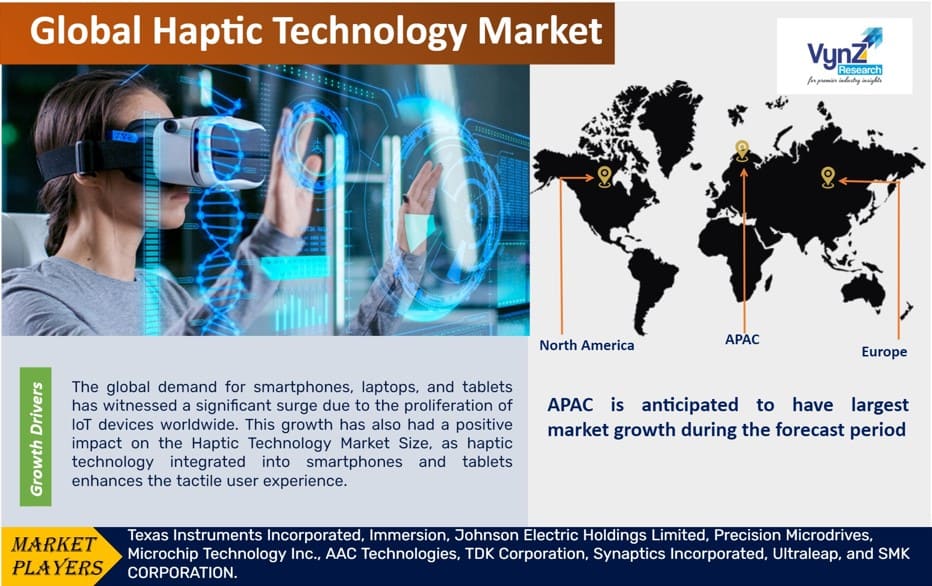
The global demand for smartphones, laptops, and tablets has witnessed a significant surge due to the proliferation of loT devices worldwide. This growth has also had a positive impact on the Haptic Technology Market Size, as haptic technology integrated into smartphones and tablets enhances the tactile user experience. Furthermore, the increasing reliance on electronic gadgets such as smartphones, tablets, digital watches, notepads, headphones, and earphones has fueled the demand for energy-storing devices. According to the Global System for Mobile Communications (GSMA) Association, it is projected that by 2025, there will be approximately 5.9 billion unique customers worldwide. The adoption of haptic technologies in the electronics industry, which offer improved touchscreen, audio, and visual effects in touch applications, is expected to be accelerated.
Moreover, the automobile industry has witnessed notable benefits from the implementation of haptic technology, leading to an increased demand for highly advanced vehicles. These vehicles incorporate top-notch safety measures, cutting-edge technology, and haptic technology features. Consequently, the Haptic Technology Market Trend is on the rise, driven by the growing demand in the automotive sector. Anticipating the positive impact of haptic solutions, numerous institutions and research facilities are upgrading their haptic technologies, which will further propel the demand for haptic technology in the coming years.
Haptic Technology Market Challenges
High Cost of Force Feedback Haptic Devices
The cost of using haptic technology is not prohibitive, but force-feedback haptic devices are more expensive than tactile feedback haptic devices, and this has significantly hampered the market for haptic technology. Force haptic feedback technology is available in 3 DoF, 7 DoF, and 6 DoF, and it provides consumers with a virtual haptic sensation in real-time for a variety of applications. Many industries, including the automotive, medical, aerospace, and other manufacturing businesses, use force-feedback haptic devices. The size of these gadgets makes them problematic for wearable technology.
Furthermore, technological challenge witnessed by the manufacturers that adopts haptic technology in devices like gaming controllers, smartphones, automobile, tablets, etc. Haptic technology enhances user experience and offers user-friendliness to the device. But it becomes difficult for the manufacturers to decide which element will fit in a particular system.
Also, this technology's high switching costs may make it unaffordable for many businesses. This serves as a significant barrier to adoption in several application categories. The use of haptic technology in smartphones and other portable electronics devices is being hampered by power consumption haptic technology-based products.
Haptic Technology Market Opportunities
The increased adoption of haptic technology in education and robotic applications along with rising demand for the holographic display industry will offer lucrative opportunities for haptic technology market growth. Robots can handle a robotic hand and other objects with full control by using haptic technology, such as gloves. The robots can effortlessly manage robotic arms with the aid of haptic technologies. The market is expanding as a result of the expanding use of 3D touchscreen displays in automotive and medical devices.
Haptic Technology Market Geographic Overview
- North America
- Europe
- Asia Pacific (APAC)
- Rest of the World (RoW)
APAC is anticipated to have largest market growth during the forecast period owing to the presence of well-established manufacturers and increased adoption in emerging economies like China and India. Moreover, the robust growth in digitalization and increased penetration of internet-enabled devices, and technological development will accelerate the haptic technology’s market growth. Also, the increased R&D activities, increased need to develop novel applications of haptic technology, the shift in lifestyles, and rising demand for touchscreens to augment consumer experience will propel the region’s market growth forward.
Haptic Technology Market Competitive Insight
The market for haptic technology is fragmented as there are many industry players globally. Some of the manufacturers are MNCs and have production and sales base in several regions. Furthermore, increased investment and R&D activities have led to product innovation and product launches in the haptic technology industry. In addition, the industry players are entering into partnerships, M&A with domestic players so as to expand their geographical base in the merging countries.
Human-machine interfaces are being redefined by haptic technology, which makes them more comfortable, familiar, and natural. Immersion, a well-known haptic leader, continues to innovate as the power of touch has a significant impact on customers and the industry. The haptic technology from Immersion provides the strong APIs, high-quality performance, and simple integration required to produce sophisticated tactile effects across applications and hardware configurations. Through the use of their technology, consumers can have realistic digital touch feedback in mobile, automobile, gaming, etc. They offer a wide range of products for device makers, haptic hardware firms, designers, and developers, including use cases, software, tools, and services.
The plug-and-play haptic module from Ultraleap is a simple solution for integrating virtual touch and upgrading products. The smart approach to quickly advance out-of-home entertainment, advertising, and retail is STRATOS Inspire. This bolt-on module adds touchless haptics to current installations and is designed for quick deployment and public use.
Recent Development by Key Players
Immersion Corporation which a leading developer and provider of patents for haptics has renewed a license with Samsung Electronics Co. to continue to make Immersion’s patents available to Samsung and its affiliates.
TDK Corporation presents two new varistor series in SMD design. The types of both series are available for a wide range of operating voltages from 175 VRMS to 460 VRMS, corresponding to 225 VDC to 615 VDC. While the B72210M* series of surge devices, which are equivalent to S14 leaded disk varistors, offers a surge current capability of 6000 A, the B72214M* series types, which are equivalent to S20 leaded disk varistors, have a high surge current capability of 10,000 A. These types are designed for a high operating temperature of a maximum of +125 °C and extremely damp heat environment (85% relative humidity at +85 °C).
Key Players Covered in the Report
Some of the prominent players in the Haptic Technology Industry include Texas Instruments Incorporated, Immersion, Johnson Electric Holdings Limited, Precision Microdrives, Microchip Technology Inc., AAC Technologies, TDK Corporation, Synaptics Incorporated, Ultraleap, and SMK CORPORATION.
The Haptic Technology Market research includes a comprehensive market segmentation analysis as well as projections for the analysis period 2025-2030.
Segments Covered in the Report
- By Component
- By Feedback Type
- Tactile Feedback
- Force Feedback
- By Application
- Healthcare
- Consumer Devices
- Automotive & Transportation
- Commercial & Industrial
- Education & Research
- Others
Region Covered in the Report
- North America
- Europe
- Germany
- U.K.
- France
- Italy
- Spain
- Russia
- Rest of Europe
- Asia-Pacific (APAC)
- China
- Japan
- India
- South Korea
- Rest of Asia-Pacific
Rest of the World (RoW)
- Brazil
- Saudi Arabia
- South Africa
- U.A.E.
- Other Countries
.png "Haptic Technology Market Size and Market Analysis")
To explore more about this report - Request a free sample copy
