Rugged Sensor Market Size & Share - Growth Forecast Report (2026-2035)
Industry Insight by Type (Temperature Sensor, Pressure sensor, Vibration sensor, Humidity sensor, Proximity Sensor, Photoelectric Sensors, Environmental Sensors, Others), by Application (Fault detection, Tracking, Hazard alerts for leaks, objects, moisture, Non-contact sensing, Battery monitoring, Avionics andUAV reliability, Weather and soil monitoring, Pipeline/compressor integrity), by Industry (Automotive, Oil & Gas, Manufacturing/Industrial IoT, Aerospace/Defense, Mining, Food Processing, Marine, Agriculture, Chemicals), by Technology (MEMS, CMOS, Fiber-Optic, Piezoresistive), by Price Range (Under 100, Range 100-300, Range 300-500, Above 500)
| Status : Published | Published On : Feb, 2026 | Report Code : VRSME9204 | Industry : Semiconductor & Electronics | Available Format :
|
Page : 187 |
Rugged Sensor Market Overview
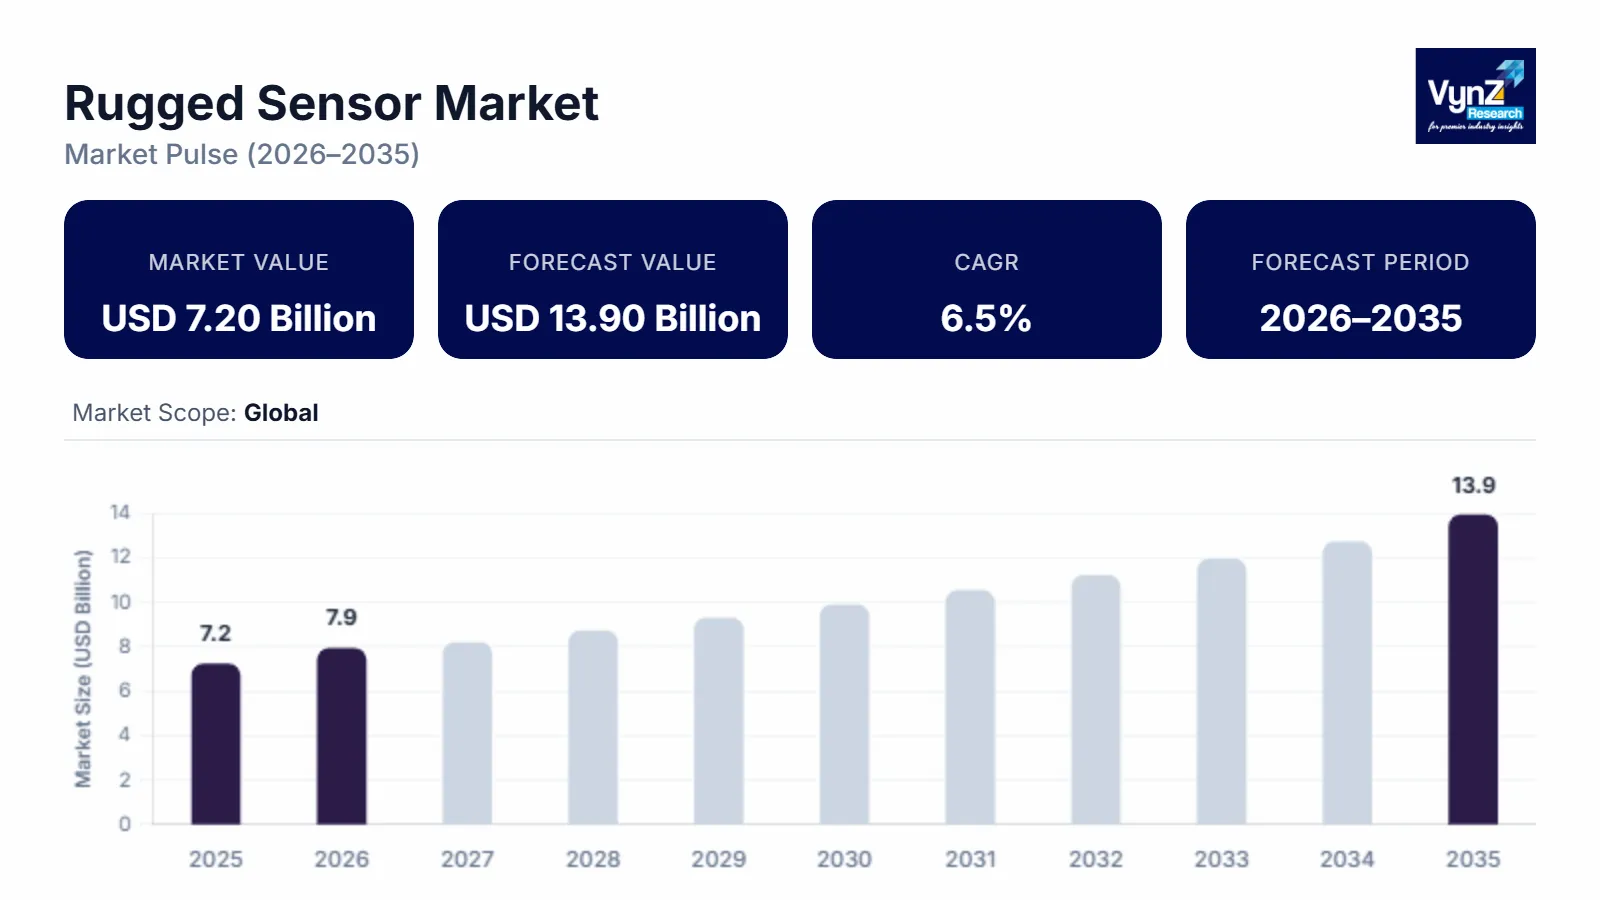
The global rugged sensor market which was valued at approximately USD 7.20 billion in 2025 and is estimated to reach around USD 7.90 billion in 2026, is projected to reach approximately USD 13.90 billion by 2035, expanding at a CAGR of about 6.5% during the forecast period from 2026 to 2035.
Growing industrial automation in manufacturing industries, implementation of advanced sensing gadgets in aerospace and defense sectors and rising demand for reliable monitoring systems pushes the growth of the market. Additionally, steady growth of IoT framework and architecture, smart infrastructure and government-led programs for modernization and digital revolution influences market expansion.
The International Energy Agency states that there is a steady rise in investment in renewable energy and grid resilience systems, both needing advanced sensing technology to endure extreme, temperature, vibration and pressure environments. Stockholm International Peace Research Institute and other similar agencies report that there will be an increase in defense expenditure with solid data that show growing demand and higher spending in rugged sensing systems and electronic components, especially in the naval and aerospace sectors for various operations.
Public infrastructure development programs, smart transportation systems, and revamped manufacturing policies of countries like the United States, Germany, China, and Japan also indicate higher adoption of such technologies. This supports the worldwide safety regulations as implemented by the International Organization for Standardization for hospitals and industrial environments, pushing the rugged sensor market further especially in North America, Europe, and Asia Pacific.
Rugged Sensor Market Dynamics
Market Trends
The industry is moving steadily towards connected and smarter systems that can work in harsh settings. Government-led programs such as Industry 4.0 and smart manufacturing efforts in Germany and the US respectively, are promoting predictive maintenance and automation, which require real-time monitoring. Reliable sensors are required to track and maintain equipment health and uplift safety in extreme conditions.
Rise in renewable energy and grid modernization is also noticed due to the expansion of smart grids, solar farms, and wind projects. These need to maintain their structural integrity irrespective of temperature and vibration variance. Shock resistant and rugged sensors are also adopted largely for intelligent traffic and rail transportation.
Growth Drivers
Market growth is largely tied with higher need for better energy infrastructure, industrial automation, defense modernization and aerospace upgrades. Defense budget across the globe support acquiring such sensors and equipment that can operate in rugged conditions especially for surveillance, naval systems, aircraft and military vehicles.
Energy evolution is another major growth driver of the market due to rising funding in renewable energy plants, oil and gas sectors, and smart grids. These systems are also needed at large to support digital manufacturing policies and smart factory systems in the U.S., China, Europe, and Japan.
Market Restraints / Challenges
Stringent regulatory standards and high cost of development and equipment are a few significant growth challenges faced by the market. Strict certifications are needed by defense, aerospace, and hazardous industries which increase cost and results in downtime, presenting an entry barrier for smaller companies.
There is risk of supply chain disruptions causing delay in delivery and price volatility due to higher reliance on special materials and semiconductors. Also, limited engineering knowledge in sophisticated microelectronics in developing countries limit emerging economies from entering the market.
Market Opportunities
Higher investments in renewable and clean energy, rapid transportation transition to smart systems, and greater automation in manufacturing industries pose significant growth opportunities to the market.
Additionally, growing investment in smart city programs in developing countries and infrastructural development in transportation, rail network, bridges and tunnels offer growth prospects. Edge computing, wireless connectivity, and AI-based diagnostics are also on the rise presenting growth opportunities.
Global Rugged Sensor Market Report Coverage
|
Report Metric |
Details |
|
Historical Period |
2020 - 2024 |
|
Base Year Considered |
2025 |
|
Forecast Period |
2026 - 2035 |
|
Market Size in 2025 |
USD 7.20 Billion |
|
Revenue Forecast in 2035 |
USD 13.90 Billion |
|
Growth Rate |
6.5% |
|
Segments Covered in the Report |
Type, Technology, Price Range, Application, End User |
|
Report Scope |
Market Trends, Drivers, and Restraints; Revenue Estimation and Forecast; Segmentation Analysis; Companies’ Strategic Developments; Market Share Analysis of Key Players; Company Profiling |
|
Regions Covered in the Report |
North America, Europe, Asia Pacific, Rest of the World |
|
Key Companies |
Amphenol Advanced Sensors, Bosch Sensortec, Emerson Electric Co., Honeywell International Inc., Kistler Group, Meggitt PLC (Parker-Hannifin Corporation), Omega Engineering Inc., PCB Piezotronics Inc., Sensata Technologies Holding plc, TE Connectivity Ltd |
|
Customization |
Available upon request |
Rugged Sensor Market Segmentation
By Type
The market in 2025 saw accelerometer technology generate the highest percentage of total revenue, which reached a market share of almost 28%. The technology leads the market because it has been used extensively in aerospace and defense vehicles, industrial machinery and transportation systems, which require vibration and motion detection to ensure operational safety. The trend toward predictive maintenance system implementation in manufacturing facilities, which has been growing steadily, has resulted in increased demand for accelerometer-based monitoring solutions that see annual growth of 8.1%. The combination of government industrial automation initiatives and transportation safety programs is driving market adoption in developed countries.
The market for pressure sensors will experience rapid growth between 2026 and 2035, with an estimated compound annual growth rate of 7.9%. The market expansion occurs because the oil and gas exploration industry, renewable energy infrastructure sector and hydraulic system market require advanced measurement solutions that can endure harsh conditions.
The demand for pressure sensors grows by 7.4% in emerging economies because of increased investment in energy transition initiatives and infrastructure modernization programs.
Temperature and humidity sensors experience steady growth of approximately 6.8% because these systems are used in both environmental monitoring and climate-adaptive infrastructure development.
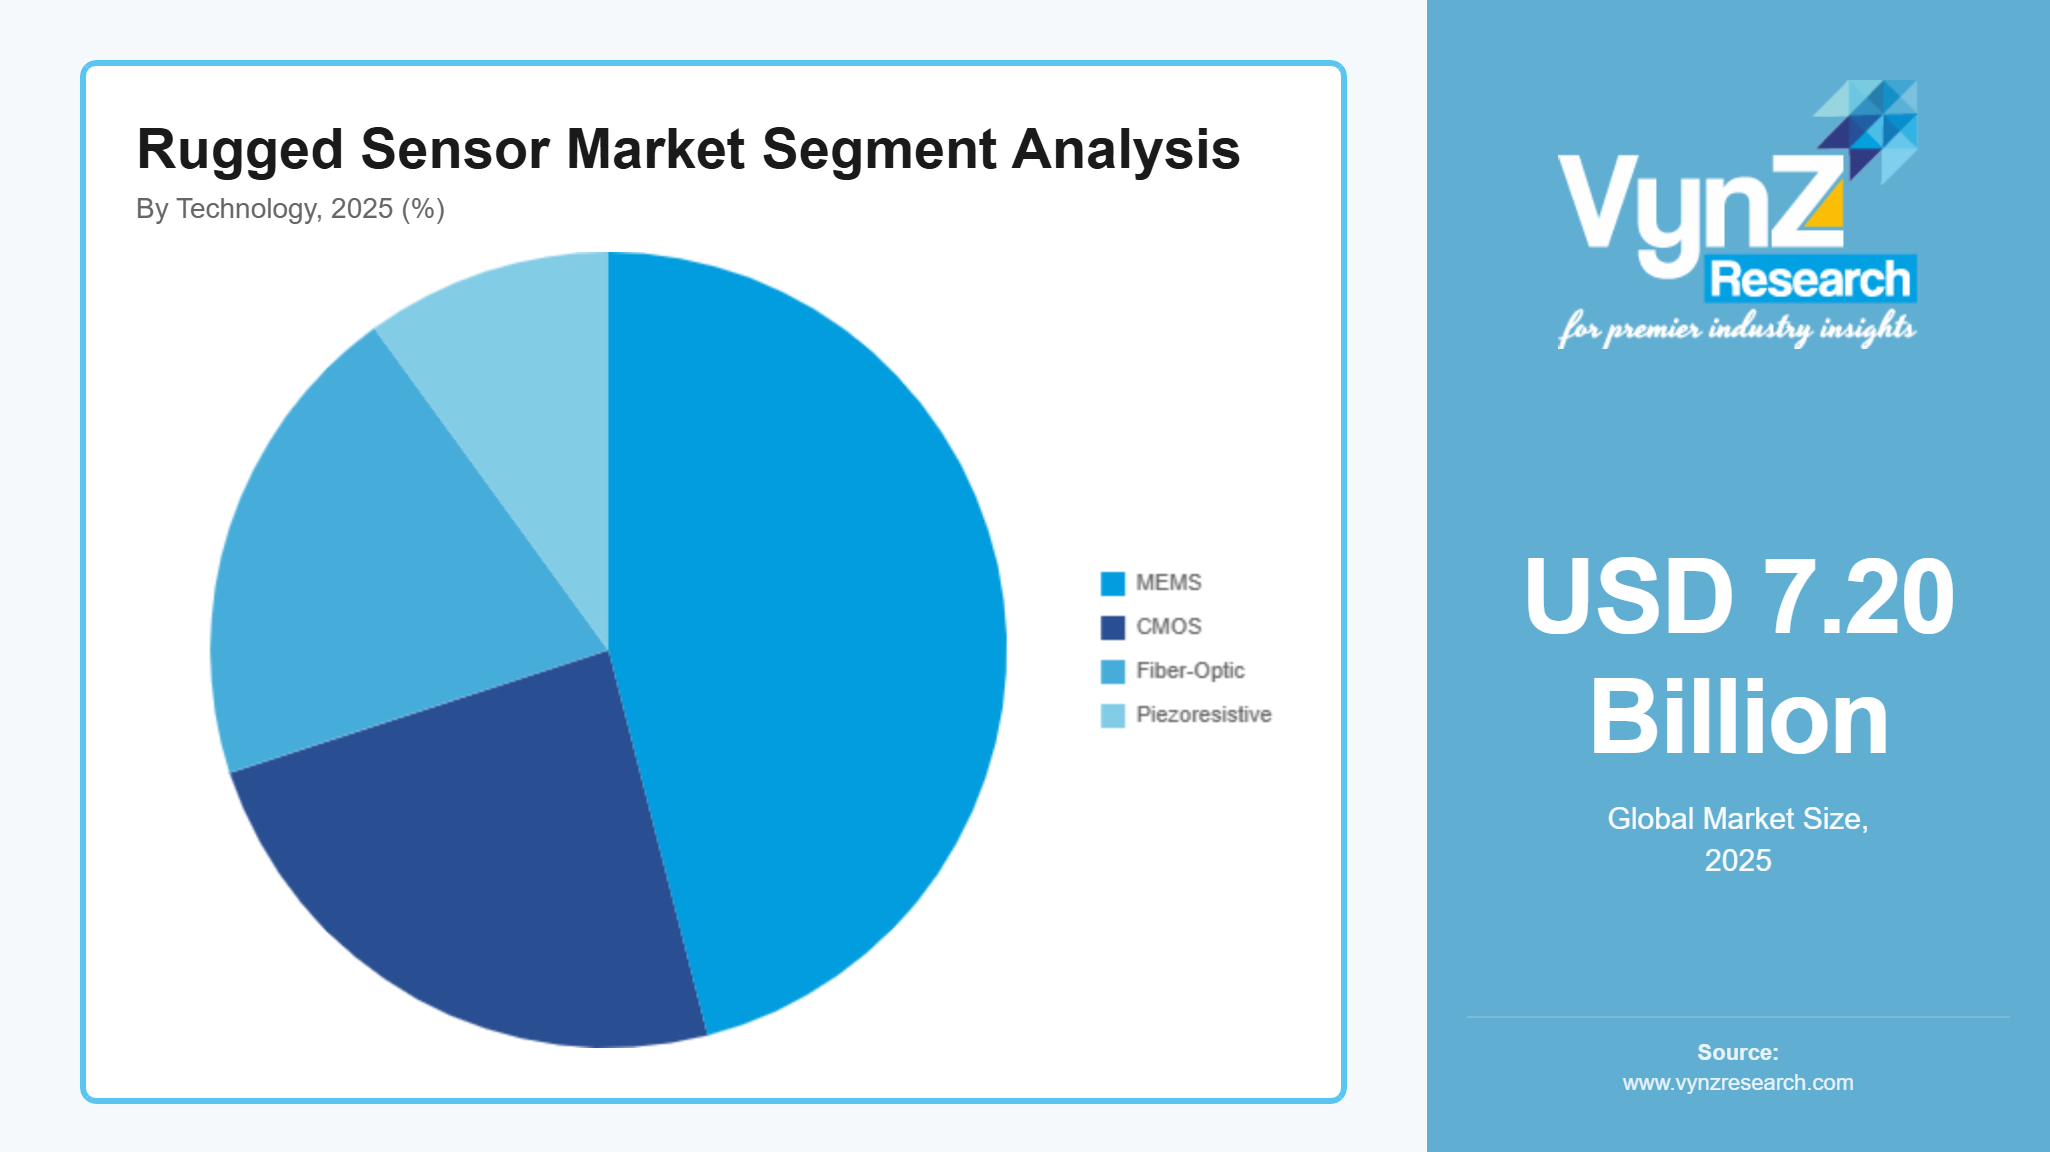
By Technology
MEMS-based rugged sensors held the largest market share in 2025, accounting for nearly 46% of segment revenue. The product has gained popularity because it combines small dimensions with low production costs and works with digital monitoring systems. MEMS technology adoption in automotive safety systems, industrial robotics and aerospace navigation systems has resulted in segment growth of 8.3%. MEMS sensors have established themselves in smart manufacturing and defense modernization programs because of their ability to scale up and connect to IoT systems.
Optical and fiber-optic sensing technologies are projected to grow at the fastest pace, registering a CAGR of 8.5% from 2026 to 2035. The market expansion occurs because the technology has been increasingly implemented in structural health monitoring systems, high-voltage environments and energy transmission networks.
Fiber-optic sensors are witnessing adoption growth of nearly 7.8% in energy and utilities due to their resistance to electromagnetic interference and suitability for harsh operating conditions. The industry now uses advanced signal processing together with remote monitoring features to implement these new systems across infrastructure and transportation networks.
By Price Range
High-end sensors above 500 USD captured 29% of the market in 2025 and are expected to expand at a 7.1% CAGR. These devices are engineered for extreme conditions in aerospace, defense, and specialized industrial sectors, offering multi-parameter monitoring, long-term reliability, and performance under severe vibration, high pressure, and extreme temperatures.
Rugged sensors priced under 100 USD are the key choice for entry-level monitoring and low-stress industrial applications. These sensors maintain steady growth of around 5.8% CAGR due to their affordability and suitability for educational labs, small-scale manufacturing, and basic automation systems.
Sensors in the 100 to 300 USD range are required and driven by higher accuracy and moderate environmental resilience. This segment is projected to grow at a 6.2% CAGR as mid-sized industrial operations increasingly adopt reliable monitoring systems capable of tolerating heat, moisture, and vibration.
The 300 to 500 USD registered a growth rate of 6.7% CAGR. Sensors in this tier combine advanced features such as industrial IoT integration, high-precision measurements, and multi-environment durability, making them ideal for smart factories, predictive maintenance, and commercial transportation systems.
By Application
The revenue breakdown for 2025 shows that condition monitoring generated the highest revenue share at 34% of total earnings. The manufacturing and energy sectors maintain steady demand because they prioritize equipment reliability while implementing predictive maintenance protocols. Smart factories that implement automated diagnostic systems together with performance tracking systems experience an adoption growth rate of 8.2%. The ongoing infrastructure modernization projects, combined with industrial automation investments, lead to sustained market dominance for this particular sector.
Structural health monitoring will experience the highest growth rate between 2026 and 2035 with a compound annual growth rate of 8.8%.
The adoption rate for bridge safety, railway systems, tunnel construction and smart city projects has reached approximately 8.5% because these sectors have boosted their spending.
Environmental and weather monitoring applications are expanding steadily at nearly 7.0%, supported by climate adaptation initiatives and disaster preparedness programs.
By End User
Industrial manufacturing represented the largest segment of the rugged sensor market in 2025, which generated 38% of total market revenue. The market segment is expanding due to the rise of automated production facilities, robots and predictive maintenance systems. Rugged sensing systems remain essential for heavy machinery and mining and process industries to maintain operations, even in demanding work environments.
Defense and aerospace are expected to witness the fastest growth, registering a CAGR of 8.9% during 2026 to 2035. Rising modernization programs, advanced surveillance systems, and unmanned platforms are contributing to adoption growth of nearly 8.6%.
Energy and power utilities are also experiencing steady expansion of approximately 7.5%, supported by renewable energy projects and smart grid deployments. Transportation and automotive sectors continue to strengthen overall demand, ensuring balanced and sustained market growth across major end-user industries.
Regional Insights
North America
The market in 2025 will receive 32% of its total revenues from North America. The United States and Canada experience regional expansion because defense spending, industrial automation and advanced aerospace manufacturing continue to develop. The U.S. Department of Defense and the National Aeronautics and Space Administration maintain their commitment to resilient sensing technologies for mission critical systems, structural assessments and extreme environment operations.
The three major industrial centers of Texas, California and Ontario show steady installation of rugged sensing systems in their oil and gas and transportation and heavy equipment manufacturing sectors. The U.S. Department of Energy and the National Institute of Standards and Technology back infrastructure programs and smart manufacturing initiatives that push companies to adopt industrial IoT and predictive maintenance technologies. The programs demand sensing components with high durability that function in extreme conditions of vibration and pressure and temperature.
Europe
Europe contributes approximately 23% of the market in 2025. The region expands its market by developing advanced automotive engineering, expanding renewable energy and implementing industrial safety rules that match European Commission regulations and national regulations. The three countries Germany, France and the United Kingdom build their Industry 4.0 transformation programs around trustworthy and highly accurate sensing systems that support both manufacturing automation and structural health monitoring.
The European Environment Agency and regional energy authorities show rising wind energy investments and grid modernization projects, which require rugged pressure sensors and vibration sensors and temperature sensors for their operational performance. Government funded research and innovation programs enable deployment across rail networks and aerospace platforms and energy infrastructure, which leads to sustained market growth.
Asia Pacific
Asia Pacific provided 21% of the market share in 2025. The four nations namely China, India, Japan and South Korea experience market expansion because they modernize their infrastructures and build their defense capabilities while their industrial sectors undergo rapid growth. The national manufacturing initiatives and smart factory policies from industry and technology ministries drive industrial automation and predictive monitoring system adoption. The cities of Shanghai, Tokyo, Seoul and Mumbai currently experience a growing trend to implement rugged sensors in their heavy machinery and mining operations and transportation systems.
The government infrastructure development programs and regional energy authority renewable energy targets drive demand for robust sensing solutions which need to endure extreme environmental conditions. The region maintains its performance because rail electrification, metro systems, power grid expansion receive increased financial support.
Rest of the World
The Rest of the World market includes Latin America, the Middle East and Africa, which together account for 18% of total market share in 2025. Energy exploration activities, mining operations, industrial diversification support economic growth throughout these regions. National oil companies and infrastructure ministries in Brazil, Saudi Arabia and South Africa are installing monitoring systems to enhance operational safety and efficiency in demanding work environments.
Public infrastructure modernization programs and energy sector investments are driving the use of rugged sensing technologies though their market adoption remains at a low level. The market share distribution beyond North America, Europe, Asia Pacific countries and the Rest of the World category is allocated to smaller emerging economies which do not receive individual market recognition thus maintaining a regional distribution that keeps global market share within balanced limits.
Competitive Landscape / Company Insights
The market experiences a range of competition from moderate to high because both global players and regional competitors concentrate their efforts on developing new products while using different pricing tactics and exploring new market territories. Key vendors invest in building advanced sensing technologies which include miniaturization systems and industrial Internet of Things solutions to develop products that withstand extreme operational conditions. The U.S. National Institute of Standards and Technology supports smart manufacturing initiatives and government defense modernization programs work together with European and Asian Pacific infrastructure digitization strategies to help companies build their technological capabilities while growing their industrial operations.
Mini Profiles
Amphenol Advanced Sensors develops high-performance pressure, temperature and gas sensing products which receive international distribution support through its engineering capabilities and partnerships with various industries in aerospace automotive and extreme environment sectors.
Bosch Sensortec produces sensing products for high-end and entry-level markets through its development of smaller products which use MEMS technology to create energy-efficient systems that receive support from their strong automotive, industrial and smart infrastructure platform brand recognition.
Emerson Electric Co. establishes market presence through strategic partnerships and digital industrial platforms by providing rugged sensing technologies that combine with automation systems to improve predictive maintenance, operational efficiency and industrial safety compliance.
Honeywell International Inc. develops advanced sensing and monitoring technologies for aerospace and defense applications backed by its global brand strength and its extensive R&D capabilities and its diverse solutions which operate in extreme conditions.
Kistler Group operates in niche high-precision sensing segments which focus on achieving measurement accuracy while building durable products through its engineering expertise, its ability to create customized industrial solutions and its strong ties to automotive testing and structural monitoring markets.
Key Players
The following companies are key participants in the global rugged sensor market, engaged in industrial and harsh-environment sensing technologies.
- Amphenol Advanced Sensors
- Bosch Sensortec
- Emerson Electric Co.
- Honeywell International Inc.
- Kistler Group
- Meggitt PLC (Parker-Hannifin Corporation)
- Omega Engineering Inc.
- PCB Piezotronics Inc.
- Sensata Technologies Holding plc
- TE Connectivity Ltd.
Global Rugged Sensor Market Coverage
Type Insight and Forecast 2026 - 2035
- Temperature Sensor
- Pressure sensor
- Vibration sensor
- Humidity sensor
- Proximity Sensor
- Photoelectric Sensors
- Environmental Sensors
- Others
Application Insight and Forecast 2026 - 2035
- Fault detection
- Tracking
- Hazard alerts for leaks
- objects
- moisture
- Non-contact sensing
- Battery monitoring
- Avionics andUAV reliability
- Weather and soil monitoring
- Pipeline/compressor integrity
Industry Insight and Forecast 2026 - 2035
- Automotive
- Oil & Gas
- Manufacturing/Industrial IoT
- Aerospace/Defense
- Mining
- Food Processing
- Marine
- Agriculture
- Chemicals
Technology Insight and Forecast 2026 - 2035
- MEMS
- CMOS
- Fiber-Optic
- Piezoresistive
Price Range Insight and Forecast 2026 - 2035
- Under 100
- Range 100-300
- Range 300-500
- Above 500
Global Rugged Sensor Market by Region
- North America
- By Type
- By Application
- By Industry
- By Technology
- By Price Range
- By Country - U.S., Canada, Mexico
- Europe
- By Type
- By Application
- By Industry
- By Technology
- By Price Range
- By Country - Germany, U.K., France, Italy, Spain, Russia, Rest of Europe
- Asia-Pacific (APAC)
- By Type
- By Application
- By Industry
- By Technology
- By Price Range
- By Country - China, Japan, India, South Korea, Vietnam, Thailand, Malaysia, Rest of Asia-Pacific
- Rest of the World (RoW)
- By Type
- By Application
- By Industry
- By Technology
- By Price Range
- By Country - Brazil, Saudi Arabia, South Africa, U.A.E., Other Countries
Table of Contents for Rugged Sensor Market Report
1. Research Overview
1.1. The Report Offers
1.2. Market Coverage
1.2.1. By
Type
1.2.2. By
Application
1.2.3. By
Industry
1.2.4. By
Technology
1.2.5. By
Price Range
1.3. Research Phases
1.4. Limitations
1.5. Market Methodology
1.5.1. Data Sources
1.5.1.1.
Primary Research
1.5.1.2.
Secondary Research
1.5.2. Methodology
1.5.2.1.
Data Exploration
1.5.2.2.
Forecast Parameters
1.5.2.3.
Data Validation
1.5.2.4.
Assumptions
1.5.3. Study Period & Data Reporting Unit
2. Executive Summary
3. Industry Overview
3.1. Industry Dynamics
3.1.1. Market Growth Drivers
3.1.2. Market Restraints
3.1.3. Key Market Trends
3.1.4. Major Opportunities
3.2. Industry Ecosystem
3.2.1. Porter’s Five Forces Analysis
3.2.2. Recent Development Analysis
3.2.3. Value Chain Analysis
3.3. Competitive Insight
3.3.1. Competitive Position of Industry
Players
3.3.2. Market Attractive Analysis
3.3.3. Market Share Analysis
4. Global Market Estimate and Forecast
4.1. Global Market Overview
4.2. Global Market Estimate and Forecast to 2035
5. Market Segmentation Estimate and Forecast
5.1. By Type
5.1.1. Temperature Sensor
5.1.1.1. Market Definition
5.1.1.2. Market Estimation and Forecast to 2035
5.1.2. Pressure sensor
5.1.2.1. Market Definition
5.1.2.2. Market Estimation and Forecast to 2035
5.1.3. Vibration sensor
5.1.3.1. Market Definition
5.1.3.2. Market Estimation and Forecast to 2035
5.1.4. Humidity sensor
5.1.4.1. Market Definition
5.1.4.2. Market Estimation and Forecast to 2035
5.1.5. Proximity Sensor
5.1.5.1. Market Definition
5.1.5.2. Market Estimation and Forecast to 2035
5.1.6. Photoelectric Sensors
5.1.6.1. Market Definition
5.1.6.2. Market Estimation and Forecast to 2035
5.1.7. Environmental Sensors
5.1.7.1. Market Definition
5.1.7.2. Market Estimation and Forecast to 2035
5.1.8. Others
5.1.8.1. Market Definition
5.1.8.2. Market Estimation and Forecast to 2035
5.2. By Application
5.2.1. Fault detection
5.2.1.1. Market Definition
5.2.1.2. Market Estimation and Forecast to 2035
5.2.2. Tracking
5.2.2.1. Market Definition
5.2.2.2. Market Estimation and Forecast to 2035
5.2.3. Hazard alerts for leaks
5.2.3.1. Market Definition
5.2.3.2. Market Estimation and Forecast to 2035
5.2.4. objects
5.2.4.1. Market Definition
5.2.4.2. Market Estimation and Forecast to 2035
5.2.5. moisture
5.2.5.1. Market Definition
5.2.5.2. Market Estimation and Forecast to 2035
5.2.6. Non-contact sensing
5.2.6.1. Market Definition
5.2.6.2. Market Estimation and Forecast to 2035
5.2.7. Battery monitoring
5.2.7.1. Market Definition
5.2.7.2. Market Estimation and Forecast to 2035
5.2.8. Avionics andUAV reliability
5.2.8.1. Market Definition
5.2.8.2. Market Estimation and Forecast to 2035
5.2.9. Weather and soil monitoring
5.2.9.1. Market Definition
5.2.9.2. Market Estimation and Forecast to 2035
5.2.10. Pipeline/compressor integrity
5.2.10.1. Market Definition
5.2.10.2. Market Estimation and Forecast to 2035
5.3. By Industry
5.3.1. Automotive
5.3.1.1. Market Definition
5.3.1.2. Market Estimation and Forecast to 2035
5.3.2. Oil & Gas
5.3.2.1. Market Definition
5.3.2.2. Market Estimation and Forecast to 2035
5.3.3. Manufacturing/Industrial IoT
5.3.3.1. Market Definition
5.3.3.2. Market Estimation and Forecast to 2035
5.3.4. Aerospace/Defense
5.3.4.1. Market Definition
5.3.4.2. Market Estimation and Forecast to 2035
5.3.5. Mining
5.3.5.1. Market Definition
5.3.5.2. Market Estimation and Forecast to 2035
5.3.6. Food Processing
5.3.6.1. Market Definition
5.3.6.2. Market Estimation and Forecast to 2035
5.3.7. Marine
5.3.7.1. Market Definition
5.3.7.2. Market Estimation and Forecast to 2035
5.3.8. Agriculture
5.3.8.1. Market Definition
5.3.8.2. Market Estimation and Forecast to 2035
5.3.9. Chemicals
5.3.9.1. Market Definition
5.3.9.2. Market Estimation and Forecast to 2035
5.4. By Technology
5.4.1. MEMS
5.4.1.1. Market Definition
5.4.1.2. Market Estimation and Forecast to 2035
5.4.2. CMOS
5.4.2.1. Market Definition
5.4.2.2. Market Estimation and Forecast to 2035
5.4.3. Fiber-Optic
5.4.3.1. Market Definition
5.4.3.2. Market Estimation and Forecast to 2035
5.4.4. Piezoresistive
5.4.4.1. Market Definition
5.4.4.2. Market Estimation and Forecast to 2035
5.5. By Price Range
5.5.1. Under 100
5.5.1.1. Market Definition
5.5.1.2. Market Estimation and Forecast to 2035
5.5.2. Range 100-300
5.5.2.1. Market Definition
5.5.2.2. Market Estimation and Forecast to 2035
5.5.3. Range 300-500
5.5.3.1. Market Definition
5.5.3.2. Market Estimation and Forecast to 2035
5.5.4. Above 500
5.5.4.1. Market Definition
5.5.4.2. Market Estimation and Forecast to 2035
6. North America Market Estimate and Forecast
6.1. By
Type
6.2. By
Application
6.3. By
Industry
6.4. By
Technology
6.5. By
Price Range
6.5.1.
U.S. Market Estimate and Forecast
6.5.2.
Canada Market Estimate and Forecast
6.5.3.
Mexico Market Estimate and Forecast
7. Europe Market Estimate and Forecast
7.1. By
Type
7.2. By
Application
7.3. By
Industry
7.4. By
Technology
7.5. By
Price Range
7.5.1.
Germany Market Estimate and Forecast
7.5.2.
France Market Estimate and Forecast
7.5.3.
U.K. Market Estimate and Forecast
7.5.4.
Italy Market Estimate and Forecast
7.5.5.
Spain Market Estimate and Forecast
7.5.6.
Russia Market Estimate and Forecast
7.5.7.
Rest of Europe Market Estimate and Forecast
8. Asia-Pacific (APAC) Market Estimate and Forecast
8.1. By
Type
8.2. By
Application
8.3. By
Industry
8.4. By
Technology
8.5. By
Price Range
8.5.1.
China Market Estimate and Forecast
8.5.2.
Japan Market Estimate and Forecast
8.5.3.
India Market Estimate and Forecast
8.5.4.
South Korea Market Estimate and Forecast
8.5.5.
Rest of Asia-Pacific Market Estimate and Forecast
9. Rest of the World (RoW) Market Estimate and Forecast
9.1. By
Type
9.2. By
Application
9.3. By
Industry
9.4. By
Technology
9.5. By
Price Range
9.5.1.
Brazil Market Estimate and Forecast
9.5.2.
Saudi Arabia Market Estimate and Forecast
9.5.3.
South Africa Market Estimate and Forecast
9.5.4.
U.A.E. Market Estimate and Forecast
9.5.5.
Other Countries Market Estimate and Forecast
10. Company Profiles
10.1.
Amphenol Advanced Sensors
10.1.1.
Snapshot
10.1.2.
Overview
10.1.3.
Offerings
10.1.4.
Financial
Insight
10.1.5.
Recent
Developments
10.2.
Bosch Sensortec
10.2.1.
Snapshot
10.2.2.
Overview
10.2.3.
Offerings
10.2.4.
Financial
Insight
10.2.5.
Recent
Developments
10.3.
Emerson Electric Co.
10.3.1.
Snapshot
10.3.2.
Overview
10.3.3.
Offerings
10.3.4.
Financial
Insight
10.3.5.
Recent
Developments
10.4.
Honeywell International Inc.
10.4.1.
Snapshot
10.4.2.
Overview
10.4.3.
Offerings
10.4.4.
Financial
Insight
10.4.5.
Recent
Developments
10.5.
Kistler Group
10.5.1.
Snapshot
10.5.2.
Overview
10.5.3.
Offerings
10.5.4.
Financial
Insight
10.5.5.
Recent
Developments
10.6.
Meggitt PLC (Parker-Hannifin Corporation)
10.6.1.
Snapshot
10.6.2.
Overview
10.6.3.
Offerings
10.6.4.
Financial
Insight
10.6.5.
Recent
Developments
10.7.
Omega Engineering Inc.
10.7.1.
Snapshot
10.7.2.
Overview
10.7.3.
Offerings
10.7.4.
Financial
Insight
10.7.5.
Recent
Developments
10.8.
PCB Piezotronics Inc.
10.8.1.
Snapshot
10.8.2.
Overview
10.8.3.
Offerings
10.8.4.
Financial
Insight
10.8.5.
Recent
Developments
10.9.
Sensata Technologies Holding plc
10.9.1.
Snapshot
10.9.2.
Overview
10.9.3.
Offerings
10.9.4.
Financial
Insight
10.9.5.
Recent
Developments
10.10.
TE Connectivity Ltd.
10.10.1.
Snapshot
10.10.2.
Overview
10.10.3.
Offerings
10.10.4.
Financial
Insight
10.10.5.
Recent
Developments
11. Appendix
11.1. Exchange Rates
11.2. Abbreviations
Note: Financial insight and recent developments of different companies are subject to the availability of information in the secondary domain.
Frequently Asked Questions
Purchase Options
Latest Report
Research Methodology
- Desk Research / Pilot Interviews
- Build Market Size Model
- Research and Analysis
- Final Deliverable
Connect With Our Sales Team
- Toll-Free: +1-888-253-3960
- Phone: +91 9960 288 381
- Email: enquiry@vynzresearch.com
Rugged Sensor Market