| Status : Published | Published On : Jan, 2024 | Report Code : VRSME9082 | Industry : Semiconductor & Electronics | Available Format :
|
Page : 275 |
The Global Semiconductor IP Market reached USD 6.3 billion in 2023 and is projected to grow to USD 9.8 billion by 2030, with a compound annual growth rate (CAGR) of 5.4% from 2025 to 2030.
![]()
Semiconductor intellectual property signifies the unique procedures, designs, and technologies used in manufacturing semiconductors. The categories typically include copyrights, patents, and trade secrets. These are specifically designed to protect innovations in the design process and fabrication of chips and their testing. Semiconductor IP is typically associated with processors, interconnects, memory, and other peripherals and plays a vital role in the development of electronic devices. In a way, it facilitates effective communication and computation along with process automation. Businesses invest a large amount in protecting IP to stay competitive and maintain technological development initiatives.
The global semiconductor IP market is divided by design IP into processor IP, memory IP, interface IP, and other segments. Out of all these segments, the memory IP is expected to dominate and grow at a higher CAGR during the forecast period due to growth in social networking content and media streaming that propels the demand for local storage and data centers. It is also attributed to the extensive use of different types of memory ICs, such as random-access memory, flash memory, erasable programming memory, and programmable read-only memory.
According to the IP core, the global semiconductor IP market is divided into soft-core and hard-core segments. Among these two segments, the soft-core segment is expected to grow at a higher rate during the forecast period due to affordability, easy implementation, and widespread use across different industries.
The global semiconductor IP market is also divided by different IP sources into royalty and licensing segments, where the former is expected to contribute a larger share to the market due to significant tech development allowing the manufacturers to produce products they wish and pay royalty exclusively for them.
According to the different end users, the global semiconductor IP market is divided into consumer electronics, telecom & data centers, automotive, commercial, industrial, aerospace & defense, and other segments. Out of these segments, the consumer electronics segment is poised to grow at a higher CAGR during the forecast period due to progress in multicore technology, extensive use of consumer electronic products, growing demand for SoC designs, and reducing the cost of chip design.
|
Report Metric |
Details |
|
Historical Period |
2020 - 2024 |
|
Base Year Considered |
2025 |
|
Forecast Period |
2026 - 2035 |
|
Market Size in 2025 |
U.S.D. 6.3 Billion |
|
Revenue Forecast in 2035 |
U.S.D. 9.8 Billion |
|
Growth Rate |
5.4% |
|
Segments Covered in the Report |
By Design IP, By IP Core, By IP Source, and By End User. |
|
Report Scope |
Market Trends, Drivers, and Restraints; Revenue Estimation and Forecast; Segmentation Analysis; Impact of COVID-19; Companies’ Strategic Developments; Market Share Analysis of Key Players; Company Profiling |
|
Regions Covered in the Report |
North America, Europe, Asia-Pacific, Middle East, and Rest of the World |
A few notable trends in the industry include innovations and developments in technologies such as carbon nanotubes, graphene transistors, and self-organizing molecular machines. There is also a growing trend of quantum computing on a global scale.
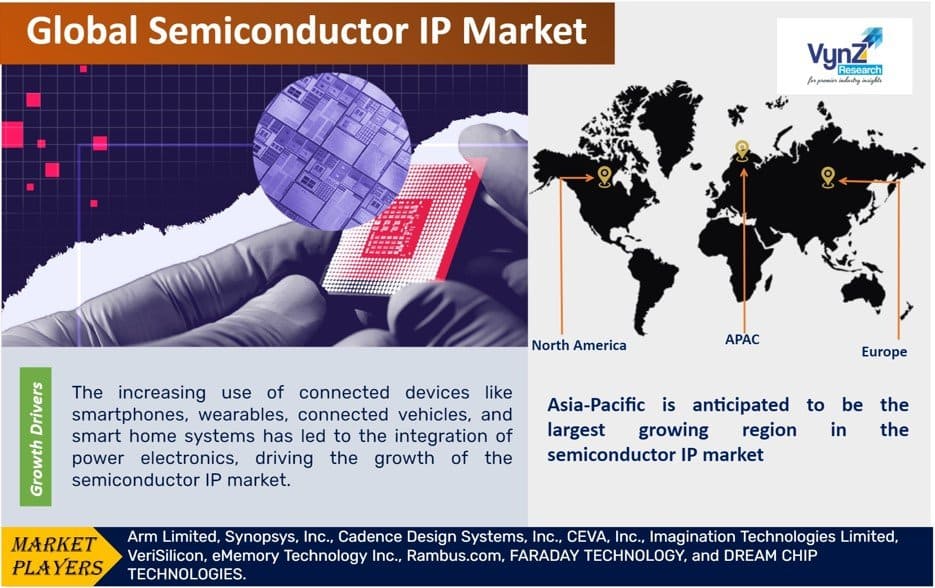
The most significant factor that influences the growth of the global semiconductor IP market is the growing adoption and use of different types of connected devices, such as wearables, smartphones, smart home systems, and connected vehicles, as it has resulted in the integration of power electronics. In addition, the rise in demand for system-on-chip (SoC) design has also prompted the growth of the market. The fact that such an approach reduces the cost of designing and manufacturing also propels market growth. Moreover, the growing popularity and use of consumer electronics in daily life, as well as the higher use of teleconference instruments along with other consumer electronics in the healthcare sector, also drives market expansion.
The shadow semiconductor supply chain hinders market growth since it results in counterfeits, IP theft, and conflicts. The higher designing and development cost of semiconductor IP, along with the complexities involved, also challenges the market expansion. Moreover, the issue with Moore’s law and the temporary influence on the consumer electronics industry also impedes the growth of the semiconductor IP market.
Growth opportunities to the global semiconductor IP market are offered by programmable DSP IP segment and the growing demand in the aerospace, avionics, and defense sectors. Additionally, rapid growth is expected in the automotive sector due to higher adoption of IP cores and automated processes; applications of microprocessor units, sensors, interfaces, memory, and microcontroller units in premium autonomous vehicles also show promising growth opportunities for the global semiconductor IP market.
Asia-Pacific is expected to dominate the global semiconductor IP market and grow more during the forecast period due to higher investment, growing need for consumer electronics devices, and low labor cost. It is also attributed to the higher production of sophisticated electronic devices with better features, such as better wireless communication, swift processing, RF-ability, and higher storage capacity, which make them more effective.
The strategies adopted by the semiconductor IP industry include product innovation, mergers & acquisitions to remain competitive in the industry. Moreover, the large-scale manufacturers are able to integrate backward and forward and the presence of key players are running their business in domestic and international territories, resulting in the growth of the semiconductor IP market.
Arm Holdings plc is a British semiconductor and software design company based in Cambridge, England, whose primary business is the design of central processing unit cores that implement the ARM architecture family of instruction sets.
Synopsys, Inc. supplies electronic design automation solutions to the global electronics market. The Company provides design technologies to creators of advanced integrated circuits, electronic systems, and systems on a chip. Synopsys also provides consulting services and support to its customers to streamline the overall design process and accelerate time to market.
Some of the key players operating in the semiconductor IP market are Arm Limited, Synopsys, Inc., Cadence Design Systems, Inc., CEVA, Inc., Imagination Technologies Limited, VeriSilicon, eMemory Technology Inc., Rambus.com, FARADAY TECHNOLOGY, and DREAM CHIP TECHNOLOGIES.
Ceva, Inc., the leading licensor of silicon and software IP that enables Smart Edge devices to connect, sense and infer data more reliably and efficiently has launched Ceva-Waves Links which is a multi-protocol wireless platform IPs. The integrated offering supports the latest wireless standards to address the surging demand for connectivity-rich chips targeting Smart Edge devices in the consumer IoT, Industrial, automotive, and personal computing markets.
SoftBank Group's Arm Holdings develop artificial-intelligence chips to launch the first products. Mass production will be handled by contract manufacturers.
The Semiconductor IP Market report offers a comprehensive market segmentation analysis along with an estimation for the forecast period 2025–2030.
Segments Covered in the Report
Region Covered in the Report
.png)
Source: VynZ Research
1. Research Overview
1.1. The Report Offers
1.2. Market Coverage
1.2.1. By Design IP
1.2.2. By IP Core
1.2.3. By IP Source
1.2.4. By End-User
1.2.5. By Region
1.3. Research Phases
1.4. Limitations
1.5. Market Methodology
1.5.1. Data Sources
1.5.1.1. Primary Research
1.5.1.2. Secondary Research
1.5.2. Methodology
1.5.2.1. Data Exploration
1.5.2.2. Forecast Parameters
1.5.2.3. Data Validation
1.5.2.4. Assumptions
1.5.3. Study Period & Data Reporting Unit
2. Executive Summary
3. Industry Overview
3.1. Industry Dynamics
3.1.1. Market Growth Drivers
3.1.2. Market Restraints
3.1.3. Key Market Trends
3.1.4. Major Opportunities
3.2. Industry Ecosystem
3.2.1. Porter’s Five Forces Analysis
3.2.2. Recent Development Analysis
3.2.3. Value Chain Analysis
3.3. Competitive Insight
3.3.1. Competitive Position of Industry Players
3.3.2. Market Attractive Analysis
3.3.3. Market Share Analysis
4. Global Market Estimate and Forecast
4.1. Global Market Overview
4.2. Global Market Estimate and Forecast to 2030
5. Market Segmentation Estimate and Forecast
5.1. By Design IP
5.1.1. Processor IP
5.1.1.1. Market Definition
5.1.1.2. Market Estimation and Forecast to 2030
5.1.2. Interface IP
5.1.2.1. Market Definition
5.1.2.2. Market Estimation and Forecast to 2030
5.1.3. Memory IP
5.1.3.1. Market Definition
5.1.3.2. Market Estimation and Forecast to 2030
5.1.4. Other Design IP
5.1.4.1. Market Definition
5.1.4.2. Market Estimation and Forecast to 2030
5.2. By IP Core
5.2.1. Soft Core
5.2.1.1. Market Definition
5.2.1.2. Market Estimation and Forecast to 2030
5.2.2. Hard Core
5.2.2.1. Market Definition
5.2.2.2. Market Estimation and Forecast to 2030
5.3. By IP Source
5.3.1. Royalty
5.3.1.1. Market Definition
5.3.1.2. Market Estimation and Forecast to 2030
5.3.2. Licensing
5.3.2.1. Market Definition
5.3.2.2. Market Estimation and Forecast to 2030
5.4. By End-User
5.4.1. Consumer Electronics
5.4.1.1. Market Definition
5.4.1.2. Market Estimation and Forecast to 2030
5.4.2. Telecom & Data Centers
5.4.2.1. Market Definition
5.4.2.2. Market Estimation and Forecast to 2030
5.4.3. Automotive
5.4.3.1. Market Definition
5.4.3.2. Market Estimation and Forecast to 2030
5.4.4. Commercial
5.4.4.1. Market Definition
5.4.4.2. Market Estimation and Forecast to 2030
5.4.5. Industrial
5.4.5.1. Market Definition
5.4.5.2. Market Estimation and Forecast to 2030
5.4.6. Aerospace & Defense
5.4.6.1. Market Definition
5.4.6.2. Market Estimation and Forecast to 2030
5.4.7. Others
5.4.7.1. Market Definition
5.4.7.2. Market Estimation and Forecast to 2030
6. North America Market Estimate and Forecast
6.1. By Design IP
6.2. By IP Core
6.3. By IP Source
6.4. By End-User
6.5. By Country
6.5.1. U.S. Market Estimate and Forecast
6.5.2. Canada Market Estimate and Forecast
6.5.3. Mexico Market Estimate and Forecast
7. Europe Market Estimate and Forecast
7.1. By Design IP
7.2. By IP Core
7.3. By IP Source
7.4. By End-User
7.5. By Country
7.5.1. Germany Market Estimate and Forecast
7.5.2. France Market Estimate and Forecast
7.5.3. U.K. Market Estimate and Forecast
7.5.4. Italy Market Estimate and Forecast
7.5.5. Spain Market Estimate and Forecast
7.5.6. Rest of Europe Market Estimate and Forecast
8. Asia-Pacific Market Estimate and Forecast
8.1. By Design IP
8.2. By IP Core
8.3. By IP Source
8.4. By End-User
8.5. By Country
8.5.1. China Market Estimate and Forecast
8.5.2. Japan Market Estimate and Forecast
8.5.3. India Market Estimate and Forecast
8.5.4. South Korea Market Estimate and Forecast
8.5.5. Singapore Market Estimate and Forecast
8.5.6. Rest of Asia-Pacific Market Estimate and Forecast
9. Rest of the World (RoW) Market Estimate and Forecast
9.1. By Design IP
9.2. By IP Core
9.3. By IP Source
9.4. By End-User
9.5. By Country
9.5.1. Brazil Market Estimate and Forecast
9.5.2. Saudi Arabia Market Estimate and Forecast
9.5.3. South Africa Market Estimate and Forecast
9.5.4. Other Countries Market Estimate and Forecast
10. Company Profiles
10.1. Arm Limited
10.1.1. Snapshot
10.1.2. Overview
10.1.3. Offerings
10.1.4. Financial Insight
10.1.5. Recent Developments
10.2. Synopsys, Inc.
10.2.1. Snapshot
10.2.2. Overview
10.2.3. Offerings
10.2.4. Financial Insight
10.2.5. Recent Developments
10.3. Cadence Design Systems, Inc.
10.3.1. Snapshot
10.3.2. Overview
10.3.3. Offerings
10.3.4. Financial Insight
10.3.5. Recent Developments
10.4. CEVA, Inc.
10.4.1. Snapshot
10.4.2. Overview
10.4.3. Offerings
10.4.4. Financial Insight
10.4.5. Recent Developments
10.5. Imagination Technologies Limited
10.5.1. Snapshot
10.5.2. Overview
10.5.3. Offerings
10.5.4. Financial Insight
10.5.5. Recent Developments
10.6. VeriSilicon
10.6.1. Snapshot
10.6.2. Overview
10.6.3. Offerings
10.6.4. Financial Insight
10.6.5. Recent Developments
10.7. eMemory Technology Inc.
10.7.1. Snapshot
10.7.2. Overview
10.7.3. Offerings
10.7.4. Financial Insight
10.7.5. Recent Developments
10.8. Rambus.com
10.8.1. Snapshot
10.8.2. Overview
10.8.3. Offerings
10.8.4. Financial Insight
10.8.5. Recent Developments
10.9. FARADAY TECHNOLOGY
10.9.1. Snapshot
10.9.2. Overview
10.9.3. Offerings
10.9.4. Financial Insight
10.9.5. Recent Developments
10.10. DREAM CHIP TECHNOLOGIES
10.10.1. Snapshot
10.10.2. Overview
10.10.3. Offerings
10.10.4. Financial Insight
10.10.5. Recent Developments
11. Appendix
11.1. Exchange Rates
11.2. Abbreviations
Note: Financial insight and recent developments of different companies are subject to the availability of information in the secondary domain.
List of Tables
Table 1 Sources
Table 2 Study Periods
Table 3 Data Reporting Unit
Table 4 Global Semiconductor IP Market, By Design IP, 2018 - 2023 (USD Billion)
Table 5 Global Semiconductor IP Market, By Design IP, 2025 - 2030(USD Billion)
Table 6 Global Semiconductor IP Market, By IP Core, 2018 - 2023 (USD Billion)
Table 7 Global Semiconductor IP Market, By IP Core, 2025 - 2030(USD Billion)
Table 8 Global Semiconductor IP Market, By IP Source, 2018 - 2023 (USD Billion)
Table 9 Global Semiconductor IP Market, By IP Source, 2025 - 2030(USD Billion)
Table 10 Global Semiconductor IP Market, By End-User, 2018 - 2023 (USD Billion)
Table 11 Global Semiconductor IP Market, By End-User, 2025 - 2030(USD Billion)
Table 12 Global Semiconductor IP Market, by Region, 2018 - 2023 (USD Billion)
Table 13 Global Semiconductor IP Market, by Region, 2025 - 2030(USD Billion)
Table 14 North America Semiconductor IP Market, By Design IP, 2018 - 2023 (USD Billion)
Table 15 North America Semiconductor IP Market, By Design IP, 2025 - 2030(USD Billion)
Table 16 North America Semiconductor IP Market, By IP Core, 2018 - 2023 (USD Billion)
Table 17 North America Semiconductor IP Market, By IP Core, 2025 - 2030(USD Billion)
Table 18 North America Semiconductor IP Market, By IP Source, 2018 - 2023 (USD Billion)
Table 19 North America Semiconductor IP Market, By IP Source, 2025 - 2030(USD Billion)
Table 20 North America Semiconductor IP Market, By End-User, 2018 - 2023 (USD Billion)
Table 21 North America Semiconductor IP Market, By End-User, 2025 - 2030(USD Billion)
Table 22 North America Semiconductor IP Market, by Region, 2018 - 2023 (USD Billion)
Table 23 North America Semiconductor IP Market, by Region, 2025 - 2030(USD Billion)
Table 24 Europe Semiconductor IP Market, By Design IP, 2018 - 2023 (USD Billion)
Table 25 Europe Semiconductor IP Market, By Design IP, 2025 - 2030(USD Billion)
Table 26 Europe Semiconductor IP Market, By IP Core, 2018 - 2023 (USD Billion)
Table 27 Europe Semiconductor IP Market, By IP Core, 2025 - 2030(USD Billion)
Table 28 Europe Semiconductor IP Market, By IP Source, 2018 - 2023 (USD Billion)
Table 29 Europe Semiconductor IP Market, By IP Source, 2025 - 2030(USD Billion)
Table 30 Europe Semiconductor IP Market, By End-User, 2018 - 2023 (USD Billion)
Table 31 Europe Semiconductor IP Market, By End-User, 2025 - 2030(USD Billion)
Table 32 Europe Semiconductor IP Market, by Region, 2018 - 2023 (USD Billion)
Table 33 Europe Semiconductor IP Market, by Region, 2025 - 2030(USD Billion)
Table 34 Asia-Pacific Semiconductor IP Market, By Design IP, 2018 - 2023 (USD Billion)
Table 35 Asia-Pacific Semiconductor IP Market, By Design IP, 2025 - 2030(USD Billion)
Table 36 Asia-Pacific Semiconductor IP Market, By IP Core, 2018 - 2023 (USD Billion)
Table 37 Asia-Pacific Semiconductor IP Market, By IP Core, 2025 - 2030(USD Billion)
Table 38 Asia-Pacific Semiconductor IP Market, By IP Source, 2018 - 2023 (USD Billion)
Table 39 Asia-Pacific Semiconductor IP Market, By IP Source, 2025 - 2030(USD Billion)
Table 40 Asia-Pacific Semiconductor IP Market, By End-User, 2018 - 2023 (USD Billion)
Table 41 Asia-Pacific Semiconductor IP Market, By End-User, 2025 - 2030(USD Billion)
Table 42 Asia-Pacific Semiconductor IP Market, by Region, 2018 - 2023 (USD Billion)
Table 43 Asia-Pacific Semiconductor IP Market, by Region, 2025 - 2030(USD Billion)
Table 44 RoW Semiconductor IP Market, By Design IP, 2018 - 2023 (USD Billion)
Table 45 RoW Semiconductor IP Market, By Design IP, 2025 - 2030(USD Billion)
Table 46 RoW Semiconductor IP Market, By IP Core, 2018 - 2023 (USD Billion)
Table 47 RoW Semiconductor IP Market, By IP Core, 2025 - 2030(USD Billion)
Table 48 RoW Semiconductor IP Market, By IP Source, 2018 - 2023 (USD Billion)
Table 49 RoW Semiconductor IP Market, By IP Source, 2025 - 2030(USD Billion)
Table 50 RoW Semiconductor IP Market, By End-User, 2018 - 2023 (USD Billion)
Table 51 RoW Semiconductor IP Market, By End-User, 2025 - 2030(USD Billion)
Table 52 RoW Semiconductor IP Market, by Region, 2018 - 2023 (USD Billion)
Table 53 RoW Semiconductor IP Market, by Region, 2025 - 2030(USD Billion)
Table 54 Snapshot – Arm Limited
Table 55 Snapshot – Synopsys, Inc.
Table 56 Snapshot – Cadence Design Systems, Inc.
Table 57 Snapshot – CEVA, Inc.
Table 58 Snapshot – Imagination Technologies Limited
Table 59 Snapshot – VeriSilicon
Table 60 Snapshot – eMemory Technology Inc.
Table 61 Snapshot – Rambus.com
Table 62 Snapshot – FARADAY TECHNOLOGY
Table 63 Snapshot – DREAM CHIP TECHNOLOGIES
List of Figures
Figure 1 Market Coverage
Figure 2 Research Phases
Figure 3 Secondary Sources for Different Parameters
Figure 4 Methodology
Figure 5 Data Mining & Exploration
Figure 6 Data Triangulation
Figure 7 Assumptions for Market Estimation and Forecast
Figure 8 Market Synopsis
Figure 9 Global Semiconductor IP Market- Growth Drivers and Restraints
Figure 10 Competitive Benchmark
Figure 11 Global Semiconductor IP Market Highlight
Figure 12 Global Semiconductor IP Market, By Design IP, 2018 - 2030 (USD Billion)
Figure 13 Global Semiconductor IP Market, By IP Core, 2018 - 2030 (USD Billion)
Figure 14 Global Semiconductor IP Market, By IP Source, 2018 - 2030 (USD Billion)
Figure 15 Global Semiconductor IP Market, By End-User, 2018 - 2030 (USD Billion)
Figure 16 Global Semiconductor IP Market, by Region, 2018 - 2030 (USD Billion)
Figure 17 North America Semiconductor IP Market Highlight
Figure 18 North America Semiconductor IP Market, By Design IP, 2018 - 2030 (USD Billion)
Figure 19 North America Semiconductor IP Market, By IP Core, 2018 - 2030 (USD Billion)
Figure 20 North America Semiconductor IP Market, By IP Source, 2018 - 2030 (USD Billion)
Figure 21 North America Semiconductor IP Market, By End-User, 2018 - 2030 (USD Billion)
Figure 22 North America Semiconductor IP Market, by Region, 2018 - 2030 (USD Billion)
Figure 23 Europe Semiconductor IP Market Highlight
Figure 24 Europe Semiconductor IP Market, By Design IP, 2018 - 2030 (USD Billion)
Figure 25 Europe Semiconductor IP Market, By IP Core, 2018 - 2030 (USD Billion)
Figure 26 Europe Semiconductor IP Market, By IP Source, 2018 - 2030 (USD Billion)
Figure 27 Europe Semiconductor IP Market, By End-User, 2018 - 2030 (USD Billion)
Figure 28 Europe Semiconductor IP Market, by Region, 2018 - 2030 (USD Billion)
Figure 29 Asia-Pacific Semiconductor IP Market Highlight
Figure 30 Asia-Pacific Semiconductor IP Market, By Design IP, 2018 - 2030 (USD Billion)
Figure 31 Asia-Pacific Semiconductor IP Market, By IP Core, 2018 - 2030 (USD Billion)
Figure 32 Asia-Pacific Semiconductor IP Market, By IP Source, 2018 - 2030 (USD Billion)
Figure 33 Asia-Pacific Semiconductor IP Market, By End-User, 2018 - 2030 (USD Billion)
Figure 34 Asia-Pacific Semiconductor IP Market, by Region, 2018 - 2030 (USD Billion)
Figure 35 RoW Semiconductor IP Market Market Highlight
Figure 36 RoW Semiconductor IP Market, By Design IP, 2018 - 2030 (USD Billion)
Figure 37 RoW Semiconductor IP Market, By IP Core, 2018 - 2030 (USD Billion)
Figure 38 RoW Semiconductor IP Market, By IP Source, 2018 - 2030 (USD Billion)
Figure 39 RoW Semiconductor IP Market, By End-User, 2018 - 2030 (USD Billion)
Figure 40 RoW Semiconductor IP Market, by Region, 2018 - 2030 (USD Billion)
Global Semiconductor IP Market Coverage
Design IP Insight and Forecast 2025-2030
IP Core Insight and Forecast 2025-2030
IP Source Insight and Forecast 2025-2030
End-User Insight and Forecast 2025-2030
Geographical Segmentation
Semiconductor IP Market by Region
North America
Europe
Asia-Pacific (APAC)
Rest of the World (RoW)
Vynz Research know in your business needs, you required specific answers pertaining to the market, Hence, our experts and analyst can provide you the customized research support on your specific needs.
After the purchase of current report, you can claim certain degree of free customization within the scope of the research.
Please let us know, how we can serve you better with your specific requirements to your research needs. Vynz research promises for quick reversal for your current business requirements.
Purchase Options
Latest Report
Research Methodology
Connect With Our Sales Team