Decoy Flares Market Overview
The Global Decoy Flares Market is anticipated to grow from USD 1.5 billion in 2023 to USD 3.4 billion in 2030 at a CAGR of 9.8% during the forecast period from 2025 to 2030.
There is increase in procurements of air defense systems, the growing development of missile jamming decoys and the increasing incidences of asymmetric warfare and terrorism across the globe. Air defense system purchases are rising, missile jamming decoys are becoming more advanced, and asymmetric warfare and terrorism are becoming more commonplace around the world, which are the key market drivers enhancing the market growth. Decoy flares are the pyrotechnic devices that generate intense heat upon ignition and are made from a composition of magnesium-based material and a combustion accelerator. The flare's heat signature is significantly higher than that of the aircraft's engines, effectively distracting heat-seeking projectiles. Once deployed, the flares burn for a short period, creating a bright, high-temperature heat source that misdirects the missile's infrared homing system. Flares are also designed to mimic the speed and trajectory of the aircraft, enhancing their decoy effectiveness. For incoming threats, the timing and strategy of deploying these flares play a crucial role. Hence, decoy flares are an essential asset in modern aerial warfare, serving as a critical defensive tool against heat-seeking missile technology. One of the key factors driving the market is the increasing product employment in the military and defense sector and the widespread use of heat-seeking weapons in modern warfare necessitating effective countermeasures. Decoy flares are an indispensable component of military countermeasure systems and are specifically designed for self-defense to protect aircrafts from heat-seeking missiles. The market is further influenced by the increasing global military expenditure which is driven by territorial disputes and geopolitical tensions and the necessity of maintaining national security. Also, rapid technological advancements, have enhanced the effectiveness of decoy flares, thus promoting their demand in the market.
Market Segmentation
Insight by Type
Based on type, the Global Decoy Flares Market is segmented into Pyrotechnic Flares, Pyrophoric Flares and Others. Pyrotechnic Flares segment shall dominate the market due to Pyrotechnic flares are extensively used in military operations due to their established effectiveness, reliability, and versatility in various applications. They are designed to generate intense heat and emit a bright light, effectively diverting incoming missiles away from the targeted aircraft. The simplicity and straightforwardness of pyrotechnic flares make them easily deployable and compatible with a wide range of aircraft platforms. Moreover, pyrotechnic flares have a relatively longer shelf life and require minimal maintenance, making them a preferred choice for military organizations and aircraft operators. Pyrophoric flares also possess unique properties and advantages, such as the ability to ignite spontaneously upon contact with air, eliminating the need for an external ignition source. This, in turn, makes them highly reliable and quick to deploy in critical situations, thus acting as a significant growth-inducing factor. Furthermore, pyrophoric flares offer a higher level of effectiveness in confusing and diverting incoming threats due to their intense and sustained heat emission. This enhanced capability brands them particularly valuable in highly challenging or complex combat scenarios.
Insight by Application
The Global Decoy Flares Market is bifurcated into Fixed Wing and Rotary Wing. Fixed wing accounted for the largest market share. The main factors that are driving the growth of this segment are their extensive utilization across a wide range of military and civil aircraft applications. Fixed-wing aircraft, such as fighter jets, bombers, transport planes, and unmanned aerial vehicles (UAVs), as well as rotary-wing aircraft, including helicopters and tiltrotors, play pivotal roles in defense, security, and commercial operations. These aircraft are equipped with advanced avionics and weapon systems, making them prime targets for heat-seeking missiles. As a result, the demand for effective countermeasures is substantial within this segment. Additionally, the size of the fixed and rotary-wing aircraft fleet is significant, with numerous nations possessing and operating various types of military aircraft. Furthermore, the global civil aviation sector is continuously expanding, necessitating enhanced safety measures.
Global Decoy Flares Market Report Coverage
|
Report Metric
|
Details
|
|
Historical Period
|
2020 - 2024
|
|
Base Year Considered
|
2025
|
|
Forecast Period
|
2026 - 2035
|
|
Market Size in 2025
|
U.S.D. 1.5 Billion
|
|
Revenue Forecast in 2035
|
U.S.D. 3.4 Billion
|
|
Growth Rate
|
9.8%
|
|
Segments Covered in the Report
|
By Type, By Application
|
|
Report Scope
|
Market Trends, Drivers, and Restraints; Revenue Estimation and Forecast; Segmentation Analysis; Companies’ Strategic Developments; Market Share Analysis of Key Players; Company Profiling
|
|
Regions Covered in the Report
|
North America, Europe, Asia-Pacific, Latin America, Middle East And Africa
|
Industry Dynamics
Growth Drivers
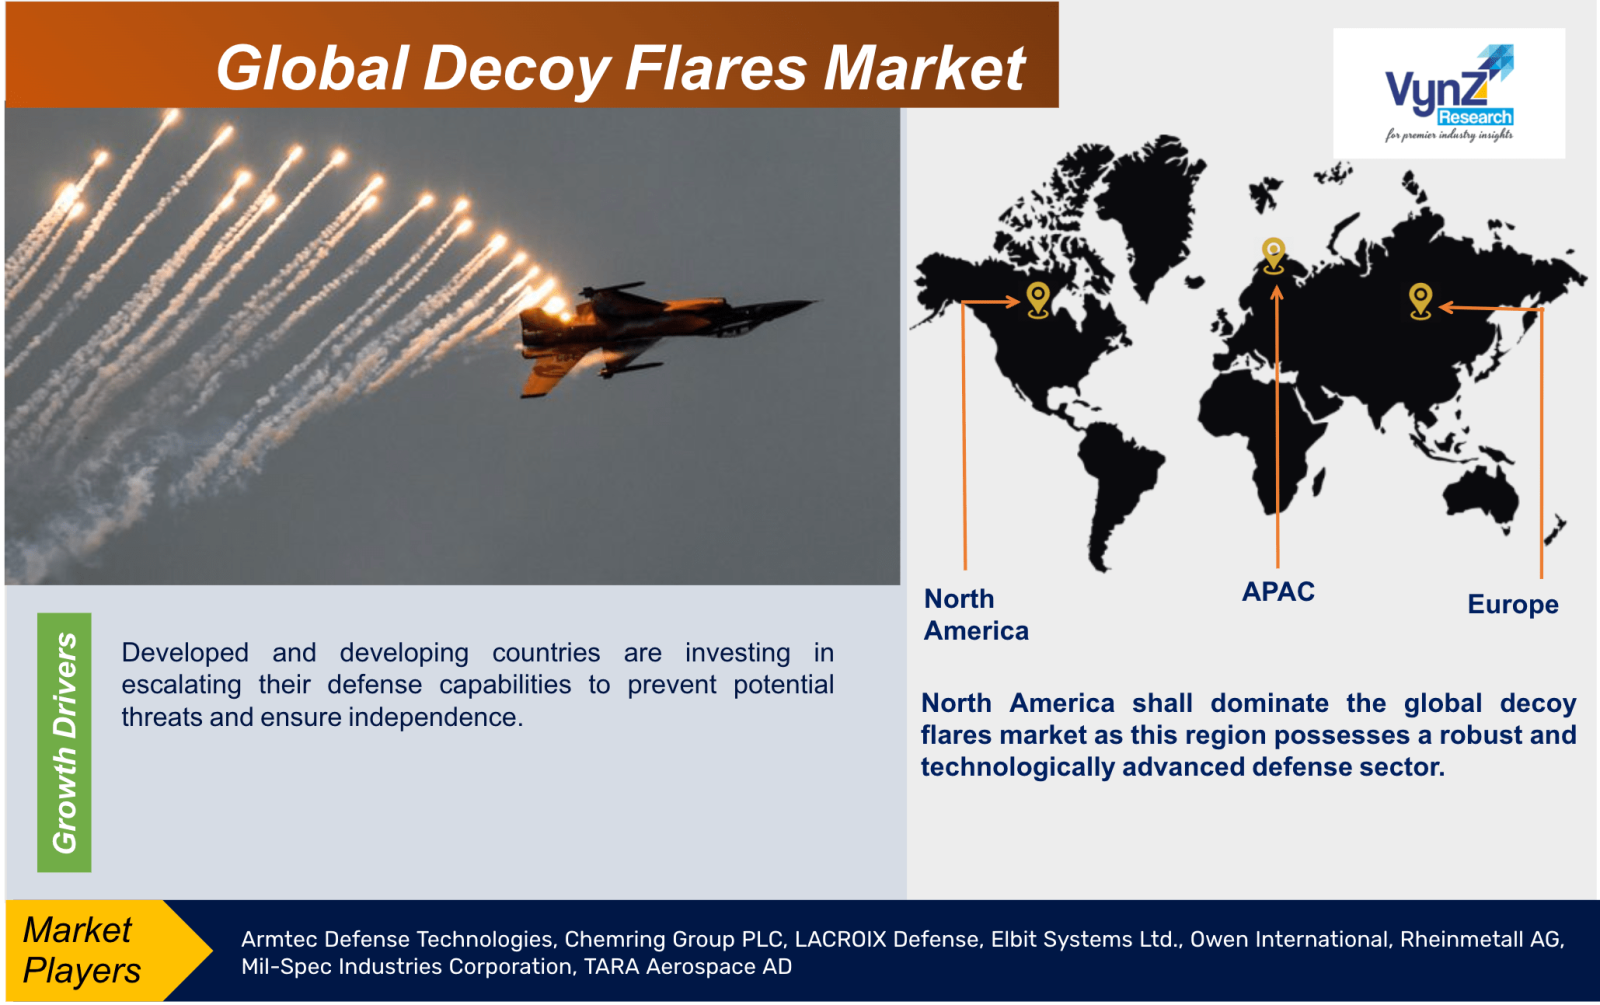
Developed and developing countries are investing in escalating their defense capabilities to prevent potential threats and ensure independence. This, in turn, has increased the demand for sophisticated protective systems, including decoy flares, as they form an essential part of an aircraft's defense mechanism. Military expenditure is fueled by escalating geopolitical tensions, territorial disputes and concerns over national security worldwide. The procurement of new aircraft, outfitted with these protective systems, further drives the demand. Also, existing fleets undergo periodic upgrades to keep pace with the advancements in technology and threats, further contributing to the continuous requirement for decoy flares. Hence, the expansion of the decoy flares market is due to the global increase in military spending. The rising incidences of other security threats and global terrorism and are assisting the need for advanced protective mechanisms in military and civil aircraft. This, in turn, is boosting product adoption to safeguard these vehicles from potential attacks. Furthermore, widespread funding by governments of many nations in modernizing their existing aircraft fleet through integrating the latest countermeasure technologies, including decoy flares, are favoring the market growth. The constant evolution of the missiles necessitates continuous advancement and refinement of flare technology to stay effective, that ensures consistent market growth.
Restraints
The main restraint of the global decoy flares market is the high cost required to design, manufacture, and upkeep of decoy flare systems. Cost constraints in defence budgets may prevent the purchase of advanced decoy flare systems, specially for the countries with limited financial resources. The effectiveness of decoy flare systems in practical situations can be influenced by a number of variables, such as timing, environmental conditions, and deployment methods. As a result, meticulous planning and operational training are required. Systems for decoy flares must be compatible with the mission profiles and existing aircraft operations.
Geographic Overview
- North America
- Europe
- Asia Pacific (APAC)
- Latin America
- Middle East and Africa
North America shall dominate the global decoy flares market as this region possesses a robust and technologically advanced defense sector. The United States, in particular allocates significant resources to defense spending, driving the demand for advanced defense systems and countermeasures. The region's strong military capabilities and focus on modernization also contribute to its dominant position in the market. Also, the aerospace and defense industry, consist of major suppliers, manufacturers and research institutions responsible for the growth of this market. After North America, Asia Pacific’s military transformation and defense expenditure contribute to the growing demand for advanced defense systems. Countries like China, India, South Korea, and Japan are bolstering their defense capabilities to address regional security concerns, territorial disputes, and the need for military preparedness.
Competitive Insights
The key players in this market are utilizing various strategies to maintain their market position and achieve growth. Collaborations with research institutions, defense contractors and government agencies has played a crucial role in boosting the development of cutting-edge systems.
Armtec Defense Technologies (Armtec) is an operating unit of the Transdigm Group which is an industry leader in aerospace and defense products and services. Armtec is comprised of three business units producing subcomponents for ordnance in Coachella, CA, decoy countermeasure flares in Camden AR and radar countermeasure chaff in Lillington NC.
Chemring Group plc is a global business provider of a range of advanced technology products and services to the defence, aerospace and security markets. Chemring has extensive operations in the Americas, Europe, Middle East and Asia.
Key Players Covered in the Report
Some of the key players in this market are Armtec Defense Technologies, Chemring Group PLC, LACROIX Defense, Elbit Systems Ltd., Owen International, Rheinmetall AG, Mil-Spec Industries Corporation, TARA Aerospace AD
Recent developments by Key Players
The AWS, LACROIX and STMicroelectronics collaboration empowers developers by bridging the worlds of machine learning, IoT, and embedded devices.
Lacroix’s Sylena Offers Extensive Protection Against Missiles With K-Band Seekers. The Sylena decoy launching system is presently in use by the French Navy and has garnered interest from several export customers. The latest customer is the Hellenic Navy aboard the FDI.
The Global Decoy Flares Market report offers a comprehensive market segmentation analysis along with the estimation for the forecast period 2025–2030.
Segments Covered in the Report
- By Type
- Pyrotechnic Flares
- Pyrophoric Flares
- Others
- By Application
Region Covered in the Report
- North America
- Europe
- Germany
- U.K.
- France
- Italy
- Spain
- Russia
- Rest of Europe
- Asia-Pacific (APAC)
- China
- Japan
- South Korea
- India
- Australia
- Rest of APAC
- Latin America
- Brazil
- Argentina
- Rest of Latin America
- Middle East and Africa
- Turkey
- UAE
- Saudi Arabia
- South Africa
- Rest of MEA
.png "Decoy Flares Market Size")
Source: VynZ Research
Source: VynZ Research
