Global Directed Energy Weapon Market – Analysis and Forecast (2025-2030)

Industry Insights By Product (Non-Lethal and Lethal), By Technology (Laser Systems, Radio Frequency Systems and Particle Beam Systems), By Platform (Land, Sea and Air), By Range (Less than 1 km and More than 1 km), By Application (Homeland Security and Defense) and By Geography (North America, Asia-Pacific, Europe and Rest of the World)

About This Report Status : Published Published On : May, 2024 Report Code : VRAD12028 Industry : Aerospace and Defense Available Format : Page : 196

Industry Overview

Report Description

The Global Directed Energy Weapon Market is expected to reach USD 10.6 billion in 2030 from USD 6.1  in 2023 billion with a compound annual growth rate CAGR of 18.9% throughout the forecast period 2025-2030.

Directed energy weapons are a type of electromagnetic or particle technology which use energy, as opposed to a physical projectile, to strike a target. In directed energy (DE) weapons concentrated electromagnetic energy is used instead of kinetic energy. Since 1960, The United States has been researching directed energy where some experts have observed that the Department of Defense (DOD) has invested billions of dollars in DE programs which have failed to reach maturity and were cancelled. However, recently the department of defense has made progress on directed energy weapons development. Since then, directed energy weapons development has continued. This department has also introduced a High Energy Laser Scaling Initiative, which seeks to strengthen the defense industrial base for directed energy weapons and improve laser beam quality and efficiency. 

Reveal each market segment's real performance. Access comprehensive data and strategic insights.
Download PDF

Market Segmentation

Insight by Product

Based on product, the Directed Energy Weapon Market is segregated into Non-Lethal and Lethal. The lethal division is projected to dominate the market as it focuses on military applications like electromagnetic bombs, plasma canons, microwave guns, plasma grenades, automatic shot guns and others.

Insight by Technology

The Directed Energy Weapon Market is segmented by technology as Laser Systems, Radio Frequency Systems and Particle Beam Systems.  High energy laser technology segment is to dominate the market as there is a high demand for high energy laser technology and technological advancement.

Insight by Platform

On the basis of platform, the Directed Energy Weapon Market is segregated into Land, Sea and Air.  The sea segment is expected to grow with the highest CAGR during the forecast period due to the robust defense expenditures and investments to integrate the directed energy weapon (DEW) technology into the naval vessels. Various governments decided to introduce directed energy weapons onboard combat ships like destroyers and frigates to neutralize enemy ships, UAVs, and missiles.

Insight by Range

Based on range, the Directed Energy Weapon Market is segmented into Less than 1 km and More than 1 km. Less than 1 km range directed energy weapon segment dominated the market as the potentially lethal effects are produced only within 100 meters range.

Insight by Application

The Directed Energy Weapon Market is segmented by application as Homeland security and Defense. The defense segment is anticipated to dominate the market as the armed forces and key market players around the world have been investing and adopting the next generation directed energy weapons through their federal budget.

Global Directed Energy Weapon Market Report Coverage

Report Metric

Details

Historical Period

2020 - 2024

Base Year Considered

2025

Forecast Period

2026 - 2035

Market Size in 2025

U.S.D.  6.1

Revenue Forecast in 2035

U.S.D.  10.6

Growth Rate

18.9%

Segments Covered in the Report

By Product, By Technology, By Platform, By Range, By Application

Report Scope

Market Trends, Drivers, and Restraints; Revenue Estimation and Forecast; Segmentation Analysis; Impact of COVID-19; Companies’ Strategic Developments; Market Share Analysis of Key Players; Company Profiling

Regions Covered in the Report

North America, Asia-Pacific, Europe and Rest of the World

Industry Dynamics

Growth Drivers

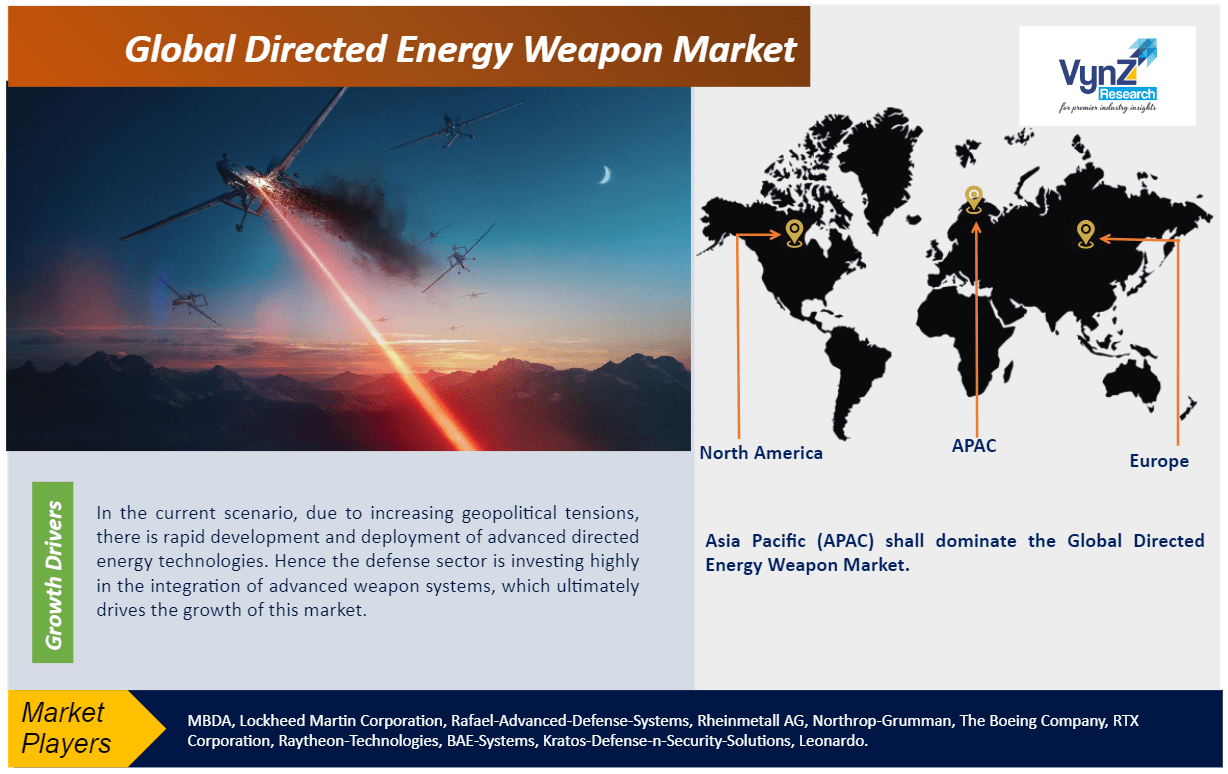
In the current scenario, due to increasing geopolitical tensions, there is rapid development and deployment of advanced directed energy technologies. Hence the defense sector is investing highly in the integration of advanced weapon systems, which ultimately drives the growth of this market. The increasing threat of rockets, missiles, unmanned air vehicles, etc., is accelerating the development and deployment of directed energy weapons. Presently, the major growth driver of the directed energy weapon market is the investment done in the advanced weapon systems due to geopolitical tensions between various countries. Also the integration of counter-UAV laser systems is adopted, which can be later scaled into complete air defense systems. Directed energy weapons offer a high-speed, highly accurate and more cost-effective method to counter aerial threats in comparison with highly expensive missile to destroy moderate-level threats. These are some of the factors driving the growth of the market.

Restraints

The main constraints of the directed energy weapon market are the high development cost and restrictions on anti-personnel laser. Increased barriers in designing military DEW systems are also a challenge for the growth of the directed energy weapons market during the forecast period 2025-2030. Efficiency of the directed energy weapons have been also affected as the integration between modern and conventional devices is difficult. 

Geographic Overview

  • North America
  • Europe
  • Asia Pacific (APAC)
  • Rest of the World

Geographically, Asia Pacific (APAC) shall dominate the Global Directed Energy Weapon Market as this technology is integrated into the Army, Navy, and Air Force as the demand for directed energy weapons is increased due to the increased border disputes and security threats like terrorists attacks.

Key Players Covered in the Report

The key players of the global Directed Energy Weapon Market are MBDA, Lockheed Martin Corporation, Rafael-Advanced-Defense-Systems, Rheinmetall AG, Northrop-Grumman, The Boeing Company, RTX Corporation, Raytheon-Technologies, BAE-Systems, Kratos-Defense-n-Security-Solutions, Leonardo.

Recent Development by Key Players

Kratos Defense & Security Solutions, Inc. revealed that Florida Turbine Technologies (FTT) is been selected as the engine design team for the Boom-led partnership working on Symphony. Symphony is a cutting-edge propulsion system tailored for Boom Supersonic’s Overture supersonic airliner.

RAFAEL and IMOD DDR&D collaborated for successful testing of the advanced SPYDER air defense system, which utilizes a distinctive “All in One” configuration. To achieve an accurate and effective direct impact, they intercepted a UAV within a challenging operational scenario during the test.

The global Directed Energy Weapon Market report offers a comprehensive market segmentation analysis along with estimation for the forecast period 2025–2030.

Segments Covered in the Report

  • By Product
    • Non-Lethal
    • Lethal
  • By Type
    • Laser Systems
    • Radio Frequency System
    • Particle Beam System
  • By Platform
    • Land
    • Sea  
    • Air
  • By Range
    • Less than 1 km
    • More than 1 km
  • By Application
    • Homeland Security
    • Defense

Regions Covered in the Report

  • North America
    • U.S.
    • Canada
    • Mexico
  • Europe
    • Germany
    • U.K.
    • France
    • Italy
    • Spain
    • Russia
    • Rest of Europe
  • Asia-Pacific (APAC)
    • China
    • Japan
    • India
  • Rest of the World
    • Brazil
    • Saudi Arabia
    • South Africa
    •  U.A.E
    • Other Countries

Directed Energy Weapon Market Size

Highlight opportunities using granular analytics insights. Make informed decisions with detailed market intelligence.
Download PDF

Source: VynZ Research

Directed Energy Weapon Market Analysis

Reveal each market segment's real performance. Access comprehensive data and strategic insights.
Download PDF

Source: VynZ Research

1.    Research Overview

        1.1.    The Report Offers
        1.2.    Market Coverage
                1.2.1.    By Product
                1.2.2.    By Technology 
                1.2.3.      By Platform
                1.2.4.      By Range
                1.2.5.      By Application
                1.2.6.    By Region
        1.3.    Research Phases
        1.4.    Limitations
        1.5.    Market Methodology
                1.5.1.  Data Sources
                        1.5.1.1. Primary Research
                        1.5.1.2. Secondary Research
                1.5.2.  Methodology
                        1.5.2.1. Data Exploration
                        1.5.2.2. Forecast Parameters
                        1.5.2.3. Data Validation
                        1.5.2.4. Assumptions
                1.5.3.    Study Period & Data Reporting Unit

2.    Executive Summary

3.    End-user Type Overview

        3.1.    End-user Type Dynamics
                3.1.1.    Market Growth Drivers
                3.1.2.    Market Restraints
                3.1.3.    Key Market Trends
                3.1.4.    Major Opportunities
        3.2.    End-user Type Ecosystem
                3.2.1.    Porter’s Five Forces Analysis
                3.2.2.    Recent Development Analysis
                3.2.3.    Value Chain Analysis
        3.3.    Competitive Insight
                3.3.1.    Competitive Position of End-user Type Players
                3.3.2.    Market Attractive Analysis
                3.3.3.    Market Share Analysis

4.    Global Market Estimate and Forecast

        4.1.    Global Market Overview
        4.2.    Global Market Estimate and Forecast to 2030

5.    Market Segmentation Estimate and Forecast

        5.1.    By Product 
                5.1.1.  Non-Lethal and Lethal
                        5.1.1.1. Market Definition
                        5.1.1.2. Market Estimation and Forecast to 203  
        5.2.    By Technology 
                5.2.1.  Laser Systems
                        5.2.1.1. Market Definition
                        5.2.1.2. Market Estimation and Forecast to 2030
                5.2.2.    Radio Frequency Systems 
                        5.2.2.1. Market Definition
                        5.2.2.2. Market Estimation and Forecast to 2030
                5.2.3.    Particle Beam Systems
                        5.2.3.1. Market Definition
                        5.2.3.2. Market Estimation and Forecast to 203    
        5.3    By Platform
                5.3.1.  Land
                        5.3.1.1. Market Definition
                        5.3.1.2. Market Estimation and Forecast to 2030    
                5.3.2.  Sea and Air
                         5.3.2.1. Market Definition
                         5.3.2.2. Market Estimation and Forecast to 2030           
        5.4.    By  Range
                5.4.1.    Less than 1 km
                          5.4.1.1. Market Definition
                          5.4.1.2. Market Estimation and Forecast to 2030
                5.4.2.  More than 1 km
                        5.4.2.1. Market Definition
                        5.4.2.2. Market Estimation and Forecast to 2030

  5.5.    By Application 
                5.5.1.    Homeland Security and Defense
                        5.5.1.1. Market Definition
                        5.5.1.2. Market Estimation and Forecast to 2030

6.    North America Market Estimate and Forecast

        6.1.    By Product 
        6.2.    By Technology 
        6.3.    By Platform 
        6.4.    By Range
        6.5.    By Application
        6.6.    By Country – China, Japan, India, South Korea, and Rest of Asia-Pacific
                6.6.1.    U.S. Market Estimate and Forecast
                6.6.2.    Canada Market Estimate and Forecast
                6.6.3.    Mexico Market Estimate and Forecast

7.    Europe Market Estimate and Forecast

        7.1.    By Product 
        7.2.    By Technology 
        7.3.    By Platform 
        7.4.    By Range
        7.5.    By Application
        7.6.    By Country – China, Japan, India, South Korea, and Rest of Asia-Pacific
                7.6.1.    Germany Market Estimate and Forecast
                7.6.2.    France Market Estimate and Forecast
                7.6.3.    U.K. Market Estimate and Forecast
                7.6.4.    Italy Market Estimate and Forecast
                7.6.5.    Spain Market Estimate and Forecast
                7.6.6.    Rest of Europe Market Estimate and Forecast

8.    Asia-Pacific Market Estimate and Forecast

         8.1.    By Product 
         8.2.    By Technology 
         8.3.    By Platform 
         8.4.    By Range
         8.5.    By Application
         8.6.    By Country – China, Japan, India, South Korea, and Rest of Asia-Pacific
                8.6.1.    China Market Estimate and Forecast
                8.6.2.    Japan Market Estimate and Forecast
                8.6.3.    India Market Estimate and Forecast
                8.6.4.    South Korea Market Estimate and Forecast
                8.6.5.    Singapore Market Estimate and Forecast
                8.6.6.    Rest of Asia-Pacific Market Estimate and Forecast

9.    Rest of the World (RoW) Market Estimate and Forecast

        9.1.    By Product 
        9.2.    By Technology 
        9.3.    By Platform 
        9.4.    By Range
        9.5.    By Application
        9.6.    By Country – Brazil, Saudi Arabia, South Africa, U.A.E., and Other Countries
                9.6.1.    Brazil Market Estimate and Forecast
                9.6.2.    Saudi Arabia Market Estimate and Forecast
                9.6.3.    South Africa Market Estimate and Forecast
                9.6.4.    Other Countries Market Estimate and Forecast

10.    Company Profiles

        10.1.  MBDA
                10.1.1.    Snapshot
                10.1.2.    Overview
                10.1.3.    Offerings
                10.1.4.    Financial Insight
                10.1.5.    Recent Developments
        10.2.   Lockheed Martin Corporation
                10.2.1.    Snapshot
                10.2.2.    Overview
                10.2.3.    Offerings
                10.2.4.    Financial Insight
                10.2.5.    Recent Developments
        10.3.   Rafael-Advanced-Defense-Systems
                10.3.1.    Snapshot
                10.3.2.    Overview
                10.3.3.    Offerings
                10.3.4.    Financial Insight
                10.3.5.    Recent Developments
        10.4.   Rheinmetall AG
                10.4.1.    Snapshot
                10.4.2.    Overview
                10.4.3.    Offerings
                10.4.4.    Financial Insight
                10.4.5.    Recent Developments
        10.5.   Northrop-Grumman
                10.5.1.    Snapshot
                10.5.2.    Overview
                10.5.3.    Offerings
                10.5.4.    Financial Insight
                10.5.5.    Recent Developments
        10.6.   The Boeing Company
                10.6.1.    Snapshot
                10.6.2.    Overview
                10.6.3.    Offerings
                10.6.4.    Financial Insight
                10.6.5.    Recent Developments
        10.7.   RTX Corporation
                10.7.1.    Snapshot
                10.7.2.    Overview
                10.7.3.    Offerings
                10.7.4.    Financial Insight
                10.7.5.    Recent Developments
        10.8.   Raytheon-Technologies
                10.8.1.    Snapshot
                10.8.2.    Overview
                10.8.3.    Offerings
                10.8.4.    Financial Insight
                10.8.5.    Recent Developments
        10.9.   BAE-Systems
                10.9.1.    Snapshot
                10.9.2.    Overview
                10.9.3.    Offerings
                10.9.4.    Financial Insight
                10.9.5.    Recent Developments
        10.10.  Kratos-Defense-n-Security-Solutions
                10.10.1. Snapshot
                10.10.2. Overview
                10.10.3. Offerings
                10.10.4. Financial Insight
                10.10.5. Recent Developments
       10.11.  Leonardo
                10.11.1. Snapshot
                10.11.2. Overview
                10.11.3. Offerings
                10.11.4. Financial Insight
                10.11.5. Recent Developments
    
11.    Appendix

        11.1.    Exchange Rates
        11.2.    Abbreviations

Note: Financial insight and recent developments of different companies are subject to the availability of information in the secondary domain.
 

List of Tables

Table 1  Products
Table 2 Study Periods
Table 3 Data Reporting Unit
Table 4 Global  Directed Energy Weapon Market  Size, by  Product, 2018-2023 (USD Billion)
Table 5 Global  Directed Energy Weapons Market  Size, by  Product, 2025-2030 (USD Billion)
Table 6 Global  Directed Energy Weapon Market  Size, by Technology, 2018-2023 (USD Billion)
Table 7 Global  Directed Energy Weapon Market  Size, by Technology, 2025-2030 (USD Billion)
Table 8 Global  Directed Energy Weapon Market  Size, by Platform, 2018-2023 (USD Billion)
Table 9 Global  Directed Energy Weapon Market  Size, by Platform, 2025-2030 (USD Billion)
Table 10 Global  Directed Energy Weapon Market  Size, by Range   Size, 2018-2023 (USD Billion)
Table 1Global  Directed Energy Weapon Market  Size, by Range   Size, 2025-2030 (USD Billion)
Table 12 Global  Directed Energy Weapon Market  Size, by Application, 2018-2023 (USD Billion)
Table 13Global  Directed Energy Weapon Market  Size, by Application, 2025-2030 (USD Billion)
Table 14 Global  Directed Energy Weapon Market  Size, by Region, 2018-2023 (USD Billion)
Table 15 Global  Directed Energy Weapon Market  Size, by Region, 2025-2030 (USD Billion)
Table 16 North America  Directed Energy Weapon Market  Size, by  Product, 2018-2023 (USD Billion)
Table 17 North America  Directed Energy Weapon Market  Size, by  Product, 2025-2030 (USD Billion)
Table 18 North America  Directed Energy Weapon Market  Size, by Technology , 2018-2023 (USD Billion)
Table 19 North America  Directed Energy Weapon Market  Size, by Technology , 2025-2030 (USD Billion)
Table 20 North America  Directed Energy Weapon Market  Size, by Platform , 2018-2023 (USD Billion)
Table 21 North America  Directed Energy Weapon Market  Size, by Platform , 2025-2030 (USD Billion)
Table 22 North America  Directed Energy Weapon Market  Size, by Range   Size, 2018-2023 (USD Billion)
Table 23 North America  Directed Energy Weapon Market  Size, by Range   Size, 2025-2030 (USD Billion)
Table 24 North America  Directed Energy Weapon Market  Size, by Application  , 2018-2023 (USD Billion)
Table 25 North America  Directed Energy Weapon Market  Size, by Application  , 2025-2030 (USD Billion)
Table 26 North America  Directed Energy Weapon Market  Size, by Country, 2018-2023 (USD Billion)
Table 27 North America  Directed Energy Weapons Market  Size, by Country, 2025-2030 (USD Billion)
Table 28 Europe  Directed Energy Weapon Market  Size, by  Product, 2018-2023 (USD Billion)
Table 29 Europe  Directed Energy Weapon Market  Size, by  Product, 2025-2030 (USD Billion)
Table 30 Europe  Directed Energy Weapon Market  Size, by Technology, 2018-2023 (USD Billion)
Table 31 Europe  Directed Energy Weapon Market  Size, by Technology, 2025-2030 (USD Billion)
Table 32 Europe  Directed Energy Weapon Market  Size, by Platform, 2018-2023 (USD Billion)
Table 33 Europe  Directed Energy Weapon Market  Size, by Platform, 2025-2030 (USD Billion)
Table 34 Europe  Directed Energy Weapon Market  Size, by Range   Size, 2018-2023 (USD Billion)
Table 35 Europe  Directed Energy Weapon Market  Size, by Range   Size, 2025-2030 (USD Billion)
Table 36 Europe  Directed Energy Weapon Market  Size, by Application, 2018-2023 (USD Billion)
Table 35 Europe  Directed Energy Weapon Market  Size, by Application, 2025-2030 (USD Billion)
Table 38 Europe  Directed Energy Weapon Market  Size, by Country, 2018-2023 (USD Billion)
Table 39 Europe  Directed Energy Weapon Market  Size, by Country, 2025-2030 (USD Billion)
Table 40 Asia-Pacific  Directed Energy Weapon Market  Size, by  Product, 2018-2023 (USD Billion)
Table 41 Asia-Pacific  Directed Energy Weapon Market  Size, by  Product, 2025-2030 (USD Billion)
Table 42 Asia-Pacific  Directed Energy Weapon Market  Size, by Technology, 2018-2023 (USD Billion)
Table 43 Asia-Pacific  Directed Energy Weapon Market  Size, by Technology, 2025-2030 (USD Billion)
Table 44 Asia-Pacific  Directed Energy Weapon Market  Size, by Platform, 2018-2023 (USD Billion)
Table 45 Asia-Pacific  Directed Energy Weapon Market  Size, by Platform, 2025-2030 (USD Billion)
Table 46 Europe  Directed Energy Weapon Market  Size, by Range   Size, 2018-2023 (USD Billion)
Table 47 Europe  Directed Energy Weapon Market  Size, by Range   Size, 2025-2030 (USD Billion)
Table 48 Europe  Directed Energy Weapon Market  Size, by Application, 2018-2023 (USD Billion)
Table 49 Europe  Directed Energy Weapon Market  Size, by Application, 2025-2030 (USD Billion)
Table 50 Asia-Pacific  Directed Energy Weapon Market  Size, by Country, 2018-2023 (USD Billion)
Table 51 Asia-Pacific  Directed Energy Weapon Market  Size, by Country, 2025-2030 (USD Billion)
Table 52 RoW  Directed Energy Weapon Market  Size, by  Product, 2018-2023 (USD Billion)
Table 53 RoW  Directed Energy Weapon Market  Size, by  Product, 2025-2030 (USD Billion)
Table 54 RoW  Directed Energy Weapon Market  Size, by Technology , 2018-2023 (USD Billion)
Table 55 RoW  Directed Energy Weapon Market  Size, by Technology , 2025-2030 (USD Billion)
Table 56 RoW  Directed Energy Weapon Market  Size, by Platform , 2018-2023 (USD Billion)
Table 57 RoW  Directed Energy Weapon Market  Size, by Platform, 2025-2030 (USD Billion)
Table 58 RoW  Directed Energy Weapon Market  Size, by Range   Size, 2018-2023 (USD Billion)
Table 59 RoW  Directed Energy Weapon Market  Size, by Range   Size, 2025-2030 (USD Billion)
Table 60 RoW  Directed Energy Weapon Market  Size, by Application  , 2018-2023 (USD Billion)
Table 61 RoW  Directed Energy Weapon Market  Size, by Application  , 2025-2030 (USD Billion)
Table 62 RoW  Directed Energy Weapon Market  Size, by Country, 2018-2023 (USD Billion)
Table 63 RoW  Directed Energy Weapon Market  Size, by Country, 2025-2030 (USD Billion)
Table 64 Snapshot – Lockheed Martin Corporation
Table 65 Snapshot – Rafael-Advanced-Defense-Systems
Table 66 Snapshot – Rheinmetall AG
Table 67 Snapshot – Northrop-Grumman
Table 68 Snapshot – The Boeing Company
Table 70 Snapshot – RTX Corporation
Table 71 Snapshot – Raytheon-Technologies
Table 72 Snapshot – BAE-Systems
Table 73 Snapshot – Kratos-Defense-n-Security-Solutions
Table 74 Snapshot – Leonardo

List of Figures

Figure 1 Market Coverage
Figure 2 Research Phases
Figure 3 Secondary Products for Different Parameters
Figure 4 Methodology
Figure 5 Data Mining & Exploration
Figure 6 Data Triangulation
Figure 7 Assumptions for Market Estimation and Forecast
Figure 8 Market Synopsis
Figure 9  Global MDirected Energy Weapon Market - Growth Drivers and Restraints
Figure 10 Competitive Benchmark
Figure 11 Global MDirected Energy Weapon Market Highlight
Figure 12 Global MDirected Energy Weapon Market Size, by Product, 2018 – 2030 (USD Billion)
Figure 13 Global MDirected Energy Weapon Market Size, by Technology 2018 – 2030 (USD Billion)
Figure 14 Global MDirected Energy Weapon Market Size, by Platform 2018 – 2030 (USD Billion)
Figure 15 Global MDirected Energy Weapon Market Size, by  Range   2018 – 2030 (USD Billion)
Figure 16 Global MDirected Energy Weapon Market Size, by Application  2018 – 2030 (USD Billion)
Figure 17 Global MDirected Energy Weapon Market Size, by Region, 2018 – 2030 (USD Billion)
Figure 18 North America MDirected Energy Weapon Market Highlight
Figure 19 North America MDirected Energy Weapon Market Size, by Product, 2018 – 2030 (USD Billion)
Figure 20 North America MDirected Energy Weapon Market Size, by Technology 2018–2030 (USD Billion)
Figure 21 North America MDirected Energy Weapon Market Size, by Platform 2018–2030 (USD Billion)
Figure 22 North America MDirected Energy Weapon Market Size, by  Range   2018–2030 (USD Billion)
Figure 23 Global MDirected Energy Weapon Market Size, by Application  2018 – 2030 (USD Billion)
Figure 24 North America MDirected Energy Weapon Market Size, by Country, 2018 – 2030 (USD Billion)
Figure 25 Europe MDirected Energy Weapon Market Highlight
Figure 26 Europe MDirected Energy Weapon Market Size, by Product, 2018 – 2030 (USD Billion)
Figure 27 Europe MDirected Energy Weapon Market Size, by Technology 2018 – 2030 (USD Billion)
Figure 28 Europe MDirected Energy Weapon Market Size, by Platform 2018 – 2030 (USD Billion)
Figure 29 Europe MDirected Energy Weapon Market Size, by  Range   2018 – 2030 (USD Billion)
Figure 30 Global MDirected Energy Weapon Market Size, by Application   2018 – 2030 (USD Billion)
Figure 31 Europe MDirected Energy Weapon Market Size, by Country, 2018 – 2030 (USD Billion)
Figure 32 Asia-Pacific MDirected Energy Weapon Market Highlight
Figure 33 Asia-Pacific MDirected Energy Weapon Market Size, by Product, 2018 – 2030 (USD Billion)
Figure 34 Asia-Pacific MDirected Energy Weapon Market Size, by Technology 2018 – 2030 (USD Billion)
Figure 35 Asia-Pacific MDirected Energy Weapon Market Size, by Platform 2018 – 2030 (USD Billion)
Figure 36 Asia-Pacific MDirected Energy Weapon Market Size, by  Range   2018 – 2030 (USD Billion)
Figure 37 Global MDirected Energy Weapon Market Size, by Application   2018 – 2030 (USD Billion)
Figure 38 Asia-Pacific MDirected Energy Weapon Market Size, by Country, 2018 – 2030 (USD Billion)
Figure 39 RoW MDirected Energy Weapon Market Highlight
Figure 40 RoW MDirected Energy Weapon Market Size, by Product, 2018 – 2030 (USD Billion)
Figure 41 RoW MDirected Energy Weapon Market Size, by Technology 2018 – 2030 (USD Billion)
Figure 42 RoW MDirected Energy Weapon Market Size, by Platform 2018 – 2030 (USD Billion)
Figure 43 RoW MDirected Energy Weapon Market Size, by  Range   2018 – 2030 (USD Billion)
Figure 44 Global MDirected Energy Weapon Market Size, by Application   2018 – 2030 (USD Billion)
Figure 45 RoW MDirected Energy Weapon Market Size, by Country, 2018 – 2030 (USD Billion)
 

Directed Energy Weapon Market Coverage

Product Insight and Forecast 2025-2030

  • Non-Lethal and Lethal

Technology Insight and Forecast 2025-2030

  • Laser Systems
  • Radio Frequency Systems
  • Particle Beam Systems

Platform Insight and Forecast 2025-2030

  • Land
  • Fuel Tanks
  • Sea and Air

Range  Insight and Forecast 2025-2030

  • Less than 1 km
  • More than 1 km

Application Insight and Forecast 2025-2030

  • Homeland Security and Defense

Global Directed Energy Weapon Market by Region

North America

  • By Product 
  • By Technology
  • By Platform
  • By Range
  • By Application
  • By Country – U.S., Canada, and Mexico

Europe

  • By Product 
  • By Technology
  • By Platform
  • By Range
  • By Application
  • By Country – Germany, U.K., France, Italy, Spain, Russia, and Rest of Europe

Asia-Pacific (APAC)

  • By Product 
  • By Technology
  • By Platform
  • By Range
  • By Application
  • By Country – China, Japan, India, South Korea, and Rest of Asia-Pacific

Rest of the World (RoW)

  • By Product 
  • By Technology
  • By Platform
  • By Range
  • By Application
  • By Country – Brazil, Saudi Arabia, South Africa, U.A.E., and Other Countries
     
  • MBDA
  • Lockheed Martin Corporation
  • Rafael-Advanced-Defense-Systems
  • Rheinmetall AG
  • Northrop-Grumman
  • The Boeing Company
  • RTX Corporation
  • Raytheon-Technologies
  • BAE-Systems
  • Kratos-Defense-n-Security-Solutions
  • Leonardo

Frequently Asked Questions

Industry dynamics include rapid development and deployment of advanced directed energy technologies, increasing defense sector investments, and the adoption of directed energy weapons for countering aerial threats in a cost-effective manner.
Increasing geopolitical tensions, rapid development of advanced directed energy technologies, and the rising threat of aerial threats such as rockets and missiles are driving the growth of the market. Investments in advanced weapon systems and counter-UAV laser systems are key growth drivers.
The market is segmented into Non-Lethal and Lethal products. The lethal division, focusing on military applications like electromagnetic bombs, plasma cannons, microwave guns, and more, is projected to dominate the market.
Directed energy weapons are a type of electromagnetic or particle technology that uses energy, instead of physical projectiles, to strike a target. They utilize concentrated electromagnetic energy rather than kinetic energy.
The Global Directed Energy Weapon Market is expected to reach USD 10.6 billion in 2030 from USD 6.1 billion in 2023 with a compound annual growth rate (CAGR) of 18.9% throughout the forecast period 2025-2030.

Purchase Options

Research Methodology

  •  Desk Research / Pilot Interviews
  •  Build Market Size Model
  •  Research and Analysis
  •  Final Deliverabvle

Connect With Our Sales Team

Key Takeaways