
Ammonium Nitrate Market Size & Share |Growth Forecast Report (2026-2035)
Industry Insight by Application (Explosives, Fertilisers, Other industrial applications), by Grade (Industrial grade, Fertiliser grade), by Physical Form (Prilled, Granular, Solution and other specialised forms), by End User (Agriculture, Mining and quarrying, Construction, Other industrial users)
| Status : Published | Published On : Oct, 2026 | Report Code : VRCH2149 | Industry : Chemicals & Materials | Available Format :

|
Page : 167 |
Ammonium Nitrate Market Overview
The global ammonium nitrate market was estimated at USD 18.25 billion in 2025 and is projected to reach USD 19.24 billion in 2026, expanding at a proposed CAGR of 5.4% from 2026 to 2035 to reach approximately USD 30.88 billion by 2035.
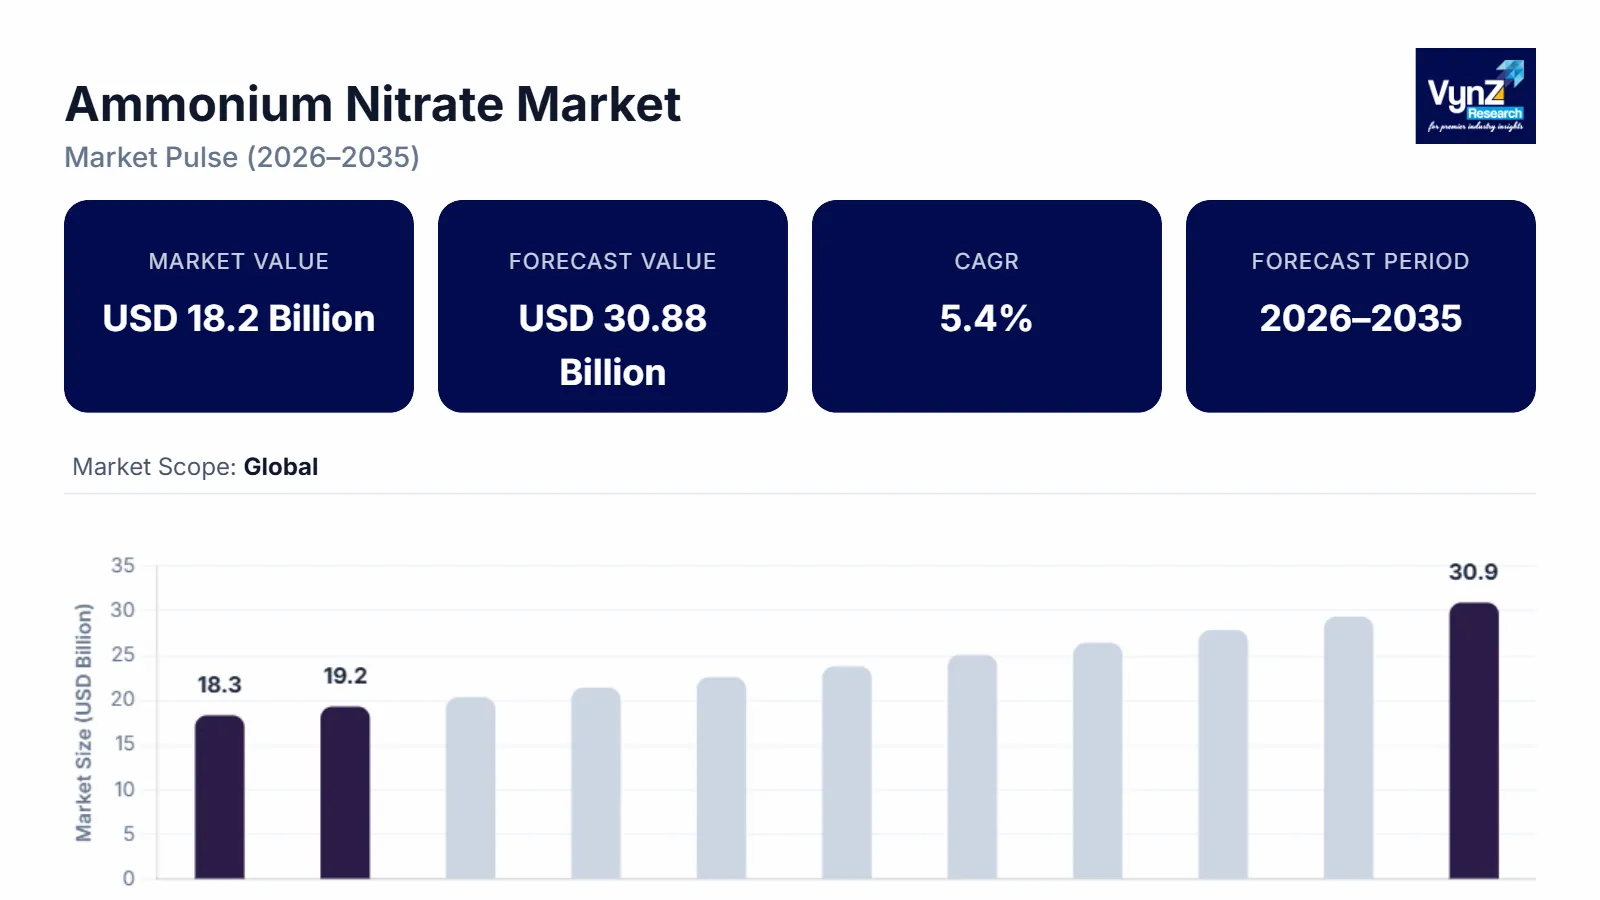
Demand for ammonium nitrate is supported by agricultural nutrient requirements, commercial mining activities, quarrying and infrastructure development. The industry also faces supply chain, energy cost and storage safety challenges, which influence regional pricing and investment decisions. Market growth is driven by agricultural nutrient requirements, mining and infrastructure investment, and efforts to strengthen production and distribution resilience. The USGS identifies ammonia derivatives, including ammonium nitrate, as important agricultural inputs, while OSHA's storage standard highlights the safety requirements associated with handling the material.
Research Methodology
The VynZ Research team evaluates the ammonium nitrate industry through secondary research, company disclosures, government publications, regulatory documents and established market research references. The methodology considers agricultural consumption, mining and quarrying activity, industrial demand, production capacity, feedstock costs, trade conditions and regional market developments. The United States Occupational Safety and Health Administration (OSHA) provides relevant information on ammonium nitrate storage requirements, while the USGS provides data on ammonia production and downstream uses. Market estimates are developed using a consistent forecast model, with assumptions reviewed against available industry evidence.
Research Highlights
- The explosives application held approximately 49% of market revenue in 2025, supported by demand from commercial mining, quarrying and blasting operations.
- The agricultural application represented roughly 43% of 2025 revenue, reflecting the role of nitrogen-based fertilizers in crop production and nutrient management.
- The fertilizer application held nearly 43% of revenue in 2025 linked to crop nutrient requirements.
- Granular product is projected to register a CAGR of approximately 5.8% from 2026 to 2035, supported by commercial blasting requirements and demand for specialized industrial products.
- Asia Pacific is estimated to hold approximately 42% of global revenue in 2025, supported by agricultural consumption, mining activity and industrial demand.
Ammonium Nitrate Market Dynamics
Market Trends
The ammonium nitrate industry is experiencing changes in procurement, production planning and product specifications as agricultural buyers and industrial users place greater emphasis on supply reliability, operating efficiency and regulatory compliance. Industrial demand remains closely linked to commercial blasting, mining and quarrying, while agricultural consumption depends on crop nutrient requirements and fertilizer affordability. The USGS identifies ammonia derivatives as important agricultural products, reinforcing the connection between nitrogen production and downstream fertilizer availability. Another important trend is the development of lower-emission ammonia production and more efficient nitrogen manufacturing processes. Producers are evaluating energy efficiency, feedstock diversification and emissions reduction as part of wider industrial investment strategies. These developments can influence the long-term cost structure of nitrogen-based products, although the commercial benefits depend on energy prices, capital requirements and local production conditions.
Growth Drivers
Demand from mining, quarrying and infrastructure development remains a major growth driver because ammonium nitrate is an important input for authorized commercial blasting applications. Expansion in mineral extraction, construction activity and related industrial operations supports demand for industrial-grade material, particularly where buyers require dependable supply and consistent product specifications. Agricultural demand provides another source of consumption, with nitrogen fertilizers supporting crop nutrient management across major farming regions. The second major driver is the continuing need to maintain agricultural productivity while improving nitrogen use efficiency. Government-backed agricultural programs, crop production requirements and investments in fertilizer supply chains can support demand, although the effect varies with crop prices and affordability. The USGS reports that approximately 88% of domestic US ammonia production in 2025 was directed towards fertilizer uses, including ammonium nitrate and other nitrogen compounds, illustrating the importance of agricultural demand to the wider nitrogen value chain.
Market Restraints / Challenges
The market faces considerable exposure to natural gas prices, ammonia availability, energy costs and transport expenses, which can affect production margins and final selling prices. Disruptions at individual manufacturing facilities may also reduce available supply and increase reliance on imports or alternative suppliers. The operational effects of such interruptions were evident in CF Industries' disclosures concerning its Yazoo City complex, where an incident affected industrial ammonium nitrate production and the expected restoration schedule. Regulatory requirements create another challenge because ammonium nitrate needs controlled storage, handling and transportation. OSHA's standard, 29 CFR 1910.109, addresses storage conditions, fire protection, contamination risks and other workplace requirements. Compliance can increase investment and operating costs for manufacturers, distributors and industrial users, particularly where facilities require upgrades. Differences in national regulations and restrictions on access to certain grades can also complicate international trade and market entry.
Market Opportunities
Investment in mining, quarrying and infrastructure creates opportunities for manufacturers that can offer dependable supply, technical support and products suited to authorised industrial applications. Regional manufacturing capacity and diversified sourcing arrangements can help reduce dependence on individual suppliers, particularly in markets exposed to import interruptions. Producers with established distribution networks and long-term customer relationships may be better positioned to respond to changes in demand and procurement requirements. A further opportunity lies in lower-emission ammonia and improvements in nitrogen production efficiency. Industry investment in low-emission ammonia projects may gradually support changes in the upstream feedstock base, while improved process efficiency can strengthen cost competitiveness.
RD_TABLE
Ammonium Nitrate Market Segmentation
By Application
Explosives represented the largest application category, with an indicative share of 49% in 2025, supported by demand from commercial mining, quarrying and authorized blasting operations.
The agricultural application is estimated to account for approximately 43% of revenue in 2025, with a proposed CAGR of 5.0% through 2035. Demand is linked to crop nutrient requirements, agricultural production and the affordability of nitrogen-based inputs.
By Grade
Industrial-grade material held approximately 58% of the market in 2025, reflecting its use in commercial blasting and related industrial applications.
Fertilizer-grade material is estimated to account for the remaining 42% in 2025, with a proposed CAGR of 4.9% during the forecast period. Its demand is influenced by crop cycles, soil nutrient requirements, fertiliser prices and government agricultural priorities.
By Physical Form
Prilled material accounted for approximately 46% of 2025 revenue, supported by established production and distribution systems.
Granular products are estimated to account for 39% of market revenue in 2025, with a proposed CAGR of 5.8%. Demand varies according to application requirements, product grade and regional infrastructure.
By End User
Agriculture represented approximately 43% of total market revenue in 2025, supported by demand for nitrogen-based crop nutrition.
Mining and quarrying are estimated to account for approximately 35% of revenue in 2025, with a proposed CAGR of 5.8% as mineral extraction and infrastructure-related blasting support industrial demand.
Regional Insights
Asia Pacific
Asia Pacific accounted for approximately 42% of the global ammonium nitrate market in 2025, supported by agricultural demand, mineral extraction and industrial activity. The region's proposed CAGR is 6.0% from 2026 to 2035, making it the fastest-growing regional market in this forecast. China, India and Australia contribute to demand through their agricultural and mining sectors, although the balance between fertilizer and industrial applications differs by country. Government priorities relating to agricultural productivity and mineral resource development can influence regional consumption, while feedstock availability, safety requirements and logistics remain important factors in production and distribution.
Europe
Europe held approximately 24% of global revenue in 2025, with a proposed CAGR of 4.7% through 2035. Demand is supported by established fertilizer consumption, industrial applications and commercial mining activity. Regulatory requirements governing high-nitrogen fertilizers and explosives precursors influence product distribution and storage practices across the region. The European Union's regulatory framework restricts access to certain ammonium nitrate products and establishes safeguards against misuse, creating a market environment in which compliance and traceability are important considerations for suppliers.
North America
North America represented approximately 18% of the market in 2025, with a proposed CAGR of 4.9% from 2026 to 2035. Agricultural demand and commercial mining support consumption, while established nitrogen manufacturing infrastructure influences regional supply. The USGS identifies ammonia derivatives, including ammonium nitrate, among the country's major downstream nitrogen products. However, production interruptions and changes in supply contracts can affect product availability, making supplier diversification and logistics management important for market participants.
Rest of the World
The rest of the world accounted for the remaining 16% of global revenue in 2025, combining Latin America and the Middle East and Africa. The proposed CAGR is 5.2% through 2035, supported by agricultural demand, mineral extraction and investment in industrial infrastructure. Brazil and other Latin American agricultural markets contribute to fertilizer demand, while selected African and Middle Eastern markets rely on mining activity, local production and imports.
Competitive Landscape / Company Insights
The ammonium nitrate market includes integrated nitrogen producers, fertilizer manufacturers and suppliers of industrial explosives. Competition centers on manufacturing capacity, raw material access, distribution networks, product quality and supply reliability. Orica, CF Industries, Yara International and other established companies operate across different parts of the nitrogen and industrial supply chain. Industry disclosures also show the importance of production continuity and diversified sourcing when manufacturing interruptions affect availability. Regulatory compliance, operating efficiency and investment discipline remain important factors shaping competitive positioning.
Mini Profiles
Austin Powder supplies industrial explosives and blasting solutions for mining, quarrying and related markets, connecting its product portfolio with commercial blasting demand.
Borealis operates in the nitrogen and fertilizer value chain, with industrial and agricultural products supported by established manufacturing and distribution capabilities.
CF Industries produces ammonium nitrate and other nitrogen products at its manufacturing complexes, serving fertilizer and commercial explosives applications.
Deepak Fertilizers operates in industrial chemicals and fertilizers, with ammonium nitrate forming part of its wider industrial chemical’s portfolio.
Enaex supplies commercial explosives and blasting services, serving mining customers and supporting industrial demand associated with mineral extraction.
Key Players
- Austin Powder Company
- Borealis AG
- CF Industries Holdings Inc.
- Deepak Fertilisers and Petrochemicals Corporation Ltd.
- Enaex S.A.
- EuroChem Group AG
- Incitec Pivot Limited
- Nutrien Ltd.
- Orica Limited
- Yara International ASA
Recent Developments
Orica Limited strengthened its North American ammonium nitrate supply arrangements by diversifying sourcing across US producers, its Canadian manufacturing operations and its wider supply network. The company also reported supply management measures in Australia following disruptions affecting a third-party ammonia supplier.
Yara International ASA continued to assess investment opportunities in lower-emission ammonia and strengthen its nitrogen business through capital allocation and operational efficiency initiatives. The company subsequently decided not to proceed with the proposed acquisition of ammonia assets in Louisiana and redirected its attention towards alternative US investment opportunities.
Nutrien Ltd reported its full-year 2025 financial results and outlined its operating priorities for 2026, including higher upstream fertilizer sales volumes from its North American plants. Its guidance reflects continued attention to production performance, retail operations and disciplined capital allocation.
Incitec Pivot Limited continued to provide supply updates and support Australian farmers amid international fertilizer market disruptions. Its reported measures included sourcing replacement shipments, monitoring product availability and helping customers plan fertilizer requirements.
EuroChem Group AG introduced Ammonitrate 27 Carbon Light, a lower-carbon ammonium nitrate fertilizer offering for the French agricultural market. The product expands the company's nitrogen fertilizer portfolio and reflects growing industry attention to production emissions and the environmental performance of agricultural inputs.
Global Ammonium Nitrate Market Coverage
Application Insight and Forecast 2026 - 2035
- Explosives
- Fertilisers
- Other industrial applications
Grade Insight and Forecast 2026 - 2035
- Industrial grade
- Fertiliser grade
Physical Form Insight and Forecast 2026 - 2035
- Prilled
- Granular
- Solution and other specialised forms
End User Insight and Forecast 2026 - 2035
- Agriculture
- Mining and quarrying
- Construction
- Other industrial users
Global Ammonium Nitrate Market by Region
- North America
- By Application
- By Grade
- By Physical Form
- By End User
- By Country - U.S., Canada, Mexico
- Europe
- By Application
- By Grade
- By Physical Form
- By End User
- By Country - Germany, U.K., France, Italy, Spain, Russia, Rest of Europe
- Asia-Pacific (APAC)
- By Application
- By Grade
- By Physical Form
- By End User
- By Country - China, Japan, India, South Korea, Vietnam, Thailand, Malaysia, Rest of Asia-Pacific
- Rest of the World (RoW)
- By Application
- By Grade
- By Physical Form
- By End User
- By Country - Brazil, Saudi Arabia, South Africa, U.A.E., Other Countries
Table of Contents for Ammonium Nitrate Market Report
1. Research Overview
1.1. The Report Offers
1.2. Market Coverage
1.2.1. By
Application
1.2.2. By
Grade
1.2.3. By
Physical Form
1.2.4. By
End User
1.3. Research Phases
1.4. Limitations
1.5. Market Methodology
1.5.1. Data Sources
1.5.1.1.
Primary Research
1.5.1.2.
Secondary Research
1.5.2. Methodology
1.5.2.1.
Data Exploration
1.5.2.2.
Forecast Parameters
1.5.2.3.
Data Validation
1.5.2.4.
Assumptions
1.5.3. Study Period & Data Reporting Unit
2. Executive Summary
3. Industry Overview
3.1. Industry Dynamics
3.1.1. Market Growth Drivers
3.1.2. Market Restraints
3.1.3. Key Market Trends
3.1.4. Major Opportunities
3.2. Industry Ecosystem
3.2.1. Porter’s Five Forces Analysis
3.2.2. Recent Development Analysis
3.2.3. Value Chain Analysis
3.3. Competitive Insight
3.3.1. Competitive Position of Industry
Players
3.3.2. Market Attractive Analysis
3.3.3. Market Share Analysis
4. Global Market Estimate and Forecast
4.1. Global Market Overview
4.2. Global Market Estimate and Forecast to 2035
5. Market Segmentation Estimate and Forecast
5.1. By Application
5.1.1. Explosives
5.1.1.1. Market Definition
5.1.1.2. Market Estimation and Forecast to 2035
5.1.2. Fertilisers
5.1.2.1. Market Definition
5.1.2.2. Market Estimation and Forecast to 2035
5.1.3. Other industrial applications
5.1.3.1. Market Definition
5.1.3.2. Market Estimation and Forecast to 2035
5.2. By Grade
5.2.1. Industrial grade
5.2.1.1. Market Definition
5.2.1.2. Market Estimation and Forecast to 2035
5.2.2. Fertiliser grade
5.2.2.1. Market Definition
5.2.2.2. Market Estimation and Forecast to 2035
5.3. By Physical Form
5.3.1. Prilled
5.3.1.1. Market Definition
5.3.1.2. Market Estimation and Forecast to 2035
5.3.2. Granular
5.3.2.1. Market Definition
5.3.2.2. Market Estimation and Forecast to 2035
5.3.3. Solution and other specialised forms
5.3.3.1. Market Definition
5.3.3.2. Market Estimation and Forecast to 2035
5.4. By End User
5.4.1. Agriculture
5.4.1.1. Market Definition
5.4.1.2. Market Estimation and Forecast to 2035
5.4.2. Mining and quarrying
5.4.2.1. Market Definition
5.4.2.2. Market Estimation and Forecast to 2035
5.4.3. Construction
5.4.3.1. Market Definition
5.4.3.2. Market Estimation and Forecast to 2035
5.4.4. Other industrial users
5.4.4.1. Market Definition
5.4.4.2. Market Estimation and Forecast to 2035
6. North America Market Estimate and Forecast
6.1. By
Application
6.2. By
Grade
6.3. By
Physical Form
6.4. By
End User
6.4.1.
U.S. Market Estimate and Forecast
6.4.2.
Canada Market Estimate and Forecast
6.4.3.
Mexico Market Estimate and Forecast
7. Europe Market Estimate and Forecast
7.1. By
Application
7.2. By
Grade
7.3. By
Physical Form
7.4. By
End User
7.4.1.
Germany Market Estimate and Forecast
7.4.2.
France Market Estimate and Forecast
7.4.3.
U.K. Market Estimate and Forecast
7.4.4.
Italy Market Estimate and Forecast
7.4.5.
Spain Market Estimate and Forecast
7.4.6.
Russia Market Estimate and Forecast
7.4.7.
Rest of Europe Market Estimate and Forecast
8. Asia-Pacific (APAC) Market Estimate and Forecast
8.1. By
Application
8.2. By
Grade
8.3. By
Physical Form
8.4. By
End User
8.4.1.
China Market Estimate and Forecast
8.4.2.
Japan Market Estimate and Forecast
8.4.3.
India Market Estimate and Forecast
8.4.4.
South Korea Market Estimate and Forecast
8.4.5.
Rest of Asia-Pacific Market Estimate and Forecast
9. Rest of the World (RoW) Market Estimate and Forecast
9.1. By
Application
9.2. By
Grade
9.3. By
Physical Form
9.4. By
End User
9.4.1.
Brazil Market Estimate and Forecast
9.4.2.
Saudi Arabia Market Estimate and Forecast
9.4.3.
South Africa Market Estimate and Forecast
9.4.4.
U.A.E. Market Estimate and Forecast
9.4.5.
Other Countries Market Estimate and Forecast
10. Company Profiles
10.1.
Austin Powder Company
10.1.1.
Snapshot
10.1.2.
Overview
10.1.3.
Offerings
10.1.4.
Financial
Insight
10.1.5.
Recent
Developments
10.2.
Borealis AG
10.2.1.
Snapshot
10.2.2.
Overview
10.2.3.
Offerings
10.2.4.
Financial
Insight
10.2.5.
Recent
Developments
10.3.
CF Industries Holdings Inc.
10.3.1.
Snapshot
10.3.2.
Overview
10.3.3.
Offerings
10.3.4.
Financial
Insight
10.3.5.
Recent
Developments
10.4.
Deepak Fertilisers and Petrochemicals Corporation Ltd.
10.4.1.
Snapshot
10.4.2.
Overview
10.4.3.
Offerings
10.4.4.
Financial
Insight
10.4.5.
Recent
Developments
10.5.
Enaex S.A.
10.5.1.
Snapshot
10.5.2.
Overview
10.5.3.
Offerings
10.5.4.
Financial
Insight
10.5.5.
Recent
Developments
10.6.
EuroChem Group AG
10.6.1.
Snapshot
10.6.2.
Overview
10.6.3.
Offerings
10.6.4.
Financial
Insight
10.6.5.
Recent
Developments
10.7.
Incitec Pivot Limited
10.7.1.
Snapshot
10.7.2.
Overview
10.7.3.
Offerings
10.7.4.
Financial
Insight
10.7.5.
Recent
Developments
10.8.
Nutrien Ltd.
10.8.1.
Snapshot
10.8.2.
Overview
10.8.3.
Offerings
10.8.4.
Financial
Insight
10.8.5.
Recent
Developments
10.9.
Orica Limited
10.9.1.
Snapshot
10.9.2.
Overview
10.9.3.
Offerings
10.9.4.
Financial
Insight
10.9.5.
Recent
Developments
10.10.
Yara International ASA
10.10.1.
Snapshot
10.10.2.
Overview
10.10.3.
Offerings
10.10.4.
Financial
Insight
10.10.5.
Recent
Developments
11. Appendix
11.1. Exchange Rates
11.2. Abbreviations
Note: Financial insight and recent developments of different companies are subject to the availability of information in the secondary domain.
Frequently Asked Questions
Purchase Options
Latest Report
Research Methodology
- Desk Research / Pilot Interviews
- Build Market Size Model
- Research and Analysis
- Final Deliverable
Connect With Our Sales Team
- Toll-Free: +1-888-253-3960
- Phone: +91 9960 288 381
- Email: enquiry@vynzresearch.com
Ammonium Nitrate Market