| Status : Published | Published On : Mar, 2025 | Report Code : VRCH 2067 | Industry : Chemicals & Materials | Available Format :   | Page : 194 | 
The global biopesticides market is expected to grow from USD 4.6 billion in 2025 to reach USD 7.5 billion by 2035 at a CAGR of 15.3% within the projected period from 2026 to 2035.
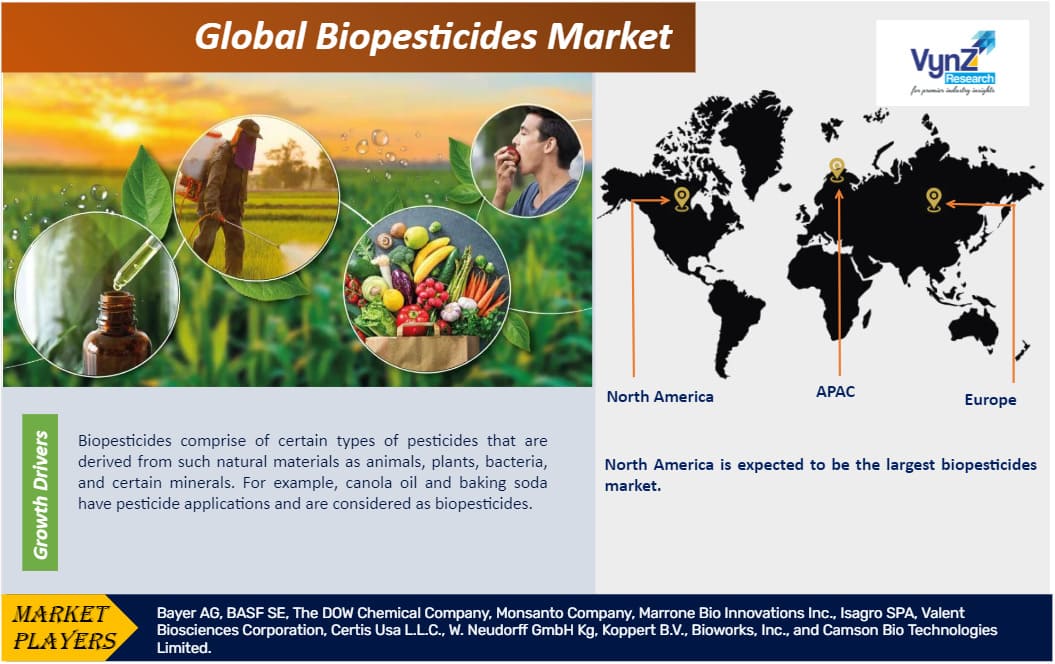
Biopesticides refer to specific types of pesticides derived from animals, plants, bacteria, and a few particular minerals. They help commercial growers in producing healthy and affordable crops. The biopesticides usually use targeted modes of action. This allows commercial growers to preserve beneficial insect or natural predator populations in their fields and also helps relying less on traditional chemical pesticides. So, the benefit of using biopesticides in agriculture is related indirectly to the health of humans being an integral aspect of integrated pest management programs.
The global biopesticides market is growing significantly due to the wide range of benefits offered to commercial growers, shippers, food processors, retailers, and end users. Moreover, they make a handsome contribution in the field of food and also in different applications for managing diseases and mosquito controlfor the betterment of public health.Biopesticides also help in the protection of forests, turf, and ornamentals. All these features push it demand and adoption and its market as a consequence.

The growth of the global biopesticides market is somewhat restricted due to the lack of awareness about the benefits of using them. However, significant growth opportunities are offered to the market due to thew increasing growth in bio-control seed treatment solutions.
The global biopesticides market is divided on the basis of type of biopesticides into bioinsecticides, bio fungicides, bioherbicides, bionematicides, and other segments. Among these categories, the bionematicides segment is expected to grow at the higher rate during the forecast period due to their widespread adoption and usage in seed treatment and the rising focus on new product development of bionematicides by crop protection companies.
The global biopesticides market is divided on the basis of crop type into grains & oilseeds, fruits & vegetables, and other segments. The demand for biopesticides in the fruits and vegetables category remained the highest during the historical period and is also expected to contribute the largest share during the forecast period due to higher consumer demand and consumption of fruits and vegetables that are pesticidefree. It is also attributed to the growing adoption by the marketers.
The global biopesticides market is divided on the basis of application into seed treatment, soil treatment, foliar spray, and post-harvest segments. During the forecast period, the market for application of biopesticides via foliar spray is expected to grow at a higher rate due to easy availability and the lower cost in comparison to other categories. It is also attributed to the convenience in use and the ability to help in covering the overall area of the leaf. Moreover, the growth is also facilitated due to its ability to cutdown the problems related to leaching in soils.
The global biopesticides market is divided on the basis of origininto microbial pesticides, biochemical pesticides, plant-incorporated protectants, and beneficial insects segments.Out of all these segments, the segment that is likely to witness higher growth during the forecast period in the microbial pesticides category due to the growing demand for sustainable agricultural practices and its ability to provide environmentally friendly solutions. They are also very effective in pest management and reduce harmful effects caused to the beneficial organisms due to their use. They also reduce chemical residues. The growth of the segment is also attributed to the increasing regulatory support and consumer preference for organic products.
| Report Metric | Details | 
| Historical Period | 2020 - 2024 | 
| Base Year Considered | 2025 | 
| Forecast Period | 2026 - 2035 | 
| Market Size in 2025 | U.S.D. 4.6 Billion | 
| Revenue Forecast in 2035 | U.S.D. 7.5 Billion | 
| Growth Rate | 15.3% | 
| Segments Covered in the Report | By Type, By Crop Type, By Mode of Application, By Origin, By Formulation | 
| Report Scope | Market Trends, Drivers, and Restraints; Revenue Estimation and Forecast; Segmentation Analysis; Impact of COVID-19; Companies’ Strategic Developments; Market Share Analysis of Key Players; Company Profiling | 
| Regions Covered in the Report | U.S., Canada, U.K., Germany, France, Italy, Spain, Russia, China, Japan, India, Australia, Thailand, South Korea, Brazil, Mexico, Argentina, Saudi Arabia, U.A.E., South Africa, Nigeria) | 
The growing consumer awareness and demand for organic food is as safer alternatives to synthetic chemicals is a notable trend of the global biopesticides market. There are also significant developments noticed in biotechnology that has enhanced the efficiency and specificity of biopesticides. In addition, the favorable government policies and support are promoting sustainable agricultural practices and reducing chemical residues on crops. Other notable trends in the industry include the increased adoption in emerging economiesdue to growth in agricultural productivity and regulatory changes favoring environmentally friendly solutions as well as collaborations between biotech companies, agricultural input providers, and research institutions.
The growing awareness among people regarding the hazards associated with the use of chemical pesticides is one primary factor for the widespread use of biopesticides and its market growth.The expansion of the global biopesticides market is also attributed to the rising demand for organic food and the drastic decrease in the use of synthetic fertilizers due to the harmful effects on human health. Biopesticides are considered to be a far better and friendlier option for non-targeted species and to eliminate the chances of negative health effects on humans. Another significant factor for the growth of the market is the reduced cost of production for the commercial growers because the biological pesticide products occur in a natural manner. These are therefore relatively cheaper as compared to chemical pesticides since the cost of manufacturing is low. In addition, several government programs to grow the awareness of the biopesticides are resulting in higher preference as compared to the chemical pesticides among the growers to implement them in their agricultural activities.
The widespread expansion of the global biopesticides market is hindered due to the lower adoption rate of biopesticides especially in the agricultural sector in some economies. In addition, the limited efficiency of a few specific type of biopesticides, strict regulatory requirements for approval and registration, lack of awareness and misconceptions about effectiveness, higher production and application costs, challenges in scaling up production and distribution networks due to supply chain issues, need for specialized knowledge and skills for effective application, and compatibility issues with existing farming practices and integrated pest management systems are come other hindrances to the growth of the global biopesticides market.
One significant growth opportunity of the global biopesticides marketis the higher preference and adoption of essential oil-based insecticides in organic agriculture. The widespreadobtainability of essential oils from the flavor and fragrance industries has expedited commercialization of essential oil-based pesticides and is therefore driving the growth of the global biopesticides market.
The North American market is expected to hold the largest share of the market and will grow more during the forecast period because biopesticides help the region to promote healthy crops. This increases the frequency of sales of the commercial crops. In addition, the growing demand for organic food and stringent food safety regulations are major factors driving the growth of the North American biopesticides market.
The Asia-Pacific market will grow due to rising awareness among farmers and consumers about the harmful effects of chemical pesticides on health and the environment, government initiatives and support to promote sustainable agricultural practices, growing demand for organic food and expanding organic farming sector, continuous advancements in biotechnology, and rapid economic growth in developing countries such as India and China.
Some of the key players operating in the global biopesticides industry are Bayer AG, BASF SE, The DOW Chemical Company, Monsanto Company, Marrone Bio Innovations Inc., Isagro SPA, Valent Biosciences Corporation, Certis Usa L.L.C., W. Neudorff GmbH Kg, Koppert B.V., Bioworks, Inc., and Camson Bio Technologies Limited.
Bayer AG produces and markets healthcare and agricultural products. The Company manufactures products that include aspirin, antibiotics, anti-infectives, cardiovascular, oncology, central nervous system drugs, over-the-counter medications, diagnostics, and animal health products, as well as crop protection products, plastics, and polyurethanes.
BASF SE, an initialism of its original name Badische Anilin- und Sodafabrik, is a European multinational company and the largest chemical producer in the world.
Recent Developments by Key Players
BASF together with the world’s first castor bean program Pragati, introduces certified traceability for bio-based solutions in footwear. Pragati was established with the unified sustainability code SuCCESS (Sustainable Castor Caring for Environmental and Social Standards) that sets a standard for certified sustainable castor oil.
Valent BioSciences launched the new Venburg Wing at the company’s Melnik and Shafer Biorational Research Center in Libertyville, Illinois.
The Biopesticides Market report offers a comprehensive market segmentation analysis along with an estimation for the forecast period 2026–2035.
Segments Covered in the Report
Region Covered in the Report
.png)
Source: VynZ Research
.png)
Source: VynZ Research
1. Research Overview
        1.1. The Report Offers
        1.2. Market Coverage
                1.2.1. By Device Type
                1.2.2. By Crop Type
                1.2.3. By Mode of Application
                1.2.4. By Origin
                1.2.5. By Formulation
                1.2.6. By Region
        1.3. Research Phases
        1.4. Limitations
        1.5. Market Size Estimations and Forecast
                1.5.1. Data Sources
                        1.5.1.1. Primary Research
                        1.5.1.2. Secondary Research
                1.5.2. Methodology
                        1.5.2.1. Data Exploration
                        1.5.2.2. Forecast Parameters
                        1.5.2.3. Data Validation
                        1.5.2.4. Assumptions
                1.5.3. Study Period& Data Reporting Unit
2. Executive Summary
3. Market Definition
        3.1. By Type
                3.1.1. Bioinsecticides
                3.1.2. Biofungicides
                3.1.3. Bioherbicides
                3.1.4. Bionematicides
                3.1.5. Others
        3.2. By Crop Type
                3.2.1. Grains & Oilseeds
                3.2.2. Fruits & Vegetables
                3.2.3. Others
        3.3. By Mode of Application
                3.3.1. Seed Treatment
                3.3.2. Soil Treatment
                3.3.3. Foliar Spray
                3.3.4. Post-Harvest
        3.4. By Origin
                3.4.1. Microbial Pesticides
                3.4.2. Biochemical Pesticides
                3.4.3. Plant-Incorporated Protectants
                3.4.4. Beneficial Insects
        3.5. By Formulation
                3.5.1. Liquid
                3.5.2. Dry
4. Industry Overview
        4.1. Industry Dynamics
                4.1.1. Major Drivers
                4.1.2. Major Restraints
                4.1.3. Key Trends
                4.1.4. Key Opportunities
        4.2. Industry Ecosystem
                4.2.1. Porter’s Five Forces Analysis
                4.2.2. Strategic Development Analysis
        4.3. Competitive Insight
                4.3.1. Competitive Analysis of Key Players
                4.3.2. Market Attractiveness Analysis
5. North America Market Estimate and Forecast
        5.1. By Device Type
        5.2. By Crop Type
        5.3. By Mode of Application
        5.4. By Origin
        5.5. By Formulation
        5.6. By Country
                5.6.1. U.S. Market Estimate and Forecast
                5.6.2. Canada Market Estimate and Forecast
                5.6.3. Mexico Market Estimate and Forecast
6. Europe Market Estimate and Forecast
        6.1. By Device Type
        6.2. By Crop Type
        6.3. By Mode of Application
        6.4. By Origin
        6.5. By Formulation
        6.6. By Country
                        6.6.1. Germany Market Estimate and Forecast
                        6.6.2. France Market Estimate and Forecast
                        6.6.3. U.K. Market Estimate and Forecast
                        6.6.4. Italy Market Estimate and Forecast
                        6.6.5. Spain Market Estimate and Forecast
                        6.6.6. Russia Market Estimate and Forecast
                        6.6.7. Rest of Europe Market Estimate and Forecast
7. Asia-Pacific Market Estimate and Forecast
        7.1. By Device Type
        7.2. By Crop Type
        7.3. By Mode of Application
        7.4. By Origin
        7.5. By Formulation
        7.6. By Country
                        7.6.1. China Market Estimate and Forecast
                        7.6.2. Japan Market Estimate and Forecast
                        7.6.3. India Market Estimate and Forecast
                        7.6.4. South Korea Market Estimate and Forecast
                        7.6.5. Rest of Asia-Pacific Market Estimate and Forecast
8. Latin America Market Estimate and Forecast
        8.1. By Device Type
        8.2. By Crop Type
        8.3. By Mode of Application
        8.4. By Origin
        8.5. By Formulation
        8.6. By Country
                8.6.1. Brazil Market Estimate and Forecast
                8.6.2. Argentina Market Estimate and Forecast
                8.6.3. Rest of Latin America Market Estimate and Forecast
9. Middle East & Africa Market Estimate and Forecast
        9.1. By Device Type
        9.2. By Crop Type
        9.3. By Mode of Application
        9.4. By Origin
        9.5. By Formulation
        9.6. By Country
                9.6.1. U.A.E Market Estimate and Forecast
                9.6.2. Saudi Arabia Market Estimate and Forecast
                9.6.3. South Africa Market Estimate and Forecast
                9.6.4. Rest of MEA Market Estimate and Forecast
10. Company Profiles
        10.1. BASF SE
                10.1.1. Snapshot
                10.1.2. Overview
                10.1.3. Offerings
                10.1.4. Financial Insight
                10.1.5. Recent Developments
        10.2. BAYER AG
                10.2.1. Snapshot
                10.2.2. Overview
                10.2.3. Offerings
                10.2.4. Financial Insight
                10.2.5. Recent Developments
        10.3. SYNGENTA AG
                10.3.1. Snapshot
                10.3.2. Overview
                10.3.3. Offerings
                10.3.4. Financial Insight
                10.3.5. Recent Developments
        10.4. UPL LIMITED
                10.4.1. Snapshot
                10.4.2. Overview
                10.4.3. Offerings
                10.4.4. Financial Insight
                10.4.5. Recent Developments
        10.5. FMC CORPORATION
                10.5.1. Snapshot
                10.5.2. Overview
                10.5.3. Offerings
                10.5.4. Financial Insight
                10.5.5. Recent Developments
        10.6. MARRONE BIO INNOVATIONS
                10.6.1. Snapshot
                10.6.2. Overview
                10.6.3. Offerings
                10.6.4. Financial Insight
                10.6.5. Recent Developments
        10.7. NOVOZYMES A/S
                10.7.1. Snapshot
                10.7.2. Overview
                10.7.3. Offerings
                10.7.4. Financial Insight
                10.7.5. Recent Developments
        10.8. NUFARM
                10.8.1. Snapshot
                10.8.2. Overview
                10.8.3. Offerings
                10.8.4. Financial Insight
                10.8.5. Recent Developments
        10.9. ISAGRO S.P.A
                10.9.1. Snapshot
                10.9.2. Overview
                10.9.3. Offerings
                10.9.4. Financial Insight
                10.9.5. Recent Developments
        10.10.CERTIS USA L.L.C
                10.10.1. Snapshot
                10.10.2. Overview
                10.10.3. Offerings
                10.10.4. Financial Insight
                10.10.5. Recent Developments
11. Appendix
        11.1. Exchange Rates
        11.2. Abbreviations
Note: Financial insights are subject to availability of information in secondary domain.
List of Tables
Table 1 Sources
Table 2 Study Periods
Table 3 Data Reporting Unit
Table 4 Global Biopesticides Market Market Size, by Type,2018-2023(USD Billion)
Table 5 Global Biopesticides Market Market Size, by Type,2025-2030 (USD Billion)
Table 6 Global Biopesticides Market Market Size, by Crop Type,2018-2023(USD Billion)
Table 7 Global Biopesticides Market Market Size, by Crop Type,2025-2030 (USD Billion)
Table 8 Global Biopesticides Market Market Size, by Mode of Application,2018-2023(USD Billion)
Table 9 Global Biopesticides Market Market Size, by Mode of Application,2025-2030 (USD Billion)
Table 10 Global Biopesticides Market Market Size, by Mode of Origin,2018-2023(USD Billion)
Table 11 Global Biopesticides Market Market Size, by Mode of Origin,2025-2030 (USD Billion)
Table 12 Global Biopesticides Market Market Size, by Region,2018-2023(USD Billion)
Table 13 Global Biopesticides Market Market Size, by Region,2025-2030 (USD Billion)
Table 14 North America Biopesticides Market Market Size, by Type,2018-2023(USD Billion)
Table 15 North America Biopesticides Market Market Size, by Type,2025-2030 (USD Billion)
Table 16 North America Biopesticides Market Market Size, by Crop Type,2018-2023(USD Billion)
Table 17 North America Biopesticides Market Market Size, by Crop Type,2025-2030 (USD Billion)
Table 18 North America Biopesticides Market Market Size, by Mode of Application,2018-2023(USD Billion)
Table 19 North America Biopesticides Market Market Size, by Mode of Application,2025-2030 (USD Billion)
Table 20 North America Biopesticides Market Market Size, by Origin,2018-2023(USD Billion)
Table 21 North America Biopesticides Market Market Size, by Origin,2025-2030 (USD Billion)
Table 22 North America Biopesticides Market Market Size, by Country,2018-2023(USD Billion)
Table 23 North America Biopesticides Market Market Size, by Country,2025-2030 (USD Billion)
Table 24 Europe Biopesticides Market Market Size, by Type,2018-2023(USD Billion)
Table 25 Europe Biopesticides Market Market Size, by Type,2025-2030 (USD Billion)
Table 26 Europe Biopesticides Market Market Size, by Crop Type,2018-2023(USD Billion)
Table 27 Europe Biopesticides Market Market Size, by Crop Type,2025-2030 (USD Billion)
Table 28 Europe Biopesticides Market Market Size, by Mode of Application,2018-2023(USD Billion)
Table 29 Europe Biopesticides Market Market Size, by Mode of Application,2025-2030 (USD Billion)
Table 30 Europe Biopesticides Market Market Size, by Origin,2018-2023(USD Billion)
Table 31 Europe Biopesticides Market Market Size, by Origin,2025-2030 (USD Billion)
Table 32 Europe Biopesticides Market Market Size, by Country,2018-2023(USD Billion)
Table 33 Europe Biopesticides Market Market Size, by Country,2025-2030 (USD Billion)
Table 34 Asia-Pacific Biopesticides Market Market Size, by Type,2018-2023(USD Billion)
Table 35 Asia-Pacific Biopesticides Market Market Size, by Type,2025-2030 (USD Billion)
Table 36 Asia-Pacific Biopesticides Market Market Size, by Crop Type,2018-2023(USD Billion)
Table 37 Asia-Pacific Biopesticides Market Market Size, by Crop Type,2025-2030 (USD Billion)
Table 38 Asia-Pacific Biopesticides Market Market Size, by Mode of Application,2018-2023(USD Billion)
Table 39 Asia-Pacific Biopesticides Market Market Size, by Mode of Application,2025-2030 (USD Billion)
Table 40 Asia-Pacific Biopesticides Market Market Size, by Origin,2018-2023(USD Billion)
Table 41 Asia-Pacific Biopesticides Market Market Size, by Origin,2025-2030 (USD Billion)
Table 42 Asia-Pacific Biopesticides Market Market Size, by Country,2018-2023(USD Billion)
Table 43 Asia-Pacific Biopesticides Market Market Size, by Country,2025-2030 (USD Billion)
Table 44 RoW Biopesticides Market Market Size, by Type,2018-2023(USD Billion)
Table 45 RoW Biopesticides Market Market Size, by Type,2025-2030 (USD Billion)
Table 46 RoW Biopesticides Market Market Size, by Crop Type,2018-2023(USD Billion)
Table 47 RoW Biopesticides Market Market Size, by Crop Type,2025-2030 (USD Billion)
Table 48 RoW Biopesticides Market Market Size, by Mode of Application,2018-2023(USD Billion)
Table 49 RoW Biopesticides Market Market Size, by Mode of Application,2025-2030 (USD Billion)
Table 50 RoW Biopesticides Market Market Size, by Origin,2018-2023(USD Billion)
Table 51 RoW Biopesticides Market Market Size, by Origin,2025-2030 (USD Billion)
Table 52 RoW Biopesticides Market Market Size, by Country,2018-2023(USD Billion)
Table 53 RoW Biopesticides Market Market Size, by Country,2025-2030 (USD Billion)
Table 54 Snapshot – Bayer AG
Table 55 Snapshot – BASF SE
Table 56 Snapshot – The DOW Chemical Company
Table 57 Snapshot – Monsanto Company
Table 58 Snapshot – Marrone Bio Innovations Inc.
Table 59 Snapshot – Isagro SPA
Table 60 Snapshot – Valent Biosciences Corporation
Table 61 Snapshot – Certis Usa L.L.C.
Table 62 Snapshot – W. Neudorff GmbH Kg
Table 63 Snapshot – Koppert B.V.
Table 64 Snapshot – Bioworks, Inc.
Table 65 Snapshot – Camson Bio Technologies Limited
List of Figures
Figure 1 Market Coverage
Figure 2 Research Phases
Figure 3 Secondary Types for Different Parameters
Figure 4 Methodology
Figure 5 Data Mining & Exploration
Figure 6 Data Triangulation
Figure 7 Assumptions for Market Estimation and Forecast
Figure 8 Market Synopsis
Figure 9 Global Biopesticides Market Market - Growth Drivers and Restraints
Figure 10 Competitive Benchmark
Figure 11 Global Biopesticides Market Market Highlight
Figure 12 Global Biopesticides Market Market Size, by Type, 2018 - 2030 (USD Billion)
Figure 13 Global Biopesticides Market Market Size, by Crop Type, 2018 - 2030 (USD Billion)
Figure 14 Global Biopesticides Market Market Size, by Mode of Application, 2018 - 2030 (USD Billion)
Figure 15 Global Biopesticides Market Market Size, by Origin, 2018 - 2030 (USD Billion)
Figure 16 Global Biopesticides Market Market Size, by Region, 2018 - 2030 (USD Billion)
Figure 17 North America Biopesticides Market Market Highlight
Figure 18 North America Biopesticides Market Market Size, by Type, 2018 - 2030 (USD Billion)
Figure 19 North America Biopesticides Market Market Size, by Crop Type, 2018 - 2030 (USD Billion)
Figure 20 North America Biopesticides Market Market Size, by Mode of Application, 2018 - 2030 (USD Billion)
Figure 21 North America Biopesticides Market Market Size, by Origin, 2018 - 2030 (USD Billion)
Figure 22 North America Biopesticides Market Market Size, by Country, 2018 - 2030 (USD Billion)
Figure 23 Europe Biopesticides Market Market Highlight
Figure 24 Europe Biopesticides Market Market Size, by Type, 2018 - 2030 (USD Billion)
Figure 25 Europe Biopesticides Market Market Size, by Crop Type, 2018 - 2030 (USD Billion)
Figure 26 Europe Biopesticides Market Market Size, by Mode of Application, 2018 - 2030 (USD Billion)
Figure 27 Europe Biopesticides Market Market Size, by Origin, 2018 - 2030 (USD Billion)
Figure 28 Europe Biopesticides Market Market Size, by Country, 2018 - 2030 (USD Billion)
Figure 29 Asia-Pacific Biopesticides Market Market Highlight
Figure 30 Asia-Pacific Biopesticides Market Market Size, by Type, 2018 - 2030 (USD Billion)
Figure 31 Asia-Pacific Biopesticides Market Market Size, by Crop Type, 2018 - 2030 (USD Billion)
Figure 32 Asia-Pacific Biopesticides Market Market Size, by Mode of Application, 2018 - 2030 (USD Billion)
Figure 33 Asia-Pacific Biopesticides Market Market Size, by Origin, 2018 - 2030 (USD Billion)
Figure 34 Asia-Pacific Biopesticides Market Market Size, by Country, 2018 - 2030 (USD Billion)
Figure 35 RoW Biopesticides Market Market Highlight
Figure 36 RoW Biopesticides Market Market Size, by Type, 2018 - 2030 (USD Billion)
Figure 37 RoW Biopesticides Market Market Size, by Crop Type, 2018 - 2030 (USD Billion)
Figure 38 RoW Biopesticides Market Market Size, by Mode of Application, 2018 - 2030 (USD Billion)
Figure 39 RoW Biopesticides Market Market Size, by Origin, 2018 - 2030 (USD Billion)
Figure 40 RoW Biopesticides Market Market Size, by Country, 2018 - 2030 (USD Billion)
Global Biopesticides Market Coverage
Type Insight and Forecast 2025-2030
Crop Type Insight and Forecast 2025-2030
Mode of Application Insight and Forecast 2025-2030
Origin Insight and Forecast 2025-2030
Formulation Insight and Forecast 2025-2030
Geographical Segmentation
Biopesticides Market by Region
North America
Europe
Asia-Pacific (APAC)
Rest of the World (RoW)
Vynz Research know in your business needs, you required specific answers pertaining to the market, Hence, our experts and analyst can provide you the customized research support on your specific needs.
After the purchase of current report, you can claim certain degree of free customization within the scope of the research.
Please let us know, how we can serve you better with your specific requirements to your research needs. Vynz research promises for quick reversal for your current business requirements.
Purchase Options
Latest Report
Research Methodology
Connect With Our Sales Team
