Mattress Market Overview
The Global Mattress Market was valued at USD 48.6 billion in 2023, and the market is expected to reach 78.3 billion by 2030 with a growth of CAGR 6.7% during the forecasted period.
A mattress refers to a large, rectangular pad with perfect cushioning to support the body of a person while sleeping. Ade from different materials, these mattresses are comfortable, reduces pressure points, promotes relaxation, and enhances sleep quality, and are therefore essential for every family and home.
The market is divided into different segments where each section or its subsection has a huge potential for growth. For example, it is divided by its different product types where the innerspring mattress segment dominates the market and specialty mattresses growing steadily.
It is divided by different sizes where queen-size mattresses are higher in demand than other segments just as the residential segment has in comparison to commercial segment which are the two other divisions of the global mattress market based on their end use.
And, according to distribution channels, the market is divided into offline and online segments where offline channel segment dominates the market but the online segment is also doing well and showing greater promise for growth during the forecast period.
Mattress Market Segmentation
Insight by Product
The global mattress market is divided into innerspring, memory foam, latex, and other segments based on its product types. Out of these segments the innerspring mattress segment dominates the market due to higher market share and lower price compared to the others, which, however, depends on several factors such as size and number of spring coils in it.
However, during the forecast period, the segment of other specialty mattresses will grow and will bring down the market share of the innerspring mattress segment.
Insight by Size
According to the size of the mattresses, the market is divided into single-size mattresses, double-size mattresses, queen-size mattresses, and king-size mattresses. Out of these four segments, during the forecast period, the queen-size mattress segment is expected to have the largest share of the market due to the growth in demand. It does not take too much space to accommodate two persons, which increases its demand especially for smaller bedrooms.
Insight by End-Use
The global mattress market is divided into commercial and residential segments based on their end use. Out of these two segments, during the forecast period, the residential segment is expected to grow at a faster rate than the commercial segment due to higher disposable income among middle-class families.
Insights by Distribution Channels
The global mattress type is also divided by the distribution channels into offline and online segments. The offline segment is further divided into general stores, specialty stores, hypermarket, and supermarket subsections.
Out of the two, the offline segment dominates the market and will continue to grow at a higher CAGR during the forecast period due to its larger share of revenue. Also, it is a favored mode of purchase among people since they can touch and feel the product they want to purchase before making their buying decisions.
The online channels are also expected to grow at a faster rate during the forecast period due to lower cost of operation, faster doorstep delivery, and wider collection to choose from.
Global Mattress Market Report Coverage
|
Report Metric
|
Details
|
|
Historical Period
|
2020 - 2024
|
|
Base Year Considered
|
2025
|
|
Forecast Period
|
2026 - 2035
|
|
Market Size in 2025
|
U.S.D. 48.6 Billion
|
|
Revenue Forecast in 2035
|
U.S.D. 78.3 Billion
|
|
Growth Rate
|
6.7%
|
|
Segments Covered in the Report
|
By Product, By Size and By End-Use
|
|
Report Scope
|
Market Trends, Drivers, and Restraints; Revenue Estimation and Forecast; Segmentation Analysis; Companies’ Strategic Developments; Market Share Analysis of Key Players; Company Profiling
|
|
Regions Covered in the Report
|
North America, Europe, Asia-Pacific, Middle East, and Rest of the World
|
Industry Dynamics
Mattress Industry Trends
There is an increase in housing construction over the few years all over the globe due to rapid urbanization which is increasing the demand for mattresses.
People with higher disposable income tend to spend more on home furnishing, especially bedding and furniture items, which is also a significant market trend propelling its growth.
There is a growing willingness among consumers to invest more in better sleeping solutions due to their growing health issues and concerns.
There is a growing change in the lifestyle of people especially with a large number of people moving to urban from rural locations, thereby increasing the demand for mattresses than handmade cotton variants.
There is a significant rise in the number of new entrants into the market due to the increased focus on the mounting trends of mattresses forcing them to diversify their product offerings. Their aggressive marketing approaches along with better products is a significant trend that influences the global mattress market.
Use of innovative technologies to showcase the features and craftsmanship of the mattresses is also noticed. This raises the interest among people to buy these products.
Mattress Market Growth Drivers
The rise in disposable income among the middle-class people will propel the growth of the global mattress market, especially due to the higher demand for residential use.
Another significant factor for the growth of the market is the rising awareness among people regarding the benefits offered by these mattresses in comparison to the chemical-based variants.
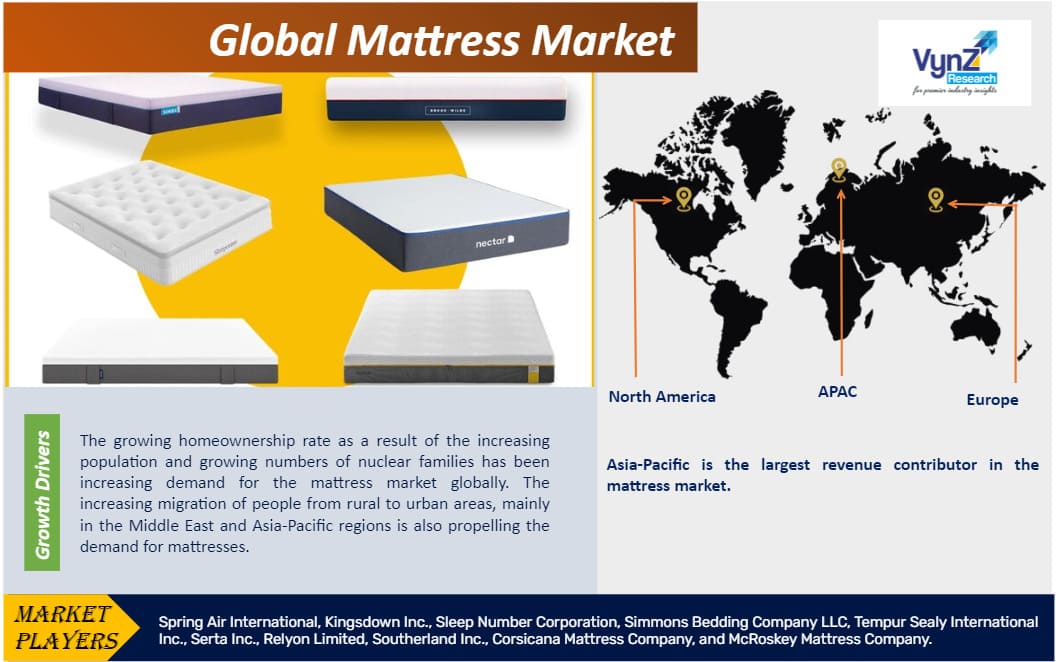
The rise in homeownership rate also influences the growth of the market, especially in the residential sector and the increased number of houses with more bedrooms facilitates its growth as well. It is also applicable to nuclear families which are growing in number especially in the urban regions.
There is a notable shift of population from rural to urban locations over the past few years, especially in the Asia-Pacific and Middle East regions. This is resulting in the rise in demand for mattresses.
Mattress Market Challenges
The fluctuating prices of raw materials due to the change in price of steel-based and petroleum products, high cost, shifting consumer preferences, stricter regulatory compliance requirements, and supply chain disruptions may hinder the growth of the global mattress market.
Mattress Market Opportunities
The rising consciousness over health among people and the rise in demand for eco-friendly mattresses, technological advancements and innovations, customization possibilities, and manufacturing sustainable products are creating new opportunities for the market to grow.
Mattress Market Geographic Overview
North America dominates the mattress market due to the larger share and will continue to grow at a reasonably high CAGR. This growth is mainly attributed to the higher number of major players in the industry in this region and a higher demand among people for better quality mattresses.
However, the Asia-Pacific market is the largest contributor in terms of revenue due to the rising population and growing intent of people with higher disposable income to shift to urban locations from rural places. Moreover, in countries like China and India, there is a significant growth in the hospitality and healthcare sectors, where such mattresses have a huge demand. Government initiatives here are also favorable to meet the gap between demand and supply, facilitating the growth of the market in this region.
Mattress Market Competitive Insight
Key players operating in the global mattress market include Spring Air International, Kingsdown Inc., Sleep Number Corporation, Simmons Bedding Company LLC, Tempur Sealy International Inc., Serta Inc., Relyon Limited, Southerland Inc., Corsicana Mattress Company, and McRoskey Mattress Company.
Recent Development by Key Players
Kingsdown is heading to the Winter Las Vegas Market with significant new additions to its well-received K2 by Kingsdown™ all foam product line, and substantial revamps to its best-selling luxury Vintage CoutureTM and Insignia hybrid collections.
Serta Simmons Bedding, LLC (SSB) had arranged for ribbon-cutting ceremony for its new state-of-the-art 500,000 square foot manufacturing plant in Wisconsin that will produce mattresses and other bedding products under its Serta, Beautyrest and Simmons brands. SSB has long had a manufacturing presence in Rock County. SSB expects to create additional jobs at the plant over the next few years as the business regains lost market share.
Forecast Parameters
• Identifying variables and establishing market impact.
• Establishing market trends regionally.
• Analyzing opportunities and market penetration rates by understanding product commercialization, and regional expansion.
• Analyzing demand and supply trends and changes in industry dynamics to establish future growth.
• Analyzing sustainability strategies adhered to by market participants in an attempt to determine the future course of the market.
• Analyzing historical market trends and super-imposing them on the current and future variables to determine year-on-year trends.
• Understanding adoption, development, distribution and regulatory framework.
Data Validation
• Estimated and forecasted data was validated through industry experts.
• Apart from industry experts, data triangulation methods were used for validation.
• Bottom-up and top-down approach has been used for the estimation and forecast of market data, whereas the top-down approach was used for validation.
• Demand, as well as supply-side surveys, were conducted in order to understand the industry dynamics and data validation.
Research Phases
.png "Mattress Market Research Phase")
Primary Research
VynZ Research conducts extensive primary research to understand the market dynamics, validate market data and have key opinions from industry experts. The key profiles approached within the industry include CEO, CFO, CTO, President, Vice President, Product Managers, Regional Heads and Others. Also, end-user surveys comprising consumers are also conducted to understand consumer behaviour.
The Mattress Market report offers a comprehensive market segmentation analysis along with an estimation for the forecast period 2025–2030.
Segments Covered in the Report
- By Product
- Innerspring
- Memory Foam
- Latex
- Others
- By Size
- Single Size Mattress
- Double Size Mattress
- Queen Size Mattress
- King Size Mattress
- By End Use
Region Covered in the Report
- North America
- Europe
- Germany
- U.K.
- France
- Italy
- Spain
- Russia
- Rest of Europe
- Asia-Pacific (APAC)
- China
- Japan
- India
- South Korea
- Rest of Asia-Pacific
- Rest of the World (RoW)
- Brazil
- Saudi Arabia
- South Africa
- U.A.E.
- Other Countries
.png "Mattress Market Size")
Source: VynZ Research
.png "Mattress Market Analysis")
Source: VynZ Research
