Oil and Gas Lubricants Market Size & Share Growth Forecast Report (2026-2035)
Industry Insight by Product Type (Hydraulic Fluids, Engine Oils, Gear Oils, Compressor Oils, Turbine Oils, Greases, Other Lubricants), by Base Oil (Mineral Oil, Synthetic Oil, Bio-based Oil), by Location of Deployment (Onshore, Offshore), by End User (Upstream, Midstream, Downstream)
| Status : Published | Published On : Jun, 2026 | Report Code : VREP3071 | Industry : Energy & Power | Available Format :
|
Page : 154 |
Oil and Gas Lubricants Market Overview
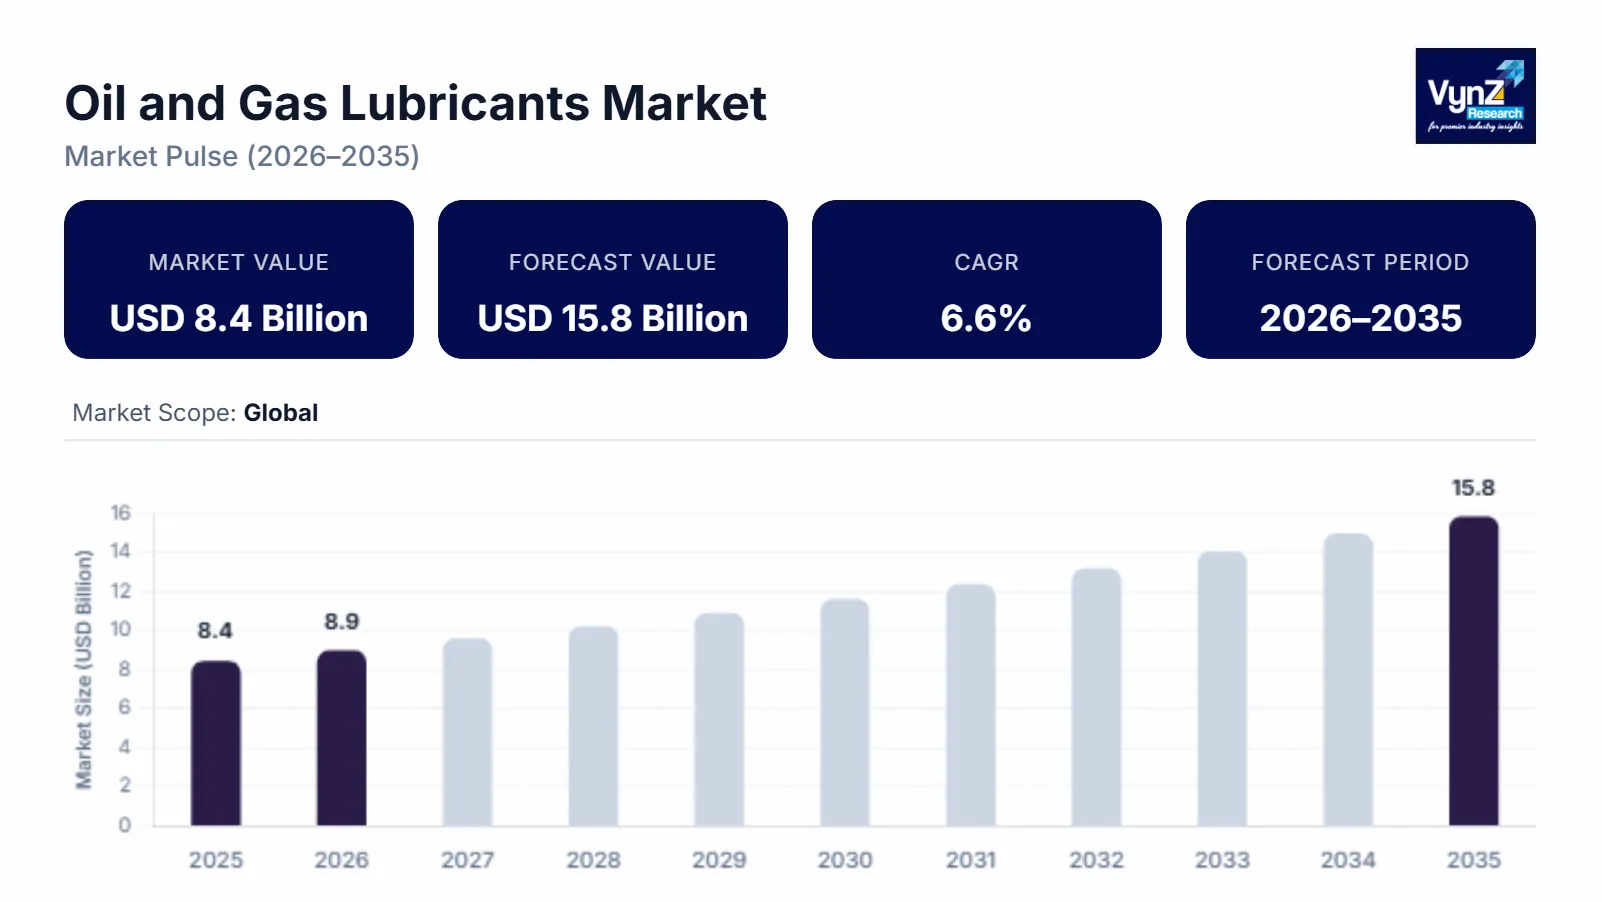
The oil and gas lubricants market size was estimated at about USD 8.4 billion in 2025 and is expected to reach around USD 8.9 billion in 2026 rising up to roughly USD 15.8 billion in 2035, growing at approximately 6.6% CAGR from 2026 to 2035.
Research Highlights
- Hydraulic fluids held 28% market share in 2025 due to high demand for drilling equipment.
- Mineral oil lubricants captured 58% share in 2025 for their cost efficiency.
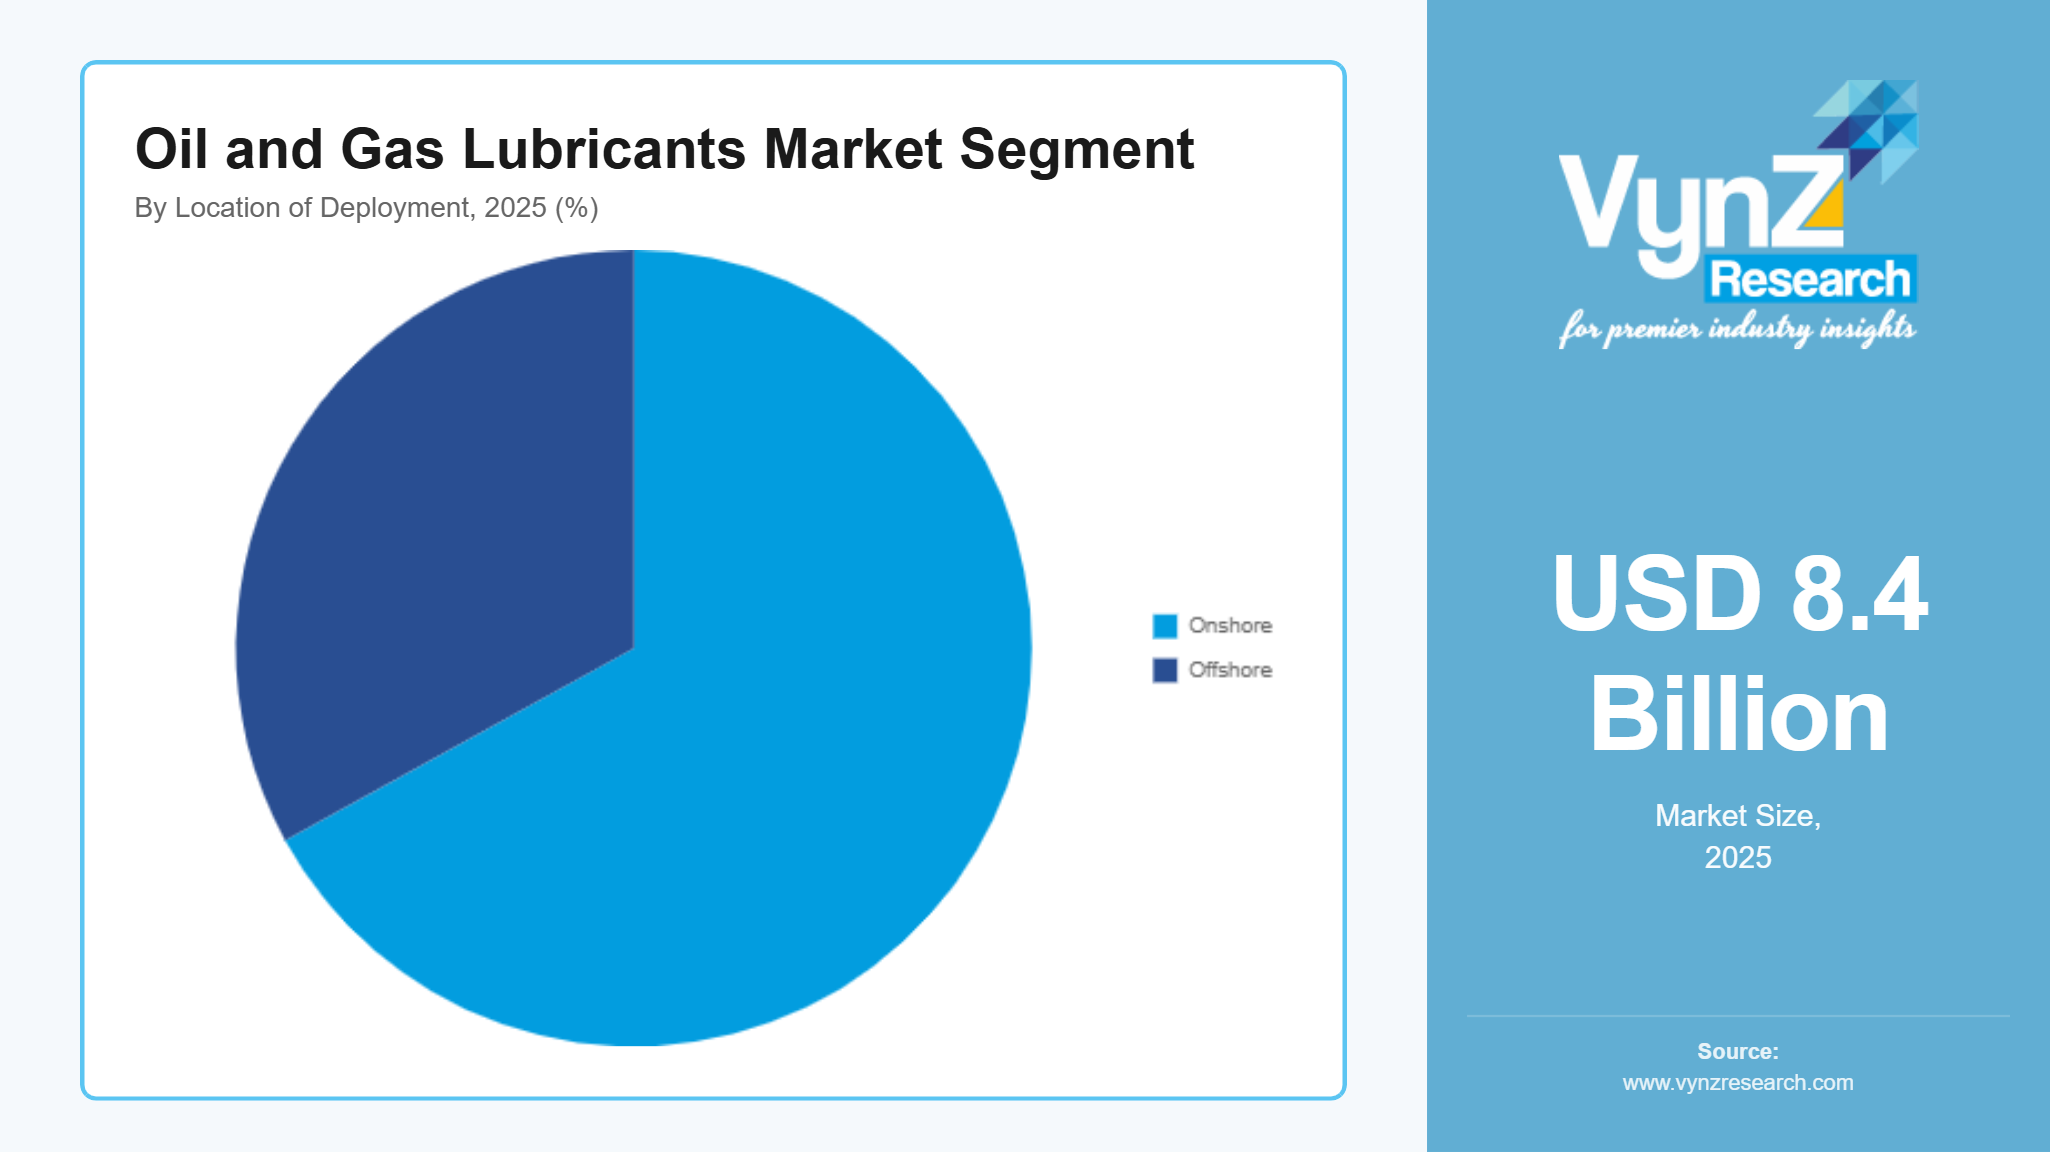
- Onshore operations accounted for 67% share in 2025 supported by extensive production activities.
- Downstream applications are projected to grow at 6.9% CAGR through 2035.
- North America held 31% market share in 2025 supported by increased production.
The market is growing due to higher demand for oil and gas across the globe which promotes drilling requirements. More companies are putting money into drilling and production and want equipment that is reliable and works well which increases the use and demand for lubricants to make the machines work well and reduce wear. The International Energy Agency, U.S. Energy Information Administration and Organization of the Petroleum Exporting Countries are helping companies to increase their production to meet the growing demand in North America, the Middle East and Asia Pacific.
Oil and Gas Lubricants Market Dynamics
Market Trends
The business is changing because companies today prefer using semi-synthetic lubricants to make their machines work better, last longer and to save money. The International Energy Agency says that because more money is being spent on oil and gas production there is a need for lubricants that can help equipment work better. Companies are also using technology to predict when their equipment will need maintenance which helps them work efficiently and save time. As a result, lubricant companies are now making high-performance products that' are specific to certain types of equipment and are also offering maintenance services which is changing how companies compete with each other.
Growth Drivers
The market is growing because more oil and gas is being explored and produced which means that there is a need for lubricants in drilling, extraction and processing. According to the U.S. Energy Information Administration and OPEC, more investments will be made to produce more hydrocarbons to meet the growing energy needs of the world. More money is invested in upgrading refineries and pipeline infrastructure which is pushing the market further.
Market Restraints / Challenges
Even though the market is growing there are some challenges that could slow it down. The price of oil is not stable which can affect how much money companies make and what they decide to buy. This is especially true for companies in emerging markets. The International Monetary Fund and the U.S. Energy Information Administration say that changes in commodity prices can have an impact on how much money is spent in the oil and gas industry. Additionally, companies have to follow strict regulations, which can be a challenge. They need base oils and additives which can be expensive and hard to get and affect how well the market does, especially when the economy is not doing well. Companies also have to spend money to develop new products that meet environmental standards.
Market Opportunities
There are opportunities in the market especially for high-performance synthetic lubricants. Companies that make lubricants that can withstand high temperatures and last longer are in a good position to sell more products. More money is being spent on drilling in environments, which is also creating opportunities. Another opportunity is in friendly lubricants and digital lubrication management solutions, advances in technology, maintenance and lubricant performance analytics that will make operations more efficient and improve asset management.
Global Oil and Gas Lubricants Market Report Coverage
|
Report Metric |
Details |
|
Historical Period |
2020 - 2024 |
|
Base Year Considered |
2025 |
|
Forecast Period |
2026 - 2035 |
|
Market Size in 2025 |
USD 8.4 Billion |
|
Revenue Forecast in 2035 |
USD 15.8 Billion |
|
Growth Rate |
% |
|
Segments Covered in the Report |
Product Type, Base Oil, Location of Deployment, End User |
|
Report Scope |
Market Trends, Drivers, and Restraints; Revenue Estimation and Forecast; Segmentation Analysis; Companies’ Strategic Developments; Market Share Analysis of Key Players; Company Profiling |
|
Regions Covered in the Report |
North America, Middle East, Asia Pacific, Europe and Rest of the World |
|
Key Companies |
BP Lubricants Pvt. Ltd., Chevron Corporation, Exxon Mobil Corporation, Indian Oil Corporation Ltd., Lubrication Engineers Inc., Royal Dutch Shell, Schlumberger Limited, Sinopec Lubricant Company, SK Lubricants Co., Ltd., Total SA |
|
Customization |
Available upon request |
Oil and Gas Lubricants Market Segmentation
By Product Type
Hydraulic fluids accounted for about 28% of the market share in 2025 because they are used a lot in drilling equipment, production systems and hydraulic machinery and the demand is increasing due to higher investments in exploration and production infrastructure, according to the U.S. Energy Information Administration (EIA).
Compressor oils are expected to grow the fastest at around 7.1% per year through the forecast period because more gas compression systems, LNG infrastructure and processing facilities are being built.
By Base Oil
Mineral oil lubricants represented about 58% of the share of the market in 2025 as they are widely available, cost-effective and used a lot in oil and gas operations.
Synthetic oil lubricants are expected to grow at a CAGR of around 7.3% every year through 2026 to 2035 due to their higher thermal stability, durability and efficiency to protect equipment better.
By Location of Deployment
Onshore applications held around 67% of the market in 2025 supported by more active drilling sites, production facilities and transportation infrastructure on land.
Offshore operations will grow at 7% CAGR during the projected period due to more deepwater exploration activities happening in the Middle East, South America and Africa.
By End User
The upstream segment made up nearly 46% of the share of the market in 2025 due to higher usage in drilling rigs, extraction equipment and production machinery.
The downstream segment is expected to grow at a rate of about 6.9% each year as there is a large number of refinery modernization projects and petrochemical capacity additions made. Higher operational efficiency and investment in refining infrastructure are also supporting its growth.
Regional Insights
North America
The market in North America was about 31% in 2025 because there is a lot of exploration and production going on in the oil and gas industry in the region. The United States and Canada are the countries that are driving the growth of the market as they are producing a lot of oil and natural gas. The government is supporting the industry by making supportive policies, investing a lot of money in technologies and infrastructure.
Middle East
The market in the Middle East contributed about 24% of the total revenue in 2025 due to higher production capabilities. The companies are putting a lot of money into production facilities and refining projects helping the market to grow with new oil fields being developed and old refineries being modernized despite a very strong infrastructure already existing.
Asia Pacific
The market in Asia Pacific in 2025 was about 22% and is growing steadily in China, India and Southeast Asia due to larger production, according to the International Energy Agency, due to advancements in technology and higher investments in petrochemical projects in the region.
Europe and Rest of the World
The market in Europe and the rest of the world in 2025 made up about 23% due to growing production and higher investment in technologies and infrastructure according to the International Energy Agency. The governments in these regions are also helping the companies to increase their production with their support and favorable growth policies.
Competitive Landscape / Company Insights
The market is fairly competitive with the regional players focusing on product innovation, pricing strategies and geographic expansion. Companies are investing in research and development of synthetic lubricant technologies and digital monitoring capabilities helping them strengthen their market position. The International Energy Agency, U.S. Energy Information Administration and OPEC support industry growth by encouraging suppliers to improve product performance, operational efficiency and sustainability.
Mini Profiles
BP Lubricants Pvt. Ltd. focuses on industrial and energy sector lubricants, supported by strong brand recognition, extensive distribution capabilities, and advanced lubricant formulation expertise.
Chevron Corporation operates in premium lubricant segments, emphasizing equipment performance, operational reliability, and specialized solutions for demanding oil and gas applications.
Exxon Mobil Corporation leverages global manufacturing capabilities, technological innovation, and extensive research activities to expand its presence in industrial and energy lubricant markets.
Indian Oil Corporation Ltd focuses on lubricant production and industrial maintenance solutions, supported by a broad supply network, cost efficiency, and strong market presence.
Schlumberger Limited operates in niche oilfield service segments, emphasizing performance optimization, drilling efficiency, and specialized lubrication solutions for energy infrastructure.
Key Players
- BP Lubricants Pvt Ltd
- Chevron Corporation
- Exxon Mobil Corporation
- Indian Oil Corporation Ltd
- Lubrication Engineers Inc
- Royal Dutch Shell
- Schlumberger Limited
- Sinopec Lubricant Company
- SK Lubricants Co Ltd
- Total SA
Recent Developments
In January 2025, Royal Dutch Shell expanded its lubricant portfolio for offshore oil and gas operations. The development focused on improving equipment reliability and operational efficiency.
In March 2025, Total SA introduced advanced industrial lubricant solutions for energy sector applications. The launch strengthened its position in high-performance lubrication technologies.
In June 2025, Sinopec Lubricant Company increased production capacity for premium industrial lubricants. The initiative supported growing demand from refining and petrochemical facilities.
In September 2025, SK Lubricants Co., Ltd. expanded its synthetic base oil business globally. The company focused on supplying advanced lubricant inputs for industrial applications.
In February 2026, Lubrication Engineers Inc. launched new reliability-focused lubrication solutions for heavy industrial equipment. The products were designed to enhance asset performance and reduce maintenance requirements.
Global Oil and Gas Lubricants Market Coverage
Product Type Insight and Forecast 2026 - 2035
- Hydraulic Fluids
- Engine Oils
- Gear Oils
- Compressor Oils
- Turbine Oils
- Greases
- Other Lubricants
Base Oil Insight and Forecast 2026 - 2035
- Mineral Oil
- Synthetic Oil
- Bio-based Oil
Location of Deployment Insight and Forecast 2026 - 2035
- Onshore
- Offshore
End User Insight and Forecast 2026 - 2035
- Upstream
- Midstream
- Downstream
Global Oil and Gas Lubricants Market by Region
- North America
- By Product Type
- By Base Oil
- By Location of Deployment
- By End User
- By Country - U.S., Canada, Mexico
- Europe
- By Product Type
- By Base Oil
- By Location of Deployment
- By End User
- By Country - Germany, U.K., France, Italy, Spain, Russia, Rest of Europe
- Asia-Pacific (APAC)
- By Product Type
- By Base Oil
- By Location of Deployment
- By End User
- By Country - China, Japan, India, South Korea, Vietnam, Thailand, Malaysia, Rest of Asia-Pacific
- Rest of the World (RoW)
- By Product Type
- By Base Oil
- By Location of Deployment
- By End User
- By Country - Brazil, Saudi Arabia, South Africa, U.A.E., Other Countries
Table of Contents for Oil and Gas Lubricants Market Report
1. Research Overview
1.1. The Report Offers
1.2. Market Coverage
1.2.1. By
Product Type
1.2.2. By
Base Oil
1.2.3. By
Location of Deployment
1.2.4. By
End User
1.3. Research Phases
1.4. Limitations
1.5. Market Methodology
1.5.1. Data Sources
1.5.1.1.
Primary Research
1.5.1.2.
Secondary Research
1.5.2. Methodology
1.5.2.1.
Data Exploration
1.5.2.2.
Forecast Parameters
1.5.2.3.
Data Validation
1.5.2.4.
Assumptions
1.5.3. Study Period & Data Reporting Unit
2. Executive Summary
3. Industry Overview
3.1. Industry Dynamics
3.1.1. Market Growth Drivers
3.1.2. Market Restraints
3.1.3. Key Market Trends
3.1.4. Major Opportunities
3.2. Industry Ecosystem
3.2.1. Porter’s Five Forces Analysis
3.2.2. Recent Development Analysis
3.2.3. Value Chain Analysis
3.3. Competitive Insight
3.3.1. Competitive Position of Industry
Players
3.3.2. Market Attractive Analysis
3.3.3. Market Share Analysis
4. Global Market Estimate and Forecast
4.1. Global Market Overview
4.2. Global Market Estimate and Forecast to 2035
5. Market Segmentation Estimate and Forecast
5.1. By Product Type
5.1.1. Hydraulic Fluids
5.1.1.1. Market Definition
5.1.1.2. Market Estimation and Forecast to 2035
5.1.2. Engine Oils
5.1.2.1. Market Definition
5.1.2.2. Market Estimation and Forecast to 2035
5.1.3. Gear Oils
5.1.3.1. Market Definition
5.1.3.2. Market Estimation and Forecast to 2035
5.1.4. Compressor Oils
5.1.4.1. Market Definition
5.1.4.2. Market Estimation and Forecast to 2035
5.1.5. Turbine Oils
5.1.5.1. Market Definition
5.1.5.2. Market Estimation and Forecast to 2035
5.1.6. Greases
5.1.6.1. Market Definition
5.1.6.2. Market Estimation and Forecast to 2035
5.1.7. Other Lubricants
5.1.7.1. Market Definition
5.1.7.2. Market Estimation and Forecast to 2035
5.2. By Base Oil
5.2.1. Mineral Oil
5.2.1.1. Market Definition
5.2.1.2. Market Estimation and Forecast to 2035
5.2.2. Synthetic Oil
5.2.2.1. Market Definition
5.2.2.2. Market Estimation and Forecast to 2035
5.2.3. Bio-based Oil
5.2.3.1. Market Definition
5.2.3.2. Market Estimation and Forecast to 2035
5.3. By Location of Deployment
5.3.1. Onshore
5.3.1.1. Market Definition
5.3.1.2. Market Estimation and Forecast to 2035
5.3.2. Offshore
5.3.2.1. Market Definition
5.3.2.2. Market Estimation and Forecast to 2035
5.4. By End User
5.4.1. Upstream
5.4.1.1. Market Definition
5.4.1.2. Market Estimation and Forecast to 2035
5.4.2. Midstream
5.4.2.1. Market Definition
5.4.2.2. Market Estimation and Forecast to 2035
5.4.3. Downstream
5.4.3.1. Market Definition
5.4.3.2. Market Estimation and Forecast to 2035
6. North America Market Estimate and Forecast
6.1. By
Product Type
6.2. By
Base Oil
6.3. By
Location of Deployment
6.4. By
End User
6.4.1.
U.S. Market Estimate and Forecast
6.4.2.
Canada Market Estimate and Forecast
6.4.3.
Mexico Market Estimate and Forecast
7. Europe Market Estimate and Forecast
7.1. By
Product Type
7.2. By
Base Oil
7.3. By
Location of Deployment
7.4. By
End User
7.4.1.
Germany Market Estimate and Forecast
7.4.2.
France Market Estimate and Forecast
7.4.3.
U.K. Market Estimate and Forecast
7.4.4.
Italy Market Estimate and Forecast
7.4.5.
Spain Market Estimate and Forecast
7.4.6.
Russia Market Estimate and Forecast
7.4.7.
Rest of Europe Market Estimate and Forecast
8. Asia-Pacific (APAC) Market Estimate and Forecast
8.1. By
Product Type
8.2. By
Base Oil
8.3. By
Location of Deployment
8.4. By
End User
8.4.1.
China Market Estimate and Forecast
8.4.2.
Japan Market Estimate and Forecast
8.4.3.
India Market Estimate and Forecast
8.4.4.
South Korea Market Estimate and Forecast
8.4.5.
Rest of Asia-Pacific Market Estimate and Forecast
9. Rest of the World (RoW) Market Estimate and Forecast
9.1. By
Product Type
9.2. By
Base Oil
9.3. By
Location of Deployment
9.4. By
End User
9.4.1.
Brazil Market Estimate and Forecast
9.4.2.
Saudi Arabia Market Estimate and Forecast
9.4.3.
South Africa Market Estimate and Forecast
9.4.4.
U.A.E. Market Estimate and Forecast
9.4.5.
Other Countries Market Estimate and Forecast
10. Company Profiles
10.1.
BP Lubricants Pvt Ltd
10.1.1.
Snapshot
10.1.2.
Overview
10.1.3.
Offerings
10.1.4.
Financial
Insight
10.1.5.
Recent
Developments
10.2.
Chevron Corporation
10.2.1.
Snapshot
10.2.2.
Overview
10.2.3.
Offerings
10.2.4.
Financial
Insight
10.2.5.
Recent
Developments
10.3.
Exxon Mobil Corporation
10.3.1.
Snapshot
10.3.2.
Overview
10.3.3.
Offerings
10.3.4.
Financial
Insight
10.3.5.
Recent
Developments
10.4.
Indian Oil Corporation Ltd
10.4.1.
Snapshot
10.4.2.
Overview
10.4.3.
Offerings
10.4.4.
Financial
Insight
10.4.5.
Recent
Developments
10.5.
Lubrication Engineers Inc
10.5.1.
Snapshot
10.5.2.
Overview
10.5.3.
Offerings
10.5.4.
Financial
Insight
10.5.5.
Recent
Developments
10.6.
Royal Dutch Shell
10.6.1.
Snapshot
10.6.2.
Overview
10.6.3.
Offerings
10.6.4.
Financial
Insight
10.6.5.
Recent
Developments
10.7.
Schlumberger Limited
10.7.1.
Snapshot
10.7.2.
Overview
10.7.3.
Offerings
10.7.4.
Financial
Insight
10.7.5.
Recent
Developments
10.8.
Sinopec Lubricant Company
10.8.1.
Snapshot
10.8.2.
Overview
10.8.3.
Offerings
10.8.4.
Financial
Insight
10.8.5.
Recent
Developments
10.9.
SK Lubricants Co Ltd
10.9.1.
Snapshot
10.9.2.
Overview
10.9.3.
Offerings
10.9.4.
Financial
Insight
10.9.5.
Recent
Developments
10.10.
Total SA
10.10.1.
Snapshot
10.10.2.
Overview
10.10.3.
Offerings
10.10.4.
Financial
Insight
10.10.5.
Recent
Developments
11. Appendix
11.1. Exchange Rates
11.2. Abbreviations
Note: Financial insight and recent developments of different companies are subject to the availability of information in the secondary domain.
Frequently Asked Questions
Purchase Options
Latest Report
Research Methodology
- Desk Research / Pilot Interviews
- Build Market Size Model
- Research and Analysis
- Final Deliverable
Connect With Our Sales Team
- Toll-Free: +1-888-253-3960
- Phone: +91 9960 288 381
- Email: enquiry@vynzresearch.com
Oil and Gas Lubricants Market