Solar Energy Market Overview
The Global Solar Energy Market was valued at USD 98.2 billion in 2023 and is estimated to grow during the forecast period with a strong CAGR of 16% to USD 310 billion by the end of 2030.
Water scarcity worsens due to extensive use in all fields and global population growth, impacting energy production using water as a source. To counter this, solar energy emerges as a crucial solution, capturing the sun's unlimited power through several technologies like solar heating and photovoltaic cells.
Since sun is a limitless source of energy, the energy & power sector invented devices and system to harness it and generate solar energy. This is a practical approach to increase the supply of power and energy and reduce greenhouse gas emissions causing global warming. Additionally, these systems reduce water footprint.
The global solar energy market, driven by both grid-connected and off-grid systems, witnesses off-grid growth due to remote energy needs and decentralization policies. Grid-connected PV systems lead with low costs and surplus electricity integration, reducing battery reliance.
Innovations like Mono-si cells and Parabolic Troughs drive sector expansion, evidenced by recent large-scale projects. Market expansion spans residential, commercial, and industrial sectors, with industrial dominance driving revenue growth amidst concerns over water scarcity and sustainability.
Solar Energy Market Segmentation
Insight by Grid
The global solar energy market categorized by grid is divided into two main segments namely, grid-connected and off-grid.
During the projected period, the off-grid segment is expected to benefit from increasing energy demands in remote areas worldwide and the enforcement of regulatory policies aimed at decentralizing power generation.
Grid-connected photovoltaic (PV) systems dominate due to their low operating costs and simplicity, as excess electricity can be supplied to networks, reducing the need for nearby battery storage.
Insight by Technology
The global solar energy market is divided into two main technology segments, such as Photovoltaic Systems and Concentrated Solar Power Systems. Under Photovoltaic Systems, there are variations such as Mono-si, Thin-film, Multi-si, and Others. Concentrated solar power systems include Parabolic Trough, Solar Power Tower, Fresnel Reflectors, and Dishing Sterling.
Out of these segments, the photovoltaic systems hold the largest market share, driven by falling technology costs, improved panel efficiency, and increased energy output. As for its subsections, the Mono-si technology is expected to attract more market entrants due to its high efficiency, compact design, and durability. Recently, various leading market players have launched 120 GW of new solar PV projects.
Insight by Application
The global solar energy market is divided into three main categories namely, residential, commercial, and industrial.
Among these segments, the industrial sector holds the largest market share. The revenue of the industrial sector in the energy market is expected to grow due to the growth across various industrial verticals and declining water levels. To further boost solar energy market expansion, Masdar and the Ethiopian government signed an MoU in March 2022 to develop 500MW of solar power facilities.
On the other hand, growing awareness among residential consumers about environmentally friendly energy sources is driving adoption of rooftop solar systems, supporting future growth in the residential sector.
Insight by End User
The global solar energy market is characterised by end-users into three main segments such as electricity generation, water heating, and charging appliance. Out of these three segments, the electricity generation segment holds the dominant position, contributing the largest revenue to the global market. This is primarily attributed to the fast decline in traditional electricity manufacturing resources and the notable shift of public and private electricity manufacturing units towards solar energy systems.
Global Solar Energy Market Report Coverage
|
Report Metric
|
Details
|
|
Historical Period
|
2020 - 2024
|
|
Base Year Considered
|
2025
|
|
Forecast Period
|
2026 - 2035
|
|
Market Size in 2025
|
U.S.D. 63 Billion
|
|
Revenue Forecast in 2035
|
U.S.D. 310 Billion
|
|
Growth Rate
|
16%%
|
|
Segments Covered in the Report
|
By Grid, By Technology, By Application.
|
|
Report Scope
|
Market Trends, Drivers, and Restraints; Revenue Estimation and Forecast; Segmentation Analysis; Companies’ Strategic Developments; Market Share Analysis of Key Players; Company Profiling
|
|
Regions Covered in the Report
|
North America, Europe, Asia-Pacific, Middle East, and Rest of the World
|
Industry Dynamics
Solar Energy Industry Trends
The growing adoption of energy storage technologies improves the efficiency and dependability of solar energy systems.
Smart solar solutions, using IoT and AI technologies, enable distant monitoring and optimisation for better performance.
Community solar developments offer prospects for wider access to solar energy, nurturing partnership within local communities.
Integrating solar power into transportation infrastructure helps decrease reliance on conventional fuels and reduces greenhouse gas emissions.
Continuing innovations in solar panel design aim to expand efficiency and versatility, resulting in advancements in renewable energy technology.
Government policies and incentives play a vital role in stimulating investment and driving growth in the solar energy sector.
Hybrid energy systems, merging solar with other renewables, offer enhanced reliability and resilience in energy generation.
Environmental sustainability initiatives through the solar panel lifecycle contribute to reducing the ecological footprint of solar energy production.
Solar Energy Market Growth Drivers
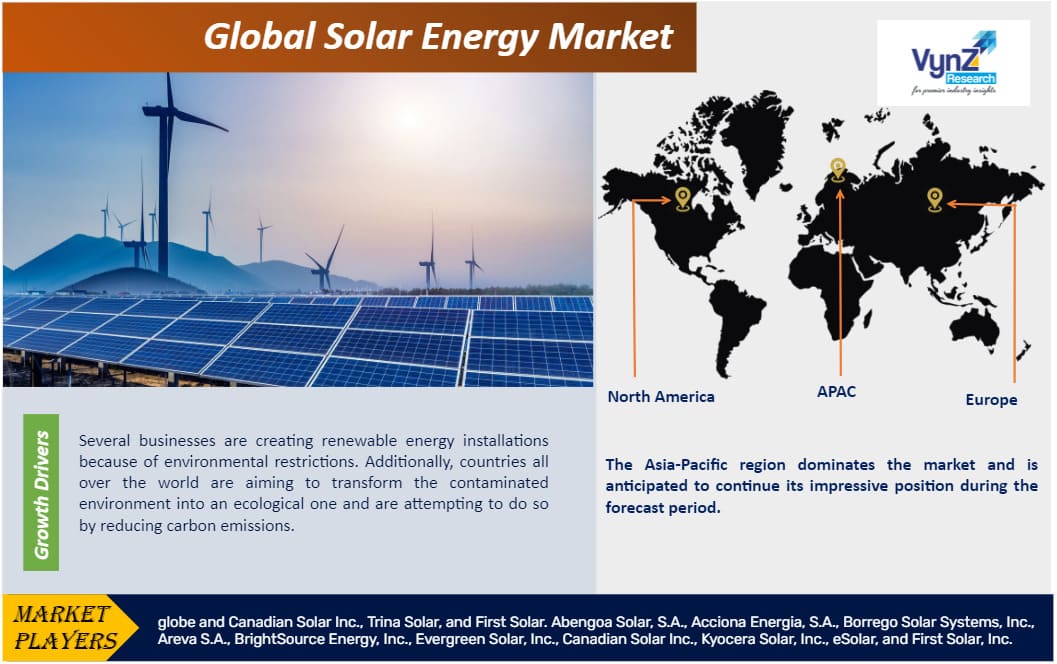
Due to environmental regulations, numerous businesses are establishing renewable energy installations. Moreover, countries worldwide are striving to transition from polluted environments to eco-friendly ones by decreasing carbon emissions. As a result, solar electricity proves to be an affordable form of sustainable energy and therefore is being heavily invested in by many nations to combat carbon emissions effectively. This is one significant factor driving growth of the global solar market.
Furthermore, supportive government legislation, such as the Federal Investment Tax Credit (FiT), Investment Tax Credits (ITC), and Capital Subsidies, facilitates the installation of renewable energy sources in various countries, including the U.S., China, and EU member states, driving further growth of the market.
Solar Energy Market Challenges
The high expenses encompassing the inverter, solar batteries, wiring, installation, and solar panels are incorporated in the solar panel installation cost. This poses a considerable challenge that will impede market growth during the projected period.
Solar Energy Market Opportunity
To boost the capacity of PV systems and replace conservative sources, photovoltaic storage technology needs development. This will drive demand for lithium-ion batteries for solar energy storage due to the rising adoption of storage grids with PV installations. Amorphous silicon cells are anticipated to grow rapidly due to augmented solar panel usage. The demand for copper indium gallium selenide will increase with the development of more inexpensive solar panels. Low-cost manufacturing and improved solar module efficiency will also increase demand for cadmium telluride.
Solar Energy Market Geographical Overview
The Asia-Pacific region dominates and is anticipated to sustain its position, driven by high electricity demand, growing living standards, and abundant sunlight. China leads with 48 GW of solar plants installed in 2022. Europe follows as the second-largest market with 18.2 GW of solar PV installations in 2023, accredited to favourable renewable energy targets and regulations. The USA installed 19 GW of solar plants in North America. In the Middle East & Africa, nearly 1.5 GW of solar PV projects were deployed in 2022, with ongoing construction of several solar projects.
Solar Energy Market Competitive Insights
Borrego, a leading EPC and O&M provider, accelerates the delivery and maintenance of large commercial, community solar, and utility-scale solar and energy storage projects in the United States. Borrego offers a broad range of renewable energy services and has a track record of superior performance. It is established in 1980 with its regional offices in California, Massachusetts, and New York with a nationwide footprint. Borrego creates value by helping partners make better decisions at critical points in every project’s life.
Canadian Solar, over the past two decades, has become a global leader in solar energy and energy storage solutions. Company has also ventured into the development of large-scale solar power plants nand battery storage projects worldwide. Canadian Solar's subsidiary CSI Solar Ltd conducted its initial public offering on the Shanghai Stock Exchange in June 2023. CSI Solar encompasses solar module and battery storage manufacturing, as well as the provision of comprehensive system solutions, including inverters, solar system kits, and EPC services.
Recent Development by Market Key Players
Evergreen Power Solutions Inc (The Indian unit of US green energy platform) has signed a Memorandum of Understanding (MoU) with the government of Gujarat to build a 400-MW hybrid renewables complex in the Indian state. The Indian company will invest INR 40 billion that envisages the installation of both solar photovoltaic (PV) and onshore wind capacity.
Borrego Energy shall rebrand its O&M business as Cleanleaf Energy, with a focus on utility and commercial solar and storage O&M. Cleanleaf Energy will be one of the largest third-party O&M providers in the country, managing and optimizing more than 1.9 GW across 1,000 solar and energy storage projects, including utility-scale plants that were previously managed under the Borrego name.
Key Players covered in this report
The solar energy market based on a wide range of products and a sizable distribution network is segmented and widespread all across the globe and Canadian Solar Inc., Trina Solar, and First Solar. Abengoa Solar, S.A., Acciona Energia, S.A., Borrego Solar Systems, Inc., Areva S.A., BrightSource Energy, Inc., Evergreen Solar, Inc., Canadian Solar Inc., Kyocera Solar, Inc., eSolar, and First Solar, Inc. are of the top competitors in the solar energy sector.
The Solar Energy Market report offers a comprehensive market segmentation analysis along with an estimation for the forecast period 2025–2030.
Segments Covered in the Report
- By Solar Type
- Monocrystalline
- Polycrystalline
- Cadmium Telluride
- Amorphous Silicon Cells
- Others
- By Technology
- Photovoltaic system
- Mono-si
- Thin-Film
- Multi-si
- Other
- Concentrated Solar Power System
- Parabolic
- Solar Power Tower
- Fresnel Reflectors
- Dishing Stirling
- By Application
- Residential
- Non-Residential
- Utility
- By End User
- Electricity Generation
- Lighting
- Heating
- Charging
Region Covered in the Report
- North America
- Europe
- Germany
- U.K.
- France
- Italy
- Spain
- Russia
- Rest of Europe
- Asia-Pacific (APAC)
- China
- Japan
- India
- South Korea
- Rest of Asia-Pacific
- Rest of the World (RoW)
- Brazil
- Saudi Arabia
- South Africa
- U.A.E.
- Other Countries
.png "Solar Energy Market Size")
