Laboratory Information System Market Overview
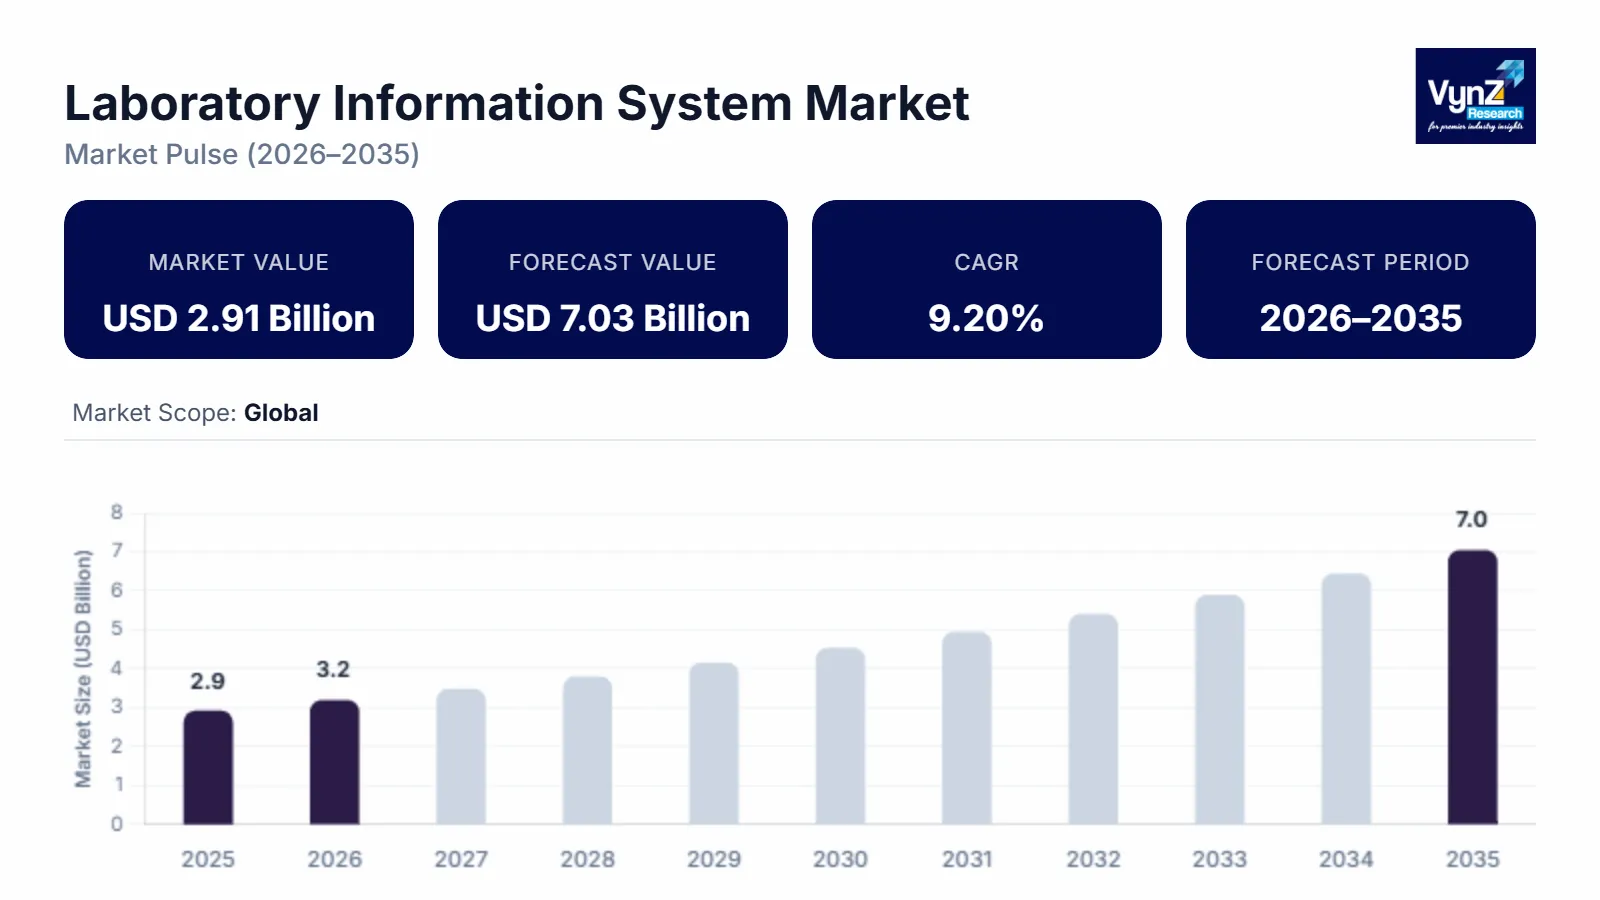
The laboratory Information System Market USD 2.91 billion in 2025 and estimated to reach around USD 3.19 billion in 2026, is projected to reach around USD 7.03 billion by 2035, expanding at a CAGR of about 9.20 % during the forecast period from 2026 to 2035. Different products, such as integrated and standalone, are majorly contributing to the laboratory information system market size. A laboratory information system (LIS) is a software solution that manages the obtaining, handling, and storage of information created by laboratories. It helps to simplify laboratory processes to reduce specimen handling time, enhance turnaround time, and increase productivity.
Market growth is expected due to the growing aging population, which is susceptible to chronic diseases, a desire for high-quality diagnosis, and growing awareness of these solutions. In addition, strategic collaborations and partnerships, mergers, and acquisitions among the major industry players are also fueling the market growth. The growing stress on the clinical labs that are already working at full capacity, encourages higher usage of laboratory information systems to alleviate the unnecessary stress from the setting especially when they use a large number of hazardous chemicals every day that can cause drastic biohazards.
The primary obstacle to market growth is that these systems are also vulnerable to technical issues resulting in interoperability problems that prevent widespread adoption. The longer time taken and the technical complexities to overcome while integrating the new systems with the existing infrastructure also hinder the growth of the market. However, help in maintaining traceability and data integrity along with ensuring compliance with regulatory requirements, the growing awareness of the benefits offered by these solutions, and the rising demand for quality assurance and precise test results are creating novel growth opportunities.
Laboratory Information System Market Segmentation
Insight by Product
The global laboratory information system is divided by-products into standalone system and integrated system segments, where the standalone system segment is expected to hold a larger market share due to tech developments and the rise in the adoption of cloud-based systems. However, the growth of the integrated systems is also expected to continue as in the historical period due to the reduction in the separate service and maintenance charges.
Insight by Component
The components split the global laboratory information system into software and services segments, where the latter segment is expected to hold a larger share and grow at a faster rate due to the growing need for software upgrading, software maintenance after installation, and training requirements. Another significant factor for the growth of this segment is the accessibility of advanced services offered by the key players.
Insight by Delivery Mode
The global laboratory information system is categorized by the delivery mode into web-based, on-premise, and cloud-based segments. Among these segments, the on-premise segment will account for the larger share during the forecast period due to personalized delivery modes and higher data security.
Insight by End User
The different end users also divide the global laboratory information system into hospital laboratories, independent laboratories, physician office laboratories, and other segments. Out of all these segments, the independent laboratory segment will grow at a higher CAGR during the forecast period. Still, the hospital laboratories segment will account for the largest share of the market.
Global Laboratory Information System Market Report Coverage
|
Report Metric
|
Details
|
|
Historical Period
|
2020 - 2024
|
|
Base Year Considered
|
2025
|
|
Forecast Period
|
2026 - 2035
|
|
Market Size in 2025
|
U.S.D. 2.91 Billion
|
|
Revenue Forecast in 2035
|
U.S.D. 7.03 Billion
|
|
Growth Rate
|
9.20%
|
|
Segments Covered in the Report
|
By Product, By Component Type and By Delivery Mode and By End User
|
|
Report Scope
|
Market Trends, Drivers, and Restraints; Revenue Estimation and Forecast; Segmentation Analysis; Companies’ Strategic Developments; Market Share Analysis of Key Players; Company Profiling
|
|
Regions Covered in the Report
|
North America, Europe, Asia-Pacific, Middle East, South America and Rest of the World
|
Industry Dynamics
Industry Trends
There is a growing tendency in the industry to restrict diagnostic errors. In addition, the increasing penetration of mobile applications is also notable in the healthcare solutions and industry. Also, there is a higher adaption and implementation of laboratory information systems as well as EHR systems due to the rapid advancement in technology. Also, the strict regulations and high-quality standard requirements for laboratories to guarantee patient safety and accuracy of results are noteworthy trends in the industry. There is a significant improvement in the product approval and launches noticed.
Laboratory Information System Market Growth Drivers
The rising need for an integrated healthcare system, and government initiatives also contribute to market growth, such as favorable reimbursement policies and other schemes to support healthcare IT. Furthermore, the growing preference for customized medicines and the development and launch of new and innovative products contribute to the growth in the global laboratory information system market. There is also a significant growth in demand for these products that fuel the market growth due to increasing inclination towards automation in laboratories, growing need for regulatory compliance, tech developments in the products, higher awareness among people through workshops, conferences, and seminars, and growing R&D activities and expenditure, which are all helping the market to grow.
Laboratory Information System Market Challenges
The primary hindrance to the growth of the laboratory information system market is the high cost of these solutions. Apart from that, the lack of skilled professionals, the need for specialized laboratory units for chemistry, microbiology, and hematology, along with the complexities are also harming the growth of the market.
Laboratory Information System Market Opportunities
However, growth opportunities in the market are presented by the rapid technological development in this field, especially related to pharmaceutical laboratories. It is also attributed to the growth in demand for lab automation by using these efficient systems during the forecast period. Furthermore, higher expenditure in R&D initiatives and developments in the R&D labs in the pharmaceutical and biotechnological segments are expected to present positive market growth. In addition, the inherent benefits of these systems such as effective time management, low-cost implementation and operation, and regulatory compliance are also presenting novel growth opportunities to the laboratory information management system market.
Laboratory Information System Market Geographic Overview
North America leads the global laboratory information system market. It will continue to do so due to growing incidents of chronic diseases, strict regulatory mandates, growing customized medicine initiatives, increase in government initiatives and industry players to promote healthcare IT, higher need for top-quality and accurate cancer diagnosis, growing healthcare spending, and the higher requirement for the integrated healthcare system.
The Asia-Pacific market will grow due to a large population, higher cancer diagnostic initiatives, growing awareness, higher HER adoption, higher requirements for the integrated healthcare system, growing healthcare spending, favorable government policies to promote healthcare IT, development in the healthcare infrastructure, and the rise in the number of incidents of chronic diseases.
Laboratory Information System Market Competitive Insight
Market players in the laboratory information system industry are investing capital to develop technologically advanced systems.
Epic Systems Corporation (commonly known as Epic) is an American privately held healthcare software company. Epic develops software to help people get well, help people stay well, and help future generations be healthier.
CompuGroup Medical delivers leading lab management software with solutions including CGM LABDAQ and CGM SCHUYLAB Laboratory Information System.
Some of the major players of this market are Cerner Corporation, Mckesson Corporation, Compugroup Medical AG, EPIC Systems Corporation, Computer Programs and Systems, Inc. (CPSI), International Business Machines (IBM) Corporation, Orchard Software Corporation, SCC Soft Computer
Recent Developments by Key Players
Software giant Oracle has integrated generative AI services into its Cerner electronic medical record system as health IT companies race to harness the cutting-edge tech for providers. The use of AI and conversational voice tech will enable doctors and clinicians to automate medical note-taking, order medications and view lab reviews while also more easily reviewing a patient's medical record.
Australia’s New South Wales Ministry of Health (NSW Health) has selected health information system developer Epic to unify its five pathology laboratory information management systems (LIMS), nine electronic medical record systems (EMR), and six patient administration systems (PAS) into a statewide single digital patient record (SDPR).
The Laboratory Information System Market report offers a comprehensive market segmentation analysis along with an estimation for the forecast period 2026–2035.
Segments Covered in the Report<
- By Product
- By Component Type
- By Delivery Mode
- On-Premise
- Web-Based
- Cloud-Based
- By End User
- Hospital Laboratories
- Independent Laboratories
- Physician Office Laboratories
- Other End Users
Laboratory Information System Market by Region
- North America
- Europe
- Germany
- U.K.
- France
- Italy
- Spain
- Rest of Europe
- Asia-Pacific
- Japan
- China
- India
- Australia
- South Korea
- Rest of Asia-Pacific
- Rest of the World
- Brazil
- South Africa
- Saudi Arabia
- U.A.E
- Other Countries
PRIMARY RESEARCH INTERVIEWS - BREAKDOWN