Servo Motors and Drives Market Overview
The Global Servo Motors and Drives market is expected to grow significantly during the forecast period at a steady compound annual growth rate of 6.1% to reach USD 20.12 billion by 2030.
These drives and motors are typically systems that allows precision control. The servo motors are designed to offer motion control with higher efficiency and ensure precise positioning. The high torque and speed enhance the precision of operations.
The drivers, on the other hand, typically act as controllers. The primary objective of these drives is to streamline the electrical supply to the servo motors. This, in combination, enhances the overall performance.
The servo motors and drives typically have a wide range of applications across different industries and play an important role in offering accurate position control for automatic rotary or linear actuators. These systems are typically found in packaging machines, conveyor belts, semiconductors, food processing units, robots, and other industrial machines.
Servo Motors and Drives Market Segmentation
Insight by Offering
The global servo motors and drives market is divided by varied offerings into hardware, software, and services segments. Ot of these three segments, the hardware segment is expected to hold the largest share due to extensive use of the motors and drives in different industries. On the other hand, the other two segments are anticipated to grow at a faster rate due to more installation setup, motion controlling, networking, and better configuration needs.
Insight by Product Type
The segmentation of the global servo motors and drives market based on different product types include servo motors and servo drives where the former is further subdivided into AC servo motor, DC brushless motor, brushed DC servo motor, and linear servo motor, and the servo drives into AC servo drive, DC servo drive, adjustable servo drives, and other segments. Out of these two major segmentations, the servo motor segment is expected to hold the larger share of the market. It will grow at a higher rate during the forecast period due to the benefits offered by the useful features and greater applicability across a diverse range of end-use industries.
Insight by System
The global servo motors and drives market is also divided by the system types into rotary and linear systems, where the former segments are expected to dominate the market due to significant benefits offered in the form of high-resolution, lower consumption of energy, precision feedback, greater torque density, and high response. This enhances its applicability across different industry verticals, such as packaging, food processing, transportation, and healthcare.
Insight by Voltage
According to the voltage, the global servo motors and drives market is categorized into low-voltage, medium-voltage, and high-voltage segments. Out of these three segments, the low voltage segment will experience higher growth and dominate the market share due to greater compatibility with mobile applications despite the need for lower noise, higher acceleration, improved efficiency, and improved braking processes.
Insight by Brake Technology
The brake technology also splits the global servo motors and drives market into spring, permanent magnet, and other segments. Out of these segments, the permanent magnet segment is expected to grow at a higher CAGR due to its compact, lightweight, and small design, which produces low torque per size density. This leads to the higher adoption of the permanent magnet brakes across a wide range of industries such as transportation, automotive, pharmaceuticals, healthcare, packaging, textile, and more, which further propels the growth of this segment.
Insight by Communication Protocol
According to the communication protocol, the servo motors and drives market is divided into Fieldbus, wireless, and industrial ethernet segments. Out of these segments, the Fieldbus segment will contribute a larger share of the market due to more efficient communication via a single cable. This specific feature offers greater speed and network operation, which includes PROFIBUS, MODBUS, INTERBUS, FOUNDATION Fieldbus, CANopen, CC-Link, and DeviceNet.
Insight by Material Construction
The servo motors and drives market is divided according to material construction into stainless steel and non-stainless-steel segments. During the forecast period, the non-stainless-steel segment, such as carbon steel and aluminum, will dominate the market due to their higher endurance against corrosion, dust, and high-pressure washdown water jets.
Insight by End-User Industry
The servo motors and drives market is divided into is also divide according to the end-user industry into automotive, transportation, textiles, food processing, semiconductor and electronics, pharmaceuticals, healthcare, printing & paper, packaging, oil & gas, chemicals & petrochemicals, and other segments. Out of these segments, the automotive segment will grow more and contribute a larger share to the market during the forecast period due to higher applications in fuel injection systems, cruise control systems, ABS, and pedal systems to regulate the speed of vehicles.
Global Servo Motors and Drives Market Report Coverage
|
Report Metric
|
Details
|
|
Historical Period
|
2020 - 2024
|
|
Base Year Considered
|
2025
|
|
Forecast Period
|
2026 - 2035
|
|
Market Size in 2025
|
U.S.D. 20.12 Billion
|
|
Revenue Forecast in 2035
|
U.S.D. xx.xx Billion
|
|
Growth Rate
|
6.1%
|
|
Segments Covered in the Report
|
By Offerings, By Product Type, By System, By Voltage, By Brake Technology, By Communication Protocol, By Material Construction and By End-User Industry
|
|
Report Scope
|
Market Trends, Drivers, and Restraints; Revenue Estimation and Forecast; Segmentation Analysis; Companies’ Strategic Developments; Market Share Analysis of Key Players; Company Profiling
|
|
Regions Covered in the Report
|
North America, Europe, Asia-Pacific, Middle East, and Rest of the World
|
Industry Dynamics
Servo Motors and Drives Industry Trends
One significant trend of the industry is the growing trend of Industry 4.0. This has encouraged the market players to use servo motors and drives instead of traditional motors to enhance production and organize operations and management. The extensive use of these motors and drives, especially in the automotive industry, is also noticed to cater to the growing need for sophisticated machines and instruments. The industries are also emphasizing more on enhancing precision and production output. In the process, it allows them to reduce the cost of labor and waste of raw materials during production.
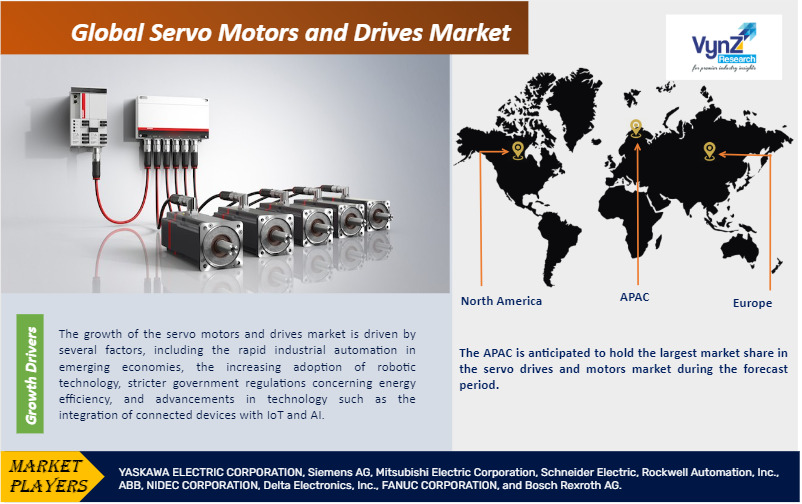
Servo Motors and Drives Market Growth Drivers
The primary growth driver of the global servo motors and drives market is the growing automation in the industries in developing industries. It is also attributed to the growing acceptance and use of robotic technology across several industry verticals. In addition, the strict government regulations to conserve energy and increase efficiency also propel market growth. Technological progress has also resulted in the growth of the market since it allows the integration of advanced technologies like AI and IoT with connected devices for increased production. The awareness of the benefits offered by these systems has also encouraged the manufacturers to incorporate these motors and drives into the existing system as a vital part. This has reduced the maintenance requirements and costs of the systems and enhance their durability, which further propels the growth of the market.
Servo Motors and Drives Market Challenges
The growth of the global servo motors and drives is hindered due to the high cost as well as the shortage of skilled professionals. Also, the easy availability of cheaper substitutes and higher initial investments slacken the growth of the market.
Servo Motors and Drives Market Opportunities
The growth opportunities of global servo motors and drives are offered by the growing collaboration of robots and their extensive use in assembly lines in the automotive industry to smoothen the production process. The useful features of these systems, such as higher speed, better torque, lightweight design, and compact size, increase their demand, thereby creating new growth opportunities for the market on a global scale.
Servo Motors and Drives Market Geographic Overview
The APAC market is expected to grow due to globalization initiatives and fast industrialization during the forecast period. The growing population in developing countries in this region also propels market growth due to the growing demand for consumer appliances and electronics, automotive vehicles, smartphones, wearable devices, and smart home devices.
The North American market is also expected to grow during the projected period due to rapid industrial automation, continual tech advancements, expanding robotics industry, higher investments in products using renewable energy, higher demand by the aerospace and defense sectors, the growing shift of the automotive industry towards electric vehicles (EVs), advanced manufacturing techniques, and stable infrastructure, reliable economic environment, and supportive government initiatives.
Servo Motors and Drives Market Competitive Insight
The market for servo motors and drives is anticipated to be highly competitive and the players are focus on new product development, partnerships, and mergers and acquisitions in order to expand their consumer base. The industry players are collaborating with end-use industries to secure the sales of servo motors. Thud, their focus is to attain a competitive edge and have the liberty to customize products as per their client’s demand.
The Yaskawa Electric Corporation is a Japanese manufacturer of servos, motion controllers, AC motor drives, switches and industrial robots. Their Motoman robots are heavy duty industrial robots used in welding, packaging, assembly, coating, cutting, material handling and general automation.
Siemens AG is a German multinational technology conglomerate. It is focused on industrial automation, distributed energy resources, rail transport and health technology.
Some of the key players operating in the Servo motors and drives market are YASKAWA ELECTRIC CORPORATION, Siemens AG, Mitsubishi Electric Corporation, Schneider Electric, Rockwell Automation, Inc., ABB, NIDEC CORPORATION, Delta Electronics, Inc., FANUC CORPORATION, and Bosch Rexroth AG.
Recent Developments by Key Players
Yaskawa, a global technology supplier in segments drives, motion controls and robotics is opening a new state-of-the-art UK headquarters and manufacturing facility in Sunderland. The company is opening a 35,000sq ft facility at Hillthorn Park adjacent to Nissan UK and the International Advanced Manufacturing Park which mark a continuation of the company’s ambitious expansion strategy in Europe.
Mitsubishi Electric Corporation and MOVENSYS Inc. have collaborated to strengthen in AC servo and motion control businesses.
.png "Servo Motors and Drive Market Size and Market Analysis")
Source-Vynz Research
