Status : Published | Published On : Jan, 2024 | Report Code : VRSME9003 | Industry : Semiconductor & Electronics | Available Format :
![]() |
Page : 147 |
The Smart Lighting Market is projected to witness significant growth, with an estimated value of USD 12.0 billion in 2023, expected to reach USD 32.0 billion by 2030. This market is experiencing remarkable growth, driven by the widespread adoption of cutting-edge technologies such as intelligent systems, IoT, real-time illumination monitoring, and advancements in connected lighting. Additionally, the global smart lighting market is fueled by the growing awareness of energy conservation. The market is anticipated to grow at a notable CAGR of 20.4% during the period of 2025-2030.
Smart lighting has become one of the most popular solutions in the lighting industry that uses control system in order to control lights on the basis of several parameters such as occupancy, temperature, amount of natural light and movement. Energy cost associated with lighting is high as a result to which industries and government organizations are increasingly emphasizing efforts to decrease utilization of energy and thereby altering conventional lighting systems with advanced and efficient control systems in lighting.
Automated lighting enables users to monitor tasks at an efficient manner along with flexible and economical lighting. Due to all these advantages, the smart lighting market is growing at a significant rate. Moreover, it has been observed that smart lighting is excessively being adopted in industries such as government buildings, residential, automobiles and industrial.
Based on the product, the global smart lighting market is categorized into the lighting control system and luminaries. Luminaries, which is further categorized into smart bulb and fixture, account for the larger share in the market, whereas smart bulb, categorized into driver & ballast, switch & relay, sensor, and gateway, exhibit the faster growth during the forecast period.
Based on the source of smart light, the market is segmented into the light-emitting diode, fluorescent lamp, a high-intensity discharge lamp, and others. Among these, globally, the LED segment held the largest share in the market in 2019 and is also anticipated to witness the highest growth during the forecast period.
The smart lighting market on the basis of communication is segmented into wireless technology and wired technology. Among these two technologies, wireless technology is expected to witness the fastest growth during the forecast period owing to the elimination of wire utilization that is ultimately abolishing the requirement for protection and installation of cables. As a result, it has been observed that the cost associated with wireless lighting is relatively low and is flexible in nature as compared to wired technology.
The wireless communication technology sensors help in developing an autonomous network that makes moving, updating, replacing and adding sensors convenient after the installation. Moreover, rapid developments observed in wireless technology are expected to drive the wireless communication technology smart lighting market during the projected period.
On the basis of application, the smart lighting market is segmented into the indoor application and outdoor application. Among these two segments, the indoor application held the larger share in 2019 in the global market. The indoor application is further sub-segmented into commercial, residential and others. Among these subcategories, residential applications are excessively being installed in accordance with an entire house or even for a specific room. Moreover, the market for residential indoor applications is expected to witness the fastest growth during the forecast period in the market due to the establishment of a wireless technique.
Report Metric |
Details |
Historical Period |
2020 - 2024 |
Base Year Considered |
2025 |
Forecast Period |
2026 - 2035 |
Market Size in 2025 |
U.S.D. 12.0 Billion |
Revenue Forecast in 2035 |
U.S.D. 32.0 Billion |
Growth Rate |
20.4% |
Segments Covered in the Report |
By Product, By Source, By Communication, By Application & By Region. |
Report Scope |
Market Trends, Drivers, and Restraints; Revenue Estimation and Forecast; Segmentation Analysis; Impact of COVID-19; Companies’ Strategic Developments; Market Share Analysis of Key Players; Company Profiling |
Regions Covered in the Report |
North America, Europe, Asia-Pacific, Middle East, and Rest of the World |
One of the key trends prevailing in smart lighting market is the commercial usage of smart lighting systems. It encompasses the extensive implementation of these lighting systems in retail stores, hospitality, and shopping malls. Replacement of existing lights with more energy-efficient alternative lighting systems is helping to eradicate explosive consumption of energy.
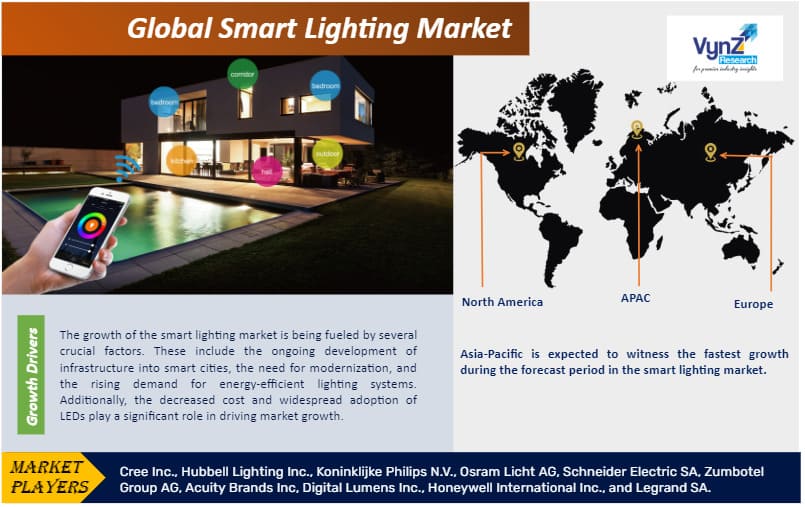
The growth of the smart lighting market is being fueled by several crucial factors. These include the ongoing development of infrastructure into smart cities, the need for modernization, and the rising demand for energy-efficient lighting systems. Additionally, the decreased cost and widespread adoption of LEDs play a significant role in driving market growth. There is also a high demand for intelligent solutions for street lighting systems and an increasing emphasis on energy savings among government organizations and consumers worldwide. As a result, the smart lighting market is experiencing rapid expansion.
The high initial cost of installation, security and privacy concerns and limited knowledge related to payback periods are the major factors hampering the growth of the smart lighting market.
The rapid development of smart cities is fueling the growth of the smart lighting industry due to use of embedded devices and sensor technology in various areas such as traffic signals and streets decreases the consumption of energy at the extensive rate. Smart city initiatives specifically focus upon the use of connected devices that enables streamlining the operations and conservation of energy that makes the living of individuals convenient and affordable. These lighting systems are thus helping the government organizations in reducing energy consumption, the cost associated with maintenance of smart cities and a lower rate of accidents at night with the connected street lights.
Geographically, Asia-Pacific is expected to witness the fastest growth during the forecast period in the smart lighting market owing to massive growth perspective provided to the manufacturers by this region and these lighting systems are extensively being adopted by the consumers in developing their household and making it digitalized. Increasing activities pertaining to construction in Asia-Pacific is extensively contributing to the growth of the market in the region.
The enduring construction activities in China and India are going to undertake a rapid development that is expected to generate several growth opportunities for home automation and utilization of energy-efficient lighting systems in this region. Furthermore, swelling implementation of energy-efficient systems of lighting along with increasing expenditure on public infrastructure from the government organizations is expected to further drive the growth of the smart lighting market in Asia-Pacific at a rapid pace.
The smart lighting market are highly fragmented and lead by some of the biggest lighting companies. The key strategy adopted by the companies operating in the smart lighting ecosystem are new product launch and existing portfolio enhancement. Globally, industry players in the smart lighting industry are leveraging market growth through the establishment of growth strategies related to organic and inorganic growth mechanisms along with the incorporation of several strategic partnerships by the key players occurring in this industry.
Honeywell has made significant innovations in smart lighting and simplified lighting management as per the available space. Honeywell has innovated IoT-based, wireless LMS and has shifted to multi-sensor technology. They are redefining smart lighting in spaces to ensure occupants’ comfort, boost their productivity and reduce energy costs.
Zumtobel is a global supplier of integral lighting solutions that enhances users' experience on the interplay of light and architecture. Zumtobel provides a wide portfolio of high-quality LED luminaries and lighting management systems for interior lighting in offices, education, presentation & retail, hotel & wellness, health, art & culture, etc. The company has developed customized lighting solutions and supply the best light for people and the environment.
Some of the key players operating in the global smart lighting market include Cree Inc., Hubbell Lighting Inc., Koninklijke Philips N.V., Osram Licht AG, Schneider Electric SA, Zumbotel Group AG, Acuity Brands Inc, Digital Lumens Inc., Honeywell International Inc., and Legrand SA.
Primary Research
VynZ Research conducts extensive primary research to understand the market dynamics, validate market data and have key opinions from the industry experts. The key profiles approached within the industry includes, CEO, CFO, CTO, President, Vice President, Product Managers, Regional Heads and Others. Also, end user surveys comprising of consumers are also conducted to understand consumer behaviour.
The Smart Lighting Market report offers a comprehensive market segmentation analysis along with an estimation for the forecast period 2025–2030.
Segments Covered in the Report
Region Covered in the Report
Source: VynZ Research
1. Research Overview
1.1. The Report Offers
1.2. Market Coverage
1.2.1. By Product
1.2.2. By Source
1.2.3. By Communication
1.2.4. By Application
1.2.5. By Region
1.3. Research Phases
1.4. Limitations
1.5. Market Methodology
1.5.1. Data Sources
1.5.1.1. Primary Research
1.5.1.2. Secondary Research
1.5.2. Methodology
1.5.2.1. Data Exploration
1.5.2.2. Forecast Parameters
1.5.2.3. Data Validation
1.5.2.4. Assumptions
1.5.3. Study Period & Data Reporting Unit
2. Executive Summary
3. Industry Overview
3.1. Industry Dynamics
3.1.1. Market Growth Drivers
3.1.2. Market Restraints
3.1.3. Key Market Trends
3.1.4. Major Opportunities
3.2. Industry Ecosystem
3.2.1. Porter’s Five Forces Analysis
3.2.2. Recent Development Analysis
3.2.3. Value Chain Analysis
3.3. Competitive Insight
3.3.1. Competitive Position of Industry Players
3.3.2. Market Attractive Analysis
3.3.3. Market Share Analysis
4. Global Market Estimate and Forecast
4.1. Global Market Overview
4.2. Global Market Estimate and Forecast to 2030
5. Market Segmentation Estimate and Forecast
5.1. By Product
5.1.1. Lighting Control
5.1.1.1. Market Definition
5.1.1.2. Market Estimation and Forecast to 2030
5.1.2. Luminaries
5.1.2.1. Market Definition
5.1.2.2. Market Estimation and Forecast to 2030
5.2. By Source
5.2.1. Light Emitting Diode
5.2.1.1. Market Definition
5.2.1.2. Market Estimation and Forecast to 2030
5.2.2. Fluorescent Lamp
5.2.2.1. Market Definition
5.2.2.2. Market Estimation and Forecast to 2030
5.2.3. High Intensity Discharge Lamp
5.2.3.1. Market Definition
5.2.3.2. Market Estimation and Forecast to 2030
5.2.4. Others
5.2.4.1. Market Definition
5.2.4.2. Market Estimation and Forecast to 2030
5.3. Communication
5.3.1. Wired
5.3.1.1. Market Definition
5.3.1.2. Market Estimation and Forecast to 2030
5.3.2. Wireless
5.3.2.1. Market Definition
5.3.2.2. Market Estimation and Forecast to 2030
5.4. By Application
5.4.1. Outdoor
5.4.1.1. Market Definition
5.4.1.2. Market Estimation and Forecast to 2030
5.4.2. Indoor
5.4.2.1. Market Definition
5.4.2.2. Market Estimation and Forecast to 2030
6. North America Market Estimate and Forecast
6.1. By Product
6.2. By Source
6.3. By Communication
6.4. By Application
6.5. By Country
6.5.1. U.S. Market Estimate and Forecast
6.5.2. Canada Market Estimate and Forecast
6.5.3. Mexico Market Estimate and Forecast
7. Europe Market Estimate and Forecast
7.1. By Product
7.2. By Source
7.3. By Communication
7.4. By Application
7.5. By Country
7.5.1. Germany Market Estimate and Forecast
7.5.2. France Market Estimate and Forecast
7.5.3. U.K. Market Estimate and Forecast
7.5.4. Italy Market Estimate and Forecast
7.5.5. Spain Market Estimate and Forecast
7.5.6. Rest of Europe Market Estimate and Forecast
8. Asia-Pacific Market Estimate and Forecast
8.1. By Product
8.2. By Source
8.3. By Communication
8.4. By Application
8.5. By Country
8.5.1. China Market Estimate and Forecast
8.5.2. Japan Market Estimate and Forecast
8.5.3. India Market Estimate and Forecast
8.5.4. South Korea Market Estimate and Forecast
8.5.5. Singapore Market Estimate and Forecast
8.5.6. Rest of Asia-Pacific Market Estimate and Forecast
9. Rest of the World (RoW) Market Estimate and Forecast
9.1. By Product
9.2. By Communication
9.3. By Application
9.4. By Country
9.4.1. Brazil Market Estimate and Forecast
9.4.2. Saudi Arabia Market Estimate and Forecast
9.4.3. South Africa Market Estimate and Forecast
9.4.4. Other Countries Market Estimate and Forecast
10. Company Profiles
10.1. Cree Inc.
10.1.1. Snapshot
10.1.2. Overview
10.1.3. Offerings
10.1.4. Financial Insight
10.1.5. Recent Developments
10.2. Hubbell Lighting Inc.
10.2.1. Snapshot
10.2.2. Overview
10.2.3. Offerings
10.2.4. Financial Insight
10.2.5. Recent Developments
10.3. Koninklijke Philips N.V.
10.3.1. Snapshot
10.3.2. Overview
10.3.3. Offerings
10.3.4. Financial Insight
10.3.5. Recent Developments
10.4. Osram Licht AG
10.4.1. Snapshot
10.4.2. Overview
10.4.3. Offerings
10.4.4. Financial Insight
10.4.5. Recent Developments
10.5. Schneider Electric SA
10.5.1. Snapshot
10.5.2. Overview
10.5.3. Offerings
10.5.4. Financial Insight
10.5.5. Recent Developments
10.6. Zumbotel Group AG
10.6.1. Snapshot
10.6.2. Overview
10.6.3. Offerings
10.6.4. Financial Insight
10.6.5. Recent Developments
10.7. Acuity Brands Inc.
10.7.1. Snapshot
10.7.2. Overview
10.7.3. Offerings
10.7.4. Financial Insight
10.7.5. Recent Developments
10.8. Digital Lumens Inc.
10.8.1. Snapshot
10.8.2. Overview
10.8.3. Offerings
10.8.4. Financial Insight
10.8.5. Recent Developments
10.9. Honeywell International Inc.
10.9.1. Snapshot
10.9.2. Overview
10.9.3. Offerings
10.9.4. Financial Insight
10.9.5. Recent Developments
10.10. Legrand SA
10.10.1. Snapshot
10.10.2. Overview
10.10.3. Offerings
10.10.4. Financial Insight
10.10.5. Recent Developments
11. Appendix
11.1. Exchange Rates
11.2. Abbreviations
Note: Financial insight and recent developments of different companies are subject to availability of information in secondary domain.
List of Tables
Table 1 Sources
Table 2 Study Periods
Table 3 Data Reporting Unit
Table 4 Global Smart Lighting Market Size, by Product, 2018 - 2023 (USD Billion)
Table 5 Global Smart Lighting Market Size, by Product, 2025 - 2030 (USD Billion)
Table 6 Global Smart Lighting Market Size, by Source, 2018 - 2023 (USD Billion)
Table 7 Global Smart Lighting Market Size, by Source, 2025 - 2030 (USD Billion)
Table 8 Global Smart Lighting Market Size, by Communication, 2018 - 2023 (USD Billion)
Table 9 Global Smart Lighting Market Size, by Communication, 2025 - 2030 (USD Billion)
Table 10 Global Smart Lighting Market Size, by Application, 2018 - 2023 (USD Billion)
Table 11 Global Smart Lighting Market Size, by Application, 2025 - 2030 (USD Billion)
Table 12 Global Smart Lighting Market Size, by Region, 2018 - 2023 (USD Billion)
Table 13 Global Smart Lighting Market Size, by Region, 2025 - 2030 (USD Billion)
Table 14 North America Smart Lighting Market Size, by Product, 2018 - 2023 (USD Billion)
Table 15 North America Smart Lighting Market Size, by Product, 2025 - 2030 (USD Billion)
Table 16 North America Smart Lighting Market Size, by Source, 2018 - 2023 (USD Billion)
Table 17 North America Smart Lighting Market Size, by Source, 2025 - 2030 (USD Billion)
Table 18 North America Smart Lighting Market Size, by Communication, 2018 - 2023 (USD Billion)
Table 19 North America Smart Lighting Market Size, by Communication, 2025 - 2030 (USD Billion)
Table 20 North America Smart Lighting Market Size, by Application, 2018 - 2023 (USD Billion)
Table 21 North America Smart Lighting Market Size, by Application, 2025 - 2030 (USD Billion)
Table 22 North America Smart Lighting Market Size, by Country, 2018 - 2023 (USD Billion)
Table 23 North America Smart Lighting Market Size, by Country, 2025 - 2030 (USD Billion)
Table 24 Europe Smart Lighting Market Size, by Product, 2018 - 2023 (USD Billion)
Table 25 Europe Smart Lighting Market Size, by Product, 2025 - 2030 (USD Billion)
Table 26 Europe Smart Lighting Market Size, by Source, 2018 - 2023 (USD Billion)
Table 27 Europe Smart Lighting Market Size, by Source, 2025 - 2030 (USD Billion)
Table 28 Europe Smart Lighting Market Size, by Communication, 2018 - 2023 (USD Billion)
Table 29 Europe Smart Lighting Market Size, by Communication, 2025 - 2030 (USD Billion)
Table 30 Europe Smart Lighting Market Size, by Application, 2018 - 2023 (USD Billion)
Table 31 Europe Smart Lighting Market Size, by Application, 2025 - 2030 (USD Billion)
Table 32 Europe Smart Lighting Market Size, by Country, 2018 - 2023 (USD Billion)
Table 33 Europe Smart Lighting Market Size, by Country, 2025 - 2030 (USD Billion)
Table 34 Asia-Pacific Smart Lighting Market Size, by Product, 2018 - 2023 (USD Billion)
Table 35 Asia-Pacific Smart Lighting Market Size, by Product, 2025 - 2030 (USD Billion)
Table 36 Asia-Pacific Smart Lighting Market Size, by Source, 2018 - 2023 (USD Billion)
Table 37 Asia-Pacific Smart Lighting Market Size, by Source, 2025 - 2030 (USD Billion)
Table 38 Asia-Pacific Smart Lighting Market Size, by Communication, 2018 - 2023 (USD Billion)
Table 39 Asia-Pacific Smart Lighting Market Size, by Communication, 2025 - 2030 (USD Billion)
Table 40 Asia-Pacific Smart Lighting Market Size, by Application, 2018 - 2023 (USD Billion)
Table 41 Asia-Pacific Smart Lighting Market Size, by Application, 2025 - 2030 (USD Billion)
Table 42 Asia-Pacific Smart Lighting Market Size, by Country, 2018 - 2023 (USD Billion)
Table 43 Asia-Pacific Smart Lighting Market Size, by Country, 2025 - 2030 (USD Billion)
Table 44 RoW Smart Lighting Market Size, by Product, 2018 - 2023 (USD Billion)
Table 45 RoW Smart Lighting Market Size, by Product, 2025 - 2030 (USD Billion)
Table 46 RoW Smart Lighting Market Size, by Source, 2018 - 2023 (USD Billion)
Table 47 RoW Smart Lighting Market Size, by Source, 2025 - 2030 (USD Billion)
Table 48 RoW Smart Lighting Market Size, by Communication, 2018 - 2023 (USD Billion)
Table 49 RoW Smart Lighting Market Size, by Communication, 2025 - 2030 (USD Billion)
Table 50 RoW Smart Lighting Market Size, by Application, 2018 - 2023 (USD Billion)
Table 51 RoW Smart Lighting Market Size, by Application, 2025 - 2030 (USD Billion)
Table 52 RoW Smart Lighting Market Size, by Country, 2018 - 2023 (USD Billion)
Table 53 RoW Smart Lighting Market Size, by Country, 2025 - 2030 (USD Billion)
Table 54 Snapshot – Cree Inc.
Table 55 Snapshot – Hubbell Lighting Inc.
Table 56 Snapshot – Koninklijke Philips N.V.
Table 57 Snapshot – Osram Licht AG
Table 58 Snapshot – Schneider Electric SA
Table 59 Snapshot – Zumbotel Group AG
Table 60 Snapshot – Acuity Brands Inc.
Table 61 Snapshot – Digital Lumens Inc.
Table 62 Snapshot – Honeywell International Inc.
Table 63 Snapshot – Legrand SA
List of Figures
Figure 1 Market Coverage
Figure 2 Research Phases
Figure 3 Secondary Sources for Different Parameters
Figure 4 Methodology
Figure 5 Data Mining & Exploration
Figure 6 Data Triangulation
Figure 7 Assumptions for Market Estimation and Forecast
Figure 8 Market Synopsis
Figure 9 Global Smart Lighting Market - Growth Drivers and Restraints
Figure 10 Competitive Benchmark
Figure 11 Global Smart Lighting Market Highlight
Figure 12 Global Smart Lighting Market Size, by Product, 2018 - 2030 (USD Billion)
Figure 13 Global Smart Lighting Market Size, by Source, 2018 - 2030 (USD Billion)
Figure 14 Global Smart Lighting Market Size, by Communication, 2018 - 2030 (USD Billion)
Figure 15 Global Smart Lighting Market Size, by Application, 2018 - 2030 (USD Billion)
Figure 16 Global Smart Lighting Market Size, by Region, 2018 - 2030 (USD Billion)
Figure 17 North America Smart Lighting Market Highlight
Figure 18 North America Smart Lighting Market Size, by Product, 2018 - 2030 (USD Billion)
Figure 19 North America Smart Lighting Market Size, by Source, 2018 - 2030 (USD Billion)
Figure 20 North America Smart Lighting Market Size, by Communication, 2018 - 2030 (USD Billion)
Figure 21 North America Smart Lighting Market Size, by Application, 2018 - 2030 (USD Billion)
Figure 22 North America Smart Lighting Market Size, by Country, 2018 - 2030 (USD Billion)
Figure 23 Europe Smart Lighting Market Highlight
Figure 24 Europe Smart Lighting Market Size, by Product, 2018 - 2030 (USD Billion)
Figure 25 Europe Smart Lighting Market Size, by Source, 2018 - 2030 (USD Billion)
Figure 26 Europe Smart Lighting Market Size, by Communication, 2018 - 2030 (USD Billion)
Figure 27 Europe Smart Lighting Market Size, by Application, 2018 - 2030 (USD Billion)
Figure 28 Europe Smart Lighting Market Size, by Country, 2018 - 2030 (USD Billion)
Figure 29 Asia-Pacific Smart Lighting Market Highlight
Figure 30 Asia-Pacific Smart Lighting Market Size, by Product, 2018 - 2030 (USD Billion)
Figure 31 Asia-Pacific Smart Lighting Market Size, by Source, 2018 - 2030 (USD Billion)
Figure 32 Asia-Pacific Smart Lighting Market Size, by Communication, 2018 - 2030 (USD Billion)
Figure 33 Asia-Pacific Smart Lighting Market Size, by Application, 2018 - 2030 (USD Billion)
Figure 34 Asia-Pacific Smart Lighting Market Size, by Country, 2018 - 2030 (USD Billion)
Figure 35 RoW Smart Lighting Market Highlight
Figure 36 RoW Smart Lighting Market Size, by Product, 2018 - 2030 (USD Billion)
Figure 37 RoW Smart Lighting Market Size, by Source, 2018 - 2030 (USD Billion)
Figure 38 RoW Smart Lighting Market Size, by Communication, 2018 - 2030 (USD Billion)
Figure 39 RoW Smart Lighting Market Size, by Application, 2018 - 2030 (USD Billion)
Figure 40 RoW Smart Lighting Market Size, by Country, 2018 - 2030 (USD Billion)
Global Smart Lighting Market Coverage
Product Insight and Forecast 2025 – 2030
Source Insight and Forecast 2025– 2030
Communication Insight and Forecast 2025 – 2030
Application Insight and Forecast 2025 – 2030
Geographical Segmentation
Smart Lighting Market by Region
North America
Europe
Asia-Pacific (APAC)
Rest of the World (RoW)
Vynz Research know in your business needs, you required specific answers pertaining to the market, Hence, our experts and analyst can provide you the customized research support on your specific needs.
After the purchase of current report, you can claim certain degree of free customization within the scope of the research.
Please let us know, how we can serve you better with your specific requirements to your research needs. Vynz research promises for quick reversal for your current business requirements.
Purchase Options
Latest Report
Research Methodology
Connect With Our Sales Team