Status : Published | Published On : Dec, 2023 | Report Code : VREP3001 | Industry : Energy & Power | Available Format :
![]() |
Page : 170 |
The Market for power rentals is expected to grow at a CAGR of 7.6% from an anticipated USD 11.4 billion in 2023 to USD 16.8 billion in 2030.
The demand for the global power leasing market is anticipated to be driven by the industrial sector's quick expansion and the rising need for a consistent and dependable power supply. The option of temporarily renting power plants or generators for supplying energy to industrial units is referred to as power rental. It provides existing power equipment in power plants as well as a variety of scalable components. Additionally, it gives companies the dependability, adaptability, speed, and cost-effectiveness they need to handle momentary power outages. The purpose of the power rental services is to maintain the utility power networks while supplying additional energy to businesses and local communities. Because of this, it has a wide range of applications in the building, mining, and oil & gas industries.
Covid-19 Impact
Due to the COVID-19 pandemic's rapid spread of infection, many economic and industrial activities have been put on hold. Sales in the power rental market fell in 2020 and 2021 as a result of worldwide lockdowns, travel limitations, work-from-home rules, and the delay of major events. The International Energy Agency (IEA) also claims that in 2020, the world's energy demand decreased by 5%, energy-related CO2 emissions decreased by 7%, and energy investment decreased by 18%. However, the industry is anticipated to perform strongly in the upcoming years because of the resumption of lockdowns, gradually rising manufacturing, and other power-consuming industries.
Market Segment
Insight by Fuel type
Based on fuel type diesel generators, gas generators and other generators are the components of the Power rental market. According to estimates, the power rental market's fastest-growing segment is natural gas. Since natural gas is the most inexpensive, efficient, and ecologically friendly fuel and is used efficiently to power emergency and portable generators, it is predicted to be the market’s key growth factor during the forecast period. The most important consideration while running a natural gas generator is the need for a well-established gas distribution network to ensure a consistent supply of natural gas to fuel the generators hence it will give a boost to other infrastructural and distribution-based energy & power and heavy vehicle markets sectors as well.
Insight by Application
The global power rental market can be divided into standby, baseload/continuous, and prime power based on the application. Since continuous load generators are used not only as a backup power source but also as a primary power source, continuous load dominates the worldwide power rental market among all market segments and is anticipated to maintain its dominance in terms of revenue over the forecast period. Additionally, it is predicted that during the forecast period, the peak load will be the segment with the most opportunity. This is due to the continually evolving infrastructures in many industries, especially to support tourism-related activities, which need access to power around the clock.
Insight by end-user
Based on end-users, the power rental market is divided into utilities, construction, oil & gas, manufacturing, mining, shipping, events, and other sectors. In terms of income, the mining industry led the world market for power rental. Due to the increased production and export of various minerals and metals to support the creation of various goods, the mining sector is rapidly growing throughout the world. The most reasonable segment, on the other hand, is anticipated to be the construction industry during the projected period. Players in the construction business prefer rental power because it reduces the expense of transporting and installing generators. Roadways, residential structures, and commercial areas are a few examples of construction projects.
Insight by product
The power rental market based on the product is bifurcated into machinery, earthmoving, material handling machinery, concrete, and road construction machinery. The earthmoving segment among all dominates the power rental market with a 50% share. The mining, agricultural, and construction industries' expanding use of earthmoving excavators considerably contributes to segment growth. Backhoe loaders, crawler excavators, skid-steer loaders, and micro excavators are examples of various earthmoving machinery with higher load capacities and superior engine performance. These characteristics of earthmoving machinery make them suited for usage in challenging working conditions.
Report Metric |
Details |
Historical Period |
2020 - 2024 |
Base Year Considered |
2025 |
Forecast Period |
2026 - 2035 |
Market Size in 2025 |
U.S.D. 11.3 Billion |
Revenue Forecast in 2035 |
U.S.D. 16.8 Billion |
Growth Rate |
7.6% |
Segments Covered in the Report |
By Fuel type, By Application, By end-user and By product |
Report Scope |
Market Trends, Drivers, and Restraints; Revenue Estimation and Forecast; Segmentation Analysis; Impact of COVID-19; Companies’ Strategic Developments; Market Share Analysis of Key Players; Company Profiling |
Regions Covered in the Report |
North America, Europe, Asia-Pacific, Middle East, and Rest of the World |
Industry Dynamics
Growth Drivers
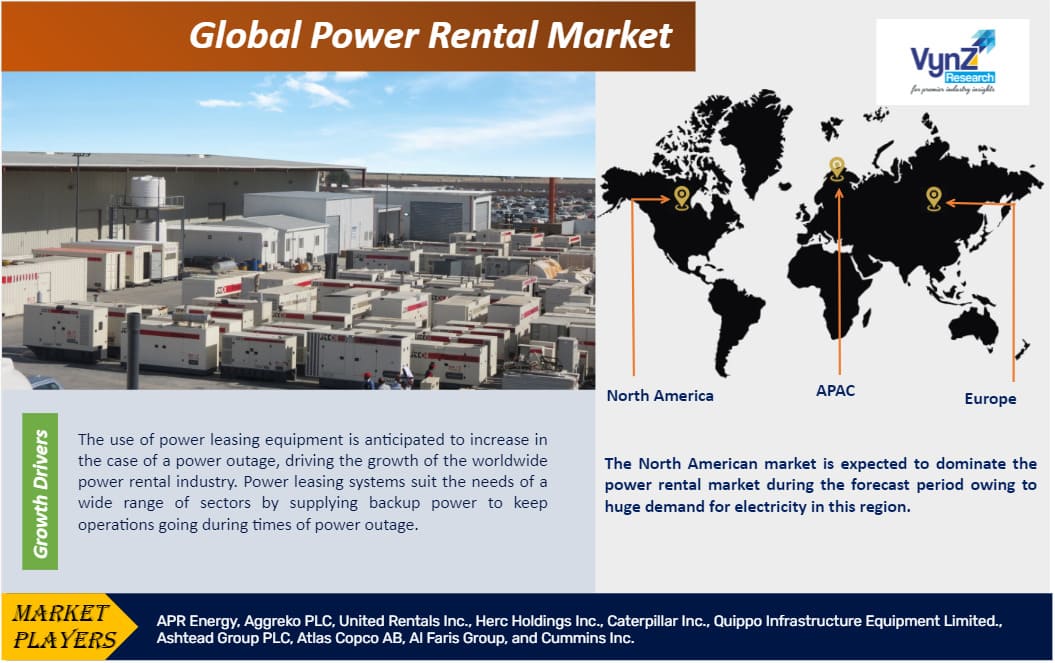
The use of power leasing equipment is anticipated to increase in the case of a power outage, driving the growth of the worldwide power rental industry. Power leasing systems suit the needs of a wide range of sectors by supplying backup power to keep operations going during times of power outage. The mining, gas, and oil industries need a constant supply of power, as well as the expanding demand for electrification and rural power delivery. The aging electrical infrastructure necessitates grid stabilization.
The mining industry primarily uses rented electricity. Because mining locations are not hooked into the grid, they rely on generator sets that have been rented temporarily. Rental generators are in moderate demand in manufacturing businesses when the existing power supply system, such as purchased generator sets, has to be maintained, extra power is required during peak load demand, or there is a brief outage. Therefore, the expansion of the power rental industry is crucial for industries with insufficient grid power supplies.
Challenges
The government agencies' strict emission restrictions and the impact of changing oil prices on industries that depend on oil are predicted to impede the expansion of the worldwide power rental business. Shortly, it is also anticipated that the market's growth will be hampered by the growing emphasis on renewable energy.
Industry Ecosystem
The market's potential will be expanded by greater investments in R&D and technology partnerships between significant market participants. The manufacturers are taking steps like mergers, partnerships, expansions, and acquisitions to maintain their market position. The major players in this industry are convincing people to use their products to satisfy the needs of a large population and achieve the goal of making energy accessible. The participants are growing their transmission and distribution networks to complete this task. More expenditure in R&D is anticipated shortly as a result of the companies' concentration on restructuring and putting successful packages into place. It is also anticipated that the adoption of several efficiency development measures and the application of environmentally friendly technologies will open up prospects for different market participants.
Geographical overview
North America is home to almost 530 million people and generates more than 25% of the world's gross domestic product. Hence it is projected that the North American region, which previously dominated the global market for power rentals, will hold its position throughout the projection period. The US and Canada markets in North America are growing the quickest. The International Monetary Fund projects that in 2022, the North American GDP will grow by roughly 5%. (IMF). Additionally, the rapid growth of commercial venues like hotels, malls, and retail stores has raised the demand for stable electricity and boosted power rental usage.
On the other hand, throughout the forecasted time, Asia-Pacific is anticipated to be the most advantageous segment. Nations like Thailand and Indonesia are developing their economic infrastructure significantly. The region's widespread adoption of Industrial Revolution 4.0 and growing digitalization would also significantly accelerate the industry's growth.
News & Update
Competitive Insight
Caterpillar Inc., Ashtead Group, United Rental, Ahern Rentals, and Aktio Corp. are well-known companies that dominated the global market in 2021. To increase their market share, these businesses employ tactics like geographic expansion and the introduction of new products. Additionally, they concentrate on improving their current product offers and brand recognition to achieve a competitive edge in the market. To expand their product line and increase market share, corporations frequently engage in mergers and acquisitions. For instance, General Finance Corporation's total asset acquisition by United Rental Inc. was announced in April 2021 as part of the company's strategic efforts to diversify its current product offering. In the market for renting construction equipment, some significant participants include Ahern Rentals Inc., AKTIO Corporation, Caterpillar Inc., Byrne Equipment Rental, Cramo Plc, Finning International Inc., Liebherr-International AG, Kanamoto Co. Ltd., Maxim Crane Works L.P., United Rentals, Inc.
The Power Rental Market report offers a comprehensive market segmentation analysis along with an estimation for the forecast period 2025–2030.
Segments Covered in the Report
Region Covered in the Report
Source: VynZ Research
1. Research Overview
1.1. The Report Offers
1.2. Market Coverage
1.2.1. By Application
1.2.2. By End-User
1.2.3. By Fuel Type
1.2.4. By Power Rating
1.2.5. By Region
1.3. Research Phases
1.4. Limitations
1.5. Market Size Estimations and Forecast
1.5.1. Data Sources
1.5.1.1. Primary Research
1.5.1.2. Secondary Research
1.5.2. Methodology
1.5.2.1. Data Exploration
1.5.2.2. Forecast Parameters
1.5.2.3. Data Validation
1.5.2.4. Assumptions
1.5.3. Study Period & Data Reporting Unit
2. Executive Summary
2.1. Market Description
2.2. Market Synopsis
3. Industry Overview
3.1. Market Segmentation
3.1.1. Application
3.1.1.1. Standby Power
3.1.1.2. Base Load/Continuous Power
3.1.1.3. Prime Power
3.1.2. End-User
3.1.2.1. Oil & Gas
3.1.2.2. Utilities
3.1.2.3. Mining
3.1.2.4. Industrial
3.1.2.5. Construction
3.1.2.6. Events
3.1.2.7. Others
3.1.3. Fuel Type
3.1.3.1. Diesel Generators
3.1.3.2. Gas Generators
3.1.3.3. Others
3.1.4. Power Rating
3.1.4.1. Up to 50 kW Power Rating
3.1.4.2. 51 kW–500 kW Power Rating
3.1.4.3. 501 kW–2,500 kW Power Rating
3.1.4.4. Above 2,500 kW Power Rating
3.2. Industry Dynamics
3.2.1. Major Drivers
3.2.2. Major Restraints
3.2.3. Key Trends
3.2.4. Key Opportunities
3.3. Industry Ecosystem
3.3.1. Porter’s Five Forces Analysis
3.3.2. Value Chain Analysis
3.4. Competitive Insight
3.4.1. Competitive Benchmark of Key Players
3.4.2. Company Share Analysis
4. Global Market Estimate and Forecast
4.1. Global Market Estimate and Forecast by Application
4.2. Global Market Estimate and Forecast by End User
4.3. Global Market Estimate and Forecast by Fuel Type
4.4. Global Market Estimate and Forecast by Power rating
4.5. Global Market Estimate and Forecast by Region
5. North America Market Estimate and Forecast
5.1. North America Market Estimate and Forecast by Application
5.2. North America Market Estimate and Forecast by End User
5.3. North America Market Estimate and Forecast by Fuel Type
5.4. North America Market Estimate and Forecast by Power Rating
5.5. North America Market Estimate and Forecast by Country
5.5.1. U.S. Market Estimate and Forecast
5.5.2. Canada Market Estimate and Forecast
6. Europe Market Estimate and Forecast
6.1. Europe Market Estimate and Forecast by Application
6.2. Europe Market Estimate and Forecast by End User
6.3. Europe Market Estimate and Forecast by Fuel Type
6.4. Europe Market Estimate and Forecast by Power Rating
6.5. Europe Market Estimate and Forecast by Country
6.5.1. Germany Market Estimate and Forecast
6.5.2. U.K. Market Estimate and Forecast
6.5.3. France Market Estimate and Forecast
6.5.4. Italy Market Estimate and Forecast
6.5.5. Spain Market Estimate and Forecast
6.5.6. Rest of Europe Market Estimate and Forecast
7. Asia-Pacific Market Estimate and Forecast
7.1. Asia-Pacific Market Estimate and Forecast by Application
7.2. Asia-Pacific Market Estimate and Forecast by End User
7.3. Asia-Pacific Market Estimate and Forecast by Fuel Type
7.4. Asia-Pacific Market Estimate and Forecast by Power Rating
7.5. Asia-Pacific Market Estimate and Forecast by Country
7.5.1. Japan Market Estimate and Forecast
7.5.2. China Market Estimate and Forecast
7.5.3. India Market Estimate and Forecast
7.5.4. Australia Market Estimate and Forecast
7.5.5. South Korea Market Estimate and Forecast
7.5.6. Thailand Market Estimate and Forecast
7.5.7. Rest of Asia-Pacific Market Estimate and Forecast
8. Latin America Market Estimate and Forecast
8.1. Latin America Market Estimate and Forecast by Application
8.2. Latin America Market Estimate and Forecast by End User
8.3. Latin America Market Estimate and Forecast by Fuel Type
8.4. Latin America Market Estimate and Forecast by Power Rating
8.5. Latin America Market Estimate and Forecast by Country
8.5.1. Brazil Market Estimate and Forecast
8.5.2. Mexico Market Estimate and Forecast
8.5.3. Rest of Latin Market Estimate and Forecast
9. Middle East and Africa (MEA) Market Estimate and Forecast
9.1. MEA Market Estimate and Forecast by Application
9.2. MEA Market Estimate and Forecast by End User
9.3. MEA Market Estimate and Forecast by Fuel Type
9.4. MEA Market Estimate and Forecast by Power Rating
9.5. MEA Market Estimate and Forecast by Country
9.5.1. South Africa Market Estimate and Forecast
9.5.2. Saudi Arabia Market Estimate and Forecast
9.5.3. Rest of MEA Market Estimate and Forecast
10. Company Profiles
10.1. APR Energy
10.1.1. Snapshot
10.1.2. Overview
10.1.3. Offerings
10.1.4. Financial Insight
10.1.5. Recent Developments
10.2. Aggreko PLC
10.2.1. Snapshot
10.2.2. Overview
10.2.3. Offerings
10.2.4. Financial Insight
10.2.5. Recent Developments
10.3. United Rentals Inc.
10.3.1. Snapshot
10.3.2. Overview
10.3.3. Offerings
10.3.4. Financial Insight
10.3.5. Recent Developments
10.4. Herc Holdings Inc.
10.4.1. Snapshot
10.4.2. Overview
10.4.3. Offerings
10.4.4. Financial Insight
10.4.5. Recent Developments
10.5. Caterpillar Inc.
10.5.1. Snapshot
10.5.2. Overview
10.5.3. Offerings
10.5.4. Financial Insight
10.5.5. Recent Developments
10.6. Quippo Infrastructure Equipment Limited.
10.6.1. Snapshot
10.6.2. Overview
10.6.3. Offerings
10.6.4. Financial Insight
10.6.5. Recent Developments
10.7. Ashtead Group PLC
10.7.1. Snapshot
10.7.2. Overview
10.7.3. Offerings
10.7.4. Financial Insight
10.7.5. Recent Developments
10.8. Atlas Copco AB
10.8.1. Snapshot
10.8.2. Overview
10.8.3. Offerings
10.8.4. Financial Insight
10.8.5. Recent Developments
10.9. Al Faris Group
10.9.1. Snapshot
10.9.2. Overview
10.9.3. Offerings
10.9.4. Financial Insight
10.9.5. Recent Developments
10.10. Cummins Inc.
10.10.1. Snapshot
10.10.2. Overview
10.10.3. Offerings
10.10.4. Financial Insight
10.10.5. Recent Developments
11. Appendix
11.1. Abbreviations
11.2. Exchange Rates
Note:- Financial insights & Recent developments, are subject to availability of information in secondary domain.
List of Tables
Table 1 Sources
Table 2 Study Periods
Table 3 Data Reporting Unit
Table 4 Global Power Rental Market Size, By Application, USD Billion (2018-2023)
Table 5 Global Power Rental Market Size, By Application, USD Billion (2025-2030)
Table 6 Global Power Rental Market Size, By End User, USD Billion (2018-2023)
Table 7 Global Power Rental Market Size, By End User, USD Billion (2025-2030)
Table 8 Global Power Rental Market Size, By Fuel Type, USD Billion (2018-2023)
Table 9 Global Power Rental Market Size, By Fuel Type, USD Billion (2025-2030)
Table 10 Global Power Rental Market Size, By Power Rating, USD Billion (2018-2023)
Table 11 Global Power Rental Market Size, By Power Rating, USD Billion (2025-2030)
Table 12 Global Power Rental Market Size, By Region, USD Billion (2018-2023)
Table 13 Global Power Rental Market Size, By Region, USD Billion (2025-2030)
Table 14 North America Power Rental Market Size, By Application, USD Billion (2018-2023)
Table 15 North America Power Rental Market Size, By Application, USD Billion (2025-2030)
Table 16 North America Power Rental Market Size, By End User, USD Billion (2018-2023)
Table 17 North America Power Rental Market Size, By End User, USD Billion (2025-2030)
Table 18 North America Power Rental Market Size, By Fuel Type, USD Billion (2018-2023)
Table 19 North America Power Rental Market Size, By Fuel Type, USD Billion (2025-2030)
Table 20 North America Power Rental Market Size, By Power Rating, USD Billion (2018-2023)
Table 21 North America Power Rental Market Size, By Power Rating, USD Billion (2025-2030)
Table 22 North America Power Rental Market Size, By Country, USD Billion (2018-2023)
Table 23 North America Power Rental Market Size, By Country, USD Billion (2025-2030)
Table 24 Europe Power Rental Market Size, By Application, USD Billion (2018-2023)
Table 25 Europe Power Rental Market Size, By Application, USD Billion (2025-2030)
Table 26 Europe Power Rental Market Size, By End User, USD Billion (2018-2023)
Table 27 Europe Power Rental Market Size, By End User, USD Billion (2025-2030)
Table 28 Europe Power Rental Market Size, By Fuel Type, USD Billion (2018-2023)
Table 29 Europe Power Rental Market Size, By Fuel Type, USD Billion (2025-2030)
Table 30 Europe Power Rental Market Size, By Power Rating, USD Billion (2018-2023)
Table 31 Europe Power Rental Market Size, By Power Rating, USD Billion (2025-2030)
Table 32 Europe Power Rental Market Size, By Country, USD Billion (2018-2023)
Table 33 Europe Power Rental Market Size, By Country, USD Billion (2025-2030)
Table 34 Asia-Pacific Power Rental Market Size, By Application, USD Billion (2018-2023)
Table 35 Asia-Pacific Power Rental Market Size, By Application, USD Billion (2025-2030)
Table 36 Asia-Pacific Power Rental Market Size, By End User, USD Billion (2018-2023)
Table 37 Asia-Pacific Power Rental Market Size, By End User, USD Billion (2025-2030)
Table 38 Asia-Pacific Power Rental Market Size, By Fuel Type, USD Billion (2018-2023)
Table 39 Asia-Pacific Power Rental Market Size, By Fuel Type, USD Billion (2025-2030)
Table 40 Asia-Pacific Power Rental Market Size, By Power Rating, USD Billion (2018-2023)
Table 41 Asia-Pacific Power Rental Market Size, By Power Rating, USD Billion (2025-2030)
Table 42 Asia-Pacific Power Rental Market Size, By Country, USD Billion (2018-2023)
Table 43 Asia-Pacific Power Rental Market Size, By Country, USD Billion (2025-2030)
Table 44 Latin America Power Rental Market Size, By Application, USD Billion (2018-2023)
Table 45 Latin America Power Rental Market Size, By Application, USD Billion (2025-2030)
Table 46 Latin America Power Rental Market Size, By End User, USD Billion (2018-2023)
Table 47 Latin America Power Rental Market Size, By End User, USD Billion (2025-2030)
Table 48 Latin America Power Rental Market Size, By Fuel Type, USD Billion (2018-2023)
Table 49 Latin America Power Rental Market Size, By Fuel Type, USD Billion (2025-2030)
Table 50 Latin America Power Rental Market Size, By Power Rating, USD Billion (2018-2023
Table 51 Latin America Power Rental Market Size, By Power Rating, USD Billion (2025-2030)
Table 52 Latin America Power Rental Market Size, By Country, USD Billion (2018-2023)
Table 53 Latin America Power Rental Market Size, By Country, USD Billion (2025-2030)
Table 54 MEA Power Rental Market Size, By Application, USD Billion (2018-2023)
Table 55 MEA Power Rental Market Size, By Application, USD Billion (2025-2030)
Table 56 MEA Power Rental Market Size, By End User, USD Billion (2018-2023)
Table 57 MEA Power Rental Market Size, By End User, USD Billion (2025-2030)
Table 58 MEA Power Rental Market Size, By Fuel Type, USD Billion (2018-2023)
Table 59 MEA Power Rental Market Size, By Fuel Type, USD Billion (2025-2030)
Table 60 MEA Power Rental Market Size, By Power Rating, USD Billion (2018-2023)
Table 61 MEA Power Rental Market Size, By Power Rating, USD Billion (2025-2030)
Table 62 MEA Power Rental Market Size, By Country, USD Billion (2018-2023)
Table 63 MEA Power Rental Market Size, By Country, USD Billion (2025-2030)
Table 64 Snapshot – APR Energy
Table 65 Snapshot – Aggreko PLC
Table 66 Snapshot – United Rentals Inc.
Table 67 Snapshot – Herc Holdings Inc.
Table 68 Snapshot – Caterpillar Inc.
Table 69 Snapshot – Quippo Infrastructure Equipment Limited.
Table 70 Snapshot – Ashtead Group PLC
Table 71 Snapshot – Atlas Copco AB
Table 72 Snapshot – Al Faris Group
Table 73 Snapshot – Cummins Inc.
List of Figures
Figure 1 Market Coverage
Figure 2 Research Phases
Figure 3 Secondary Sources for Different Parameters
Figure 4 Methodology
Figure 5 Data Mining & Exploration
Figure 6 Data Triangulation
Figure 7 Assumptions for Market Estimation and Forecast
Figure 8 Global Power Rental Market - Growth Drivers and Restraints
Figure 9 Value Chain Analysis
Figure 10 Competitive Benchmarking
Figure 11 Global Power Rental Market Highlight
Figure 12 Global Power Rental Market Size, By Application, USD Billion (2018 - 2030)
Figure 13 Global Power Rental Market Size, By End User, USD Billion (2018 - 2030)
Figure 14 Global Power Rental Market Size, By Fuel Type, USD Billion (2018 - 2030)
Figure 15 Global Power Rental Market Size, By Power Rating, USD Billion (2018 - 2030)
Figure 16 Global Power Rental Market Size, By Region, USD Billion (2018 - 2030)
Figure 17 North America Power Rental Market Highlight
Figure 18 North America Power Rental Market Size, By Application, USD Billion (2018 - 2030)
Figure 19 North America Power Rental Market Size, By End User, USD Billion (2018 - 2030)
Figure 20 North America Power Rental Market Size, By Fuel Type, USD Billion (2018 - 2030)
Figure 21 North America Power Rental Market Size, By Power Rating, USD Billion (2018 - 2030)
Figure 22 North America Power Rental Market Size, By Country, USD Billion (2018 - 2030)
Figure 23 Europe Power Rental Market Highlight
Figure 24 Europe Power Rental Market Size, By Application, USD Billion (2018 - 2030)
Figure 25 Europe Power Rental Market Size, By End User, USD Billion (2018 - 2030)
Figure 26 Europe Power Rental Market Size, By Fuel Type, USD Billion (2018 - 2030)
Figure 27 Europe Power Rental Market Size, By Power Rating, USD Billion (2018 - 2030)
Figure 28 Europe Power Rental Market Size, By Country, USD Billion (2018 - 2030)
Figure 29 Asia-Pacific Power Rental Market Highlight
Figure 30 Asia-Pacific Power Rental Market Size, By Application, USD Billion (2018 - 2030)
Figure 31 Asia-Pacific Power Rental Market Size, By End User, USD Billion (2018 - 2030)
Figure 32 Asia-Pacific Power Rental Market Size, By Fuel Type, USD Billion (2018 - 2030)
Figure 33 Asia-Pacific Power Rental Market Size, By Power Rating, USD Billion (2018 - 2030)
Figure 34 Asia-Pacific Power Rental Market Size, By Country, USD Billion (2018 - 2030)
Figure 35 Latin America Power Rental Market Highlight
Figure 36 Latin America Power Rental Market Size, By Application, USD Billion (2018 - 2030)
Figure 37 Latin America Power Rental Market Size, By End User, USD Billion (2018 - 2030)
Figure 38 Latin America Power Rental Market Size, By Fuel Type, USD Billion (2018 - 2030)
Figure 39 Latin America Power Rental Market Size, By Power Rating, USD Billion (2018 - 2030)
Figure 40 Latin America Power Rental Market Size, By Country, USD Billion (2018 - 2030)
Figure 41 MEA Power Rental Market Highlight
Figure 42 MEA Power Rental Market Size, By Application, USD Billion (2018 - 2030)
Figure 43 MEA Power Rental Market Size, By End User, USD Billion (2018 - 2030)
Figure 44 MEA Power Rental Market Size, By Fuel Type, USD Billion (2018 - 2030)
Figure 45 MEA Power Rental Market Size, By Power Rating, USD Billion (2018 - 2030)
Figure 46 MEA Power Rental Market Size, By Country, USD Billion (2018 - 2030)
Global Power Rental Market Coverage
Application Insight and Forecast 2025-2030
End-User Insight and Forecast 2025-2030
Fuel Type Insight and Forecast 2025-2030
Product Insight and Forecast 2025-2030
Geographical Segmentation
Power Rental Market by Region
North America
Europe
Asia Pacific
Latin America
Middle East and Africa
Vynz Research know in your business needs, you required specific answers pertaining to the market, Hence, our experts and analyst can provide you the customized research support on your specific needs.
After the purchase of current report, you can claim certain degree of free customization within the scope of the research.
Please let us know, how we can serve you better with your specific requirements to your research needs. Vynz research promises for quick reversal for your current business requirements.
Purchase Options
Latest Report
Research Methodology
Connect With Our Sales Team