| Status : Published | Published On : Feb, 2023 | Report Code : VREP3026 | Industry : Energy & Power | Available Format : 


                     | 
                                                
                            Page : 210 | 
The global Sustainable Steel Market or green steel market size is expected to grow from USD 321.91 billion in 2023 to USD 701.5 billion by 2030, registering a CAGR of 9.1 % during the forecast period. Steel is the most often used metal in the world today, and it can be found in many facets of daily life, including automobiles, airplanes, and ships, as well as washing machines and household items. However, as governments and industries around the world are looking forward to reducing carbon emissions to meet ambitious net-zero targets, steel is gaining attention. Around 75% of steel is still produced in coal-fired blast furnaces, which emit significant amounts of CO2 into the atmosphere. Huge amounts of energy are also required to heat the furnaces to temperatures above 1,000 degrees Celsius. According to the World Economic Forum, steel production accounts for approximately 8% of global emissions.

According to the International Energy Agency (IEA), steel emissions must be reduced by 50% by 2050 and then continue to fall to meet the world's climate goals which can be possible when opting for green steel. Green steel is steel produced without using fossil fuels. Green hydrogen is indeed a solution that will aid the steel industry in reducing its carbon footprint. Burning hydrogen solely results in the production of water. And if that hydrogen is produced through electrolysis using only water and renewable electricity, it emits no CO2. Thus, several countries are anticipated to adopt green steel to minimize carbon emissions and attain sustainable development goals in the future.
Market Segmentation
Insight by Production Technology
Based on Production Technology, the Global Sustainable Steel Market is bifurcated into Electric Arc Furnace and Molten Oxide Electrolysis. EAF technology has a solid foundation for producing green steel. Furthermore, the increase in the price of CO2 emission certificates for steel manufacturers has facilitated the use of technology for the production of green steel. Furthermore, the government’s efforts to minimize carbon emissions during steel production across Europe will result in increasing the deployment of electric arc furnaces for green steel production during the forecast period.
Insight by Energy Source
Based on Energy Sources, the Global Sustainable Steel Market is segmented into Solar, Wind, and Others (Biomass Energy, Hydropower, etc.). In Europe, Asia-Pacific, and North America, there are well-established green hydrogen production plants that use wind energy to produce hydrogen. With increased investment in renewable energy production to reduce carbon emissions, the respective categories, namely wind and solar, are expected to increase their market share for the production of sustainable steel in the years ahead.
Insight by End User
Based on End Users, the Global Sustainable Steel Market is segregated into Building & Construction, Electronics, Industrial Equipment, Automotive & Transportation, and Others. Due to the growing awareness among auto manufacturers about a reduction in carbon footprints and the use of sustainable products, such as green steel, for the production of automobiles and spare parts, the automotive and transportation sector is anticipated to have a sizable share during the forecast period.
| 
			 Report Metric  | 
			
			 Details  | 
		
| 
			 Historical Period  | 
			
			 2020 - 2024  | 
		
| 
			 Base Year Considered  | 
			
			 2025  | 
		
| 
			 Forecast Period  | 
			
			 2026 - 2035  | 
		
| 
			 Market Size in 2025  | 
			
			 U.S.D. 321 Billion  |             
		
| 
			 Revenue Forecast in 2035  | 
			
			 U.S.D. 701.5 Billion  | 
		
| 
			 Growth Rate  | 
			
			 9.1%  | 
		
| 
			 Segments Covered in the Report  | 
			
			 By Production Technology, By Energy Source, and By End-User  | 
		
| 
			 Report Scope  | 
			
			 Market Trends, Drivers, and Restraints; Revenue Estimation and Forecast; Segmentation Analysis; Impact of COVID-19; Companies’ Strategic Developments; Market Share Analysis of Key Players; Company Profiling  | 
		
| 
			 Regions Covered in the Report  | 
			
			 North America, Europe, Asia-Pacific, Middle East, and Rest of the World  | 
		
Industry Dynamics
Growth Drivers
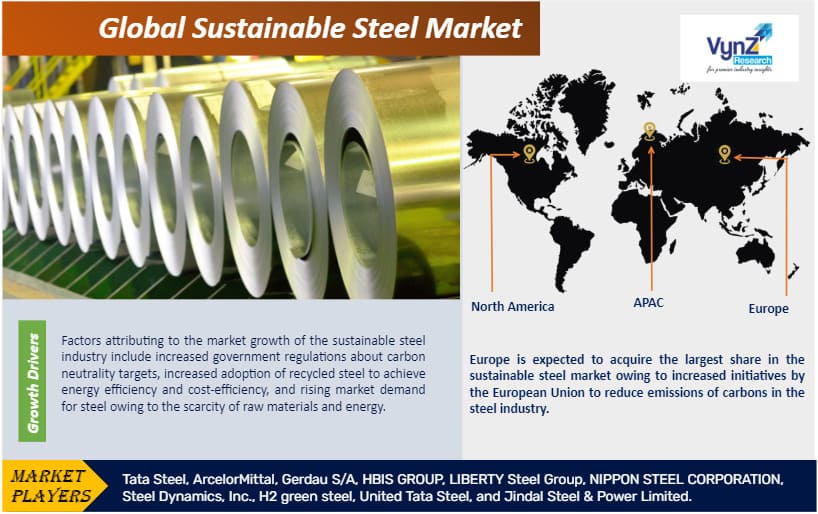
Factors attributing to the market growth of the sustainable steel industry include increased government regulations about carbon neutrality targets, increased adoption of recycled steel to achieve energy efficiency and cost-efficiency, and rising market demand for steel owing to the scarcity of raw materials and energy. As the global sustainable market is in the developing stage which has led to increasing investments in green technologies, rising demand for green steel in the value chain, shifting business models of companies owing to climate change, and the development of environmental and economic growth.
Various end-use sectors, such as automotive, building & construction, etc., are anticipated to increase their demand for low-carbon steel as a result of their goals to employ sustainable products. The global market is likely to be driven predominantly by governments in the United States, Canada, Germany, France, United Kingdom, etc., towards reducing carbon emissions and implementing sustainable products and manufacturing practices in end-use industries such as construction, electronics, industrial equipment, etc.
Challenges
Impurities in recycled steel because of inadequate separation and sophisticated product design, as well as the high cost of production for green steel owing to high infrastructure costs and green hydrogen prices, are some key market restraints.
Opportunities
As sustainable steel is manufactured completely from renewable sources like green hydrogen, the flourishing research and development in fuel cell electric vehicles (FCEVs) and hydrogen-powered cars will have a favorable impact on the technological development of green steel. In addition, a few nations in the Asia-Pacific area, including China, South Korea, New Zealand, etc. now use FCEVs thanks to manufacturers like Toyota, Hyundai, and others. In the upcoming years, they also intend to employ green hydrogen in their cars, which will help the global green steel market flourish. These factors will propel market opportunities in the global green sustainable steel industry.
Geographic Overview
Europe is expected to acquire the largest share in the sustainable steel market owing to increased initiatives by the European Union to reduce emissions of carbons in the steel industry. "Green Steel for Europe" assists the EU in meeting the 2030 climate and energy targets, as well as the 2050 long-term strategy for a climate-neutral Europe, by providing effective clean steelmaking solutions.
Competitive Insight
The industry players are prominently investing to launch greenfield projects and focus on building strategic collaborations and partnerships, thereby accelerating the market development of the global sustainable steel industry.
HBIS is intended to transition from "green manufacturing" to "Make green" and aspires to be a "green development" leader. Since its inception, HBIS has adhered to the philosophy of "human being and steel harmoniously coexisting," and has actively promoted a "green" leading strategy, investing approximately 21.9 billion RMB in over 500 energy conservation and emissions reduction projects. HBIS implements the goals and requirements of "carbon peaking and carbon neutralization" with zeal and creates a Low Carbon & Green Development Action Plan that focuses on developing innovation in energy, material, and process technology. Carbon emissions from HBIS will peak in 2022, and carbon neutralization will take place in four stages: carbon peaking, steady decline, relatively significant decline, and deep decarbonization.
LIBERTY, like all steel producers, faces a significant challenge in decarbonizing their operations, but they remain optimistic about the industry's long-term prospects. Through its GREENSTEEL strategies, LIBERTY strives to transform steel manufacturing into a global product and technology leader. GREEN STEEL uses electric arc furnaces fueled by renewable energy to recycle and upcycle the growing amount of scrap steel. GREEN STEEL offers a more flexible and customer-focused solution while also lowering the carbon footprint, shortening the supply chain, retaining and upgrading skills, stimulating new technologies, and fostering a sustainable and globally competitive metal manufacturing sector.
LIBERTY is actively pursuing GREENSTEEL in the United Kingdom, Europe, Australia, and the United States, while also developing plans to develop strategies worldwide.
Recent Development by Key Players
After switching to hydrogen-based steel production, Tata Steel's IJmuiden factory in the Netherlands will provide "Jeremias green steel" to Ford, an American automaker in October 2022. To achieve the company's aim of producing CO2-neutral steel in Europe by 2050, both of the company's divisions, Tata Steel UK and Tata Steel Netherland have been preparing detailed plans for the transition to low CO2 technology.
In October 2022, LIBERTY Steel UK completed evoke trials, a sustainable new raw material that can replace anthracite, the main source of charge carbon in electric steelmaking, and reduce steel's carbon footprint by up to 30%
Key Players Covered in the Report
Some of the major players in the global sustainable steel market include Tata Steel, ArcelorMittal, Gerdau S/A, HBIS GROUP, LIBERTY Steel Group, NIPPON STEEL CORPORATION, Steel Dynamics, Inc., H2 Green Steel, United Tata Steel, and Jindal Steel & Power Limited.
The Sustainable Steel Market report offers a comprehensive market segmentation analysis along with an estimation for the forecast period 2023–2030.
Segments Covered in the Report
Region Covered in the Report
.png)
Source: VynZ Research
.png)
Source: VynZ Research
1. Research Overview
        1.1.    The Report Offers
        1.2.    Market Coverage
                1.2.1.    By Production Technology
                1.2.2.    By Energy Source
                1.2.3.    By End User
                1.2.4.    By Region
        1.3.    Research Phases
        1.4.    Limitations
        1.5.    Market Methodology
                1.5.1.    Data Sources
                        1.5.1.1. Primary Research
                        1.5.1.2. Secondary Research
                1.5.2.    Methodology
                        1.5.2.1. Data Exploration
                        1.5.2.2. Forecast Parameters
                        1.5.2.3. Data Validation
                        1.5.2.4. Assumptions
                1.5.3.    Study Period & Data Reporting Unit
2. Executive Summary
3. Industry Overview
        3.1.    Industry Dynamics
                3.1.1.    Market Growth Drivers
                3.1.2.    Market Restraints
                3.1.3.    Key Market Trends
                3.1.4.    Major Opportunities
        3.2.    Industry Ecosystem
                3.2.1.    Porter’s Five Forces Analysis
                3.2.2.    Recent Development Analysis
                3.2.3.    Value Chain Analysis
        3.3.    Competitive Insight
                3.3.1.    Competitive Position of Industry Players
                3.3.2.    Market Attractive Analysis
                3.3.3.    Market Share Analysis
4. Global Market Estimate and Forecast
        4.1.    Global Market Overview
        4.2.    Global Market Estimate and Forecast to 2030
5. Market Segmentation Estimate and Forecast
        5.1.    By Production Technology
                5.1.1.    Electric Arc Furnace
                        5.1.1.1. Market Definition
                        5.1.1.2. Market Estimation and Forecast to 2030 
                5.1.2.    Molten Oxide Electrolysis
                        5.1.2.1. Market Definition
                        5.1.2.2. Market Estimation and Forecast to 2030
                
        5.2.    By Energy Source
                5.2.1.    Solar
                        5.2.1.1. Market Definition
                        5.2.1.2. Market Estimation and Forecast to 2030
                5.2.2.    Wind
                        5.2.2.1. Market Definition
                        5.2.2.2. Market Estimation and Forecast to 2030
                5.2.3.    Others
                        5.2.3.1. Market Definition
                        5.2.3.2. Market Estimation and Forecast to 2030
        5.3.    By End User
                5.3.1.    Building & Construction 
                        5.3.1.1. Market Definition
                        5.3.1.2. Market Estimation and Forecast to 2030
                5.3.2.    Electronics
                        5.3.2.1. Market Definition
                        5.3.2.2. Market Estimation and Forecast to 2030
                5.3.3.    Industrial Equipment
                        5.3.3.1. Market Definition
                        5.3.3.2. Market Estimation and Forecast to 2030
                5.3.4.    Automotive & Transportation
                        5.3.4.1. Market Definition
                        5.3.5.2. Market Estimation and Forecast to 2030
                5.3.5.    Others
                        5.3.5.1. Market Definition
                        5.3.5.2. Market Estimation and Forecast to 2030
                            
6.    North America Market Estimate and Forecast
        6.1.    By Production Technology
        6.2.    By Energy Source
        6.3.    By End User
        6.4.    By Country
                6.4.1.    U.S. Market Estimate and Forecast
                6.4.2.    Canada Market Estimate and Forecast
                6.4.3.    Mexico Market Estimate and Forecast
7. Europe Market Estimate and Forecast
        7.1.    By Production Technology
        7.2.    By Energy Source
        7.3.    By End User
        7.4.    By Country
                7.4.1.    Germany Market Estimate and Forecast
                7.4.2.    France Market Estimate and Forecast
                7.4.3.    U.K. Market Estimate and Forecast
                7.4.4.    Italy Market Estimate and Forecast
                7.4.5.    Spain Market Estimate and Forecast
                7.4.6.    Rest of Europe Market Estimate and Forecast
8. Asia-Pacific Market Estimate and Forecast
        8.1.    By Production Technology
        8.2.    By Energy Source
        8.3.    By End User
        8.4.    By Country
                8.4.1.    China Market Estimate and Forecast
                8.4.2.    Japan Market Estimate and Forecast
                8.4.3.    India Market Estimate and Forecast
                8.4.4.    South Korea Market Estimate and Forecast
                8.4.5.    Singapore Market Estimate and Forecast
                8.4.6.    Rest of Asia-Pacific Market Estimate and Forecast
9. Rest of the World (RoW) Market Estimate and Forecast
        9.1.    By Production Technology
        9.2.    By Energy Source
        9.3.    By End User
        9.4.    By Country
                9.4.1.    Brazil Market Estimate and Forecast
                9.4.2.    Saudi Arabia Market Estimate and Forecast
                9.4.3.    South Africa Market Estimate and Forecast
                9.4.4.    Other Countries Market Estimate and Forecast
10. Company Profiles
        10.1.     Tata Steel
                10.1.1.    Snapshot
                10.1.2.    Overview
                10.1.3.    Offerings
                10.1.4.    Financial Insight
                10.1.5.    Recent Developments
        10.2.     ArcelorMittal
                10.2.1.    Snapshot
                10.2.2.    Overview
                10.2.3.    Offerings
                10.2.4.    Financial Insight
                10.2.5.    Recent Developments
        10.3. Gerdau S/A
                10.3.1.    Snapshot
                10.3.2.    Overview
                10.3.3.    Offerings
                10.3.4.    Financial Insight
                10.3.5.    Recent Developments
        10.4.    HBIS GROUP
                10.4.1.    Snapshot
                10.4.2.    Overview
                10.4.3.    Offerings
                10.4.4.    Financial Insight
                10.4.5.    Recent Developments
        10.5. LIBERTY Steel Group
                10.5.1.    Snapshot
                10.5.2.    Overview
                10.5.3.    Offerings
                10.5.4.    Financial Insight
                10.5.5.    Recent Developments
        10.6. NIPPON STEEL CORPORATION
                10.6.1.    Snapshot
                10.6.2.    Overview
                10.6.3.    Offerings
                10.6.4.    Financial Insight
                10.6.5.    Recent Developments
        10.7.    Steel Dynamics, Inc.
                10.7.1.    Snapshot
                10.7.2.    Overview
                10.7.3.    Offerings
                10.7.4.    Financial Insight
                10.7.5.    Recent Developments
        10.8.    H2 green steel
                10.8.1.    Snapshot
                10.8.2.    Overview
                10.8.3.    Offerings
                10.8.4.    Financial Insight
                10.8.5.    Recent Developments
        10.9.    United States Steel Corporation
                10.9.1.    Snapshot
                10.9.2.    Overview
                10.9.3.    Offerings
                10.9.4.    Financial Insight
                10.9.5.    Recent Developments
        10.10. Jindal Steel & Power Limited
                10.10.1. Snapshot
                10.10.2. Overview
                10.10.3. Offerings
                10.10.4. Financial Insight
                10.10.5. Recent Developments
11. Appendix
        11.1.    Exchange Rates
        11.2.    Abbreviations
Note: Financial insight and recent developments of different companies are subject to availability of information in secondary domain.
List of Tables
Table 1 Sources
Table 2 Study Periods
Table 3 Data Reporting Unit
Table 4 Global Sustainable Steel Market Size, By Production Technology, 2018 - 2023 (USD Billion)
Table 5 Global Sustainable Steel Market Size, By Production Technology, 2025 - 2030 (USD Billion)
Table 6 Global Sustainable Steel Market Size, By Energy Source, 2018 - 2023 (USD Billion)
Table 7 Global Sustainable Steel Market Size, By Energy Source, 2025 - 2030 (USD Billion)
Table 8 Global Sustainable Steel Market Size, By End User, 2018 - 2023 (USD Billion)
Table 9 Global Sustainable Steel Market Size, By End User, 2025 - 2030 (USD Billion)
Table 10 Global Sustainable Steel Market Size, by Region, 2018 - 2023 (USD Billion)
Table 11 Global Sustainable Steel Market Size, by Region, 2025 - 2030 (USD Billion)
Table 12 North America Sustainable Steel Market Size, By Production Technology, 2018 - 2023 (USD Billion)
Table 13 North America Sustainable Steel Market Size, By Production Technology, 2025 - 2030 (USD Billion)
Table 14 North America Sustainable Steel Market Size, By Energy Source, 2018 - 2023 (USD Billion)
Table 15 North America Sustainable Steel Market Size, By Energy Source, 2025 - 2030 (USD Billion)
Table 16 North America Sustainable Steel Market Size, By End User, 2018 - 2023 (USD Billion)
Table 17 North America Sustainable Steel Market Size, By End User, 2025 - 2030 (USD Billion)
Table 18 North America Sustainable Steel Market Size, by Region, 2018 - 2023 (USD Billion)
Table 19 North America Sustainable Steel Market Size, by Region, 2025 - 2030 (USD Billion)
Table 20 Europe Sustainable Steel Market Size, By Production Technology, 2018 - 2023 (USD Billion)
Table 21 Europe Sustainable Steel Market Size, By Production Technology, 2025 - 2030 (USD Billion)
Table 22 Europe Sustainable Steel Market Size, By Energy Source, 2018 - 2023 (USD Billion)
Table 23 Europe Sustainable Steel Market Size, By Energy Source, 2025 - 2030 (USD Billion)
Table 24 Europe Sustainable Steel Market Size, By End User, 2018 - 2023 (USD Billion)
Table 25 Europe Sustainable Steel Market Size, By End User, 2025 - 2030 (USD Billion)
Table 26 Europe Sustainable Steel Market Size, by Region, 2018 - 2023 (USD Billion)
Table 27 Europe Sustainable Steel Market Size, by Region, 2025 - 2030 (USD Billion)
Table 28 Asia-Pacific Sustainable Steel Market Size, By Production Technology, 2018 - 2023 (USD Billion)
Table 29 Asia-Pacific Sustainable Steel Market Size, By Production Technology, 2025 - 2030 (USD Billion)
Table 30 Asia-Pacific Sustainable Steel Market Size, By Energy Source, 2018 - 2023 (USD Billion)
Table 31 Asia-Pacific Sustainable Steel Market Size, By Energy Source, 2025 - 2030 (USD Billion)
Table 32 Asia-Pacific Sustainable Steel Market Size, By End User, 2018 - 2023 (USD Billion)
Table 33 Asia-Pacific Sustainable Steel Market Size, By End User, 2025 - 2030 (USD Billion)
Table 34 Asia-Pacific Sustainable Steel Market Size, by Region, 2018 - 2023 (USD Billion)
Table 35 Asia-Pacific Sustainable Steel Market Size, by Region, 2025 - 2030 (USD Billion)
Table 36 RoW Sustainable Steel Market Size, By Production Technology, 2018 - 2023 (USD Billion)
Table 37 RoW Sustainable Steel Market Size, By Production Technology, 2025 - 2030 (USD Billion)
Table 38 RoW Sustainable Steel Market Size, By Energy Source, 2018 - 2023 (USD Billion)
Table 39 RoW Sustainable Steel Market Size, By Energy Source, 2025 - 2030 (USD Billion)
Table 40 RoW Sustainable Steel Market Size, By End User, 2018 - 2023 (USD Billion)
Table 41 RoW Sustainable Steel Market Size, By End User, 2025 - 2030 (USD Billion)
Table 42 RoW Sustainable Steel Market Size, by Region, 2018 - 2023 (USD Billion)
Table 43 RoW Sustainable Steel Market Size, by Region, 2025 - 2030 (USD Billion)
Table 44 Snapshot – Tata Steel
Table 45 Snapshot – ArcelorMittal
Table 46 Snapshot – Gerdau S/A
Table 47 Snapshot – HBIS GROUP
Table 48 Snapshot – LIBERTY Steel Group
Table 49 Snapshot – NIPPON STEEL CORPORATION
Table 50 Snapshot – Steel Dynamics, Inc.
Table 51 Snapshot – H2 green steel
Table 52 Snapshot – United States Steel Corporation
Table 53 Snapshot – Jindal Steel & Power Limited
List of Figures
Figure 1 Market Coverage
Figure 2 Research Phases
Figure 3 Secondary Sources for Different Parameters
Figure 4 Methodology
Figure 5 Data Mining & Exploration
Figure 6 Data Triangulation
Figure 7 Assumptions for Market Estimation and Forecast
Figure 8 Market Synopsis
Figure 9 Global Sustainable Steel Market - Growth Drivers and Restraints
Figure 10 Competitive Benchmark
Figure 11 Global Sustainable Steel Market Highlight
Figure 12 Global Sustainable Steel Market Size, By Production Technology, 2018-2021 (USD Billion)
Figure 13 Global Sustainable Steel Market Size, By Energy Source, 2018-2021 (USD Billion)
Figure 14 Global Sustainable Steel Market Size, By End User, 2018-2021 (USD Billion)
Figure 15 Global Sustainable Steel Market Size, by Region, 2018-2021 (USD Billion)
Figure 16 North America Sustainable Steel Market Highlight
Figure 17 North America Sustainable Steel Market Size, By Production Technology, 2018 - 2030 (USD Billion)
Figure 18 North America Sustainable Steel Market Size, By Energy Source, 2018 - 2030 (USD Billion)
Figure 19 North America Sustainable Steel Market Size, By End User, 2018 - 2030 (USD Billion)
Figure 20 North America Sustainable Steel Market Size, by Region, 2018 - 2030 (USD Billion)
Figure 21 Europe Sustainable Steel Market Highlight
Figure 22 Europe Sustainable Steel Market Size, By Production Technology, 2018 - 2030 (USD Billion)
Figure 23 Europe Sustainable Steel Market Size, By Energy Source, 2018 - 2030 (USD Billion)
Figure 24 Europe Sustainable Steel Market Size, By End User, 2018 - 2030 (USD Billion)
Figure 25 Europe Sustainable Steel Market Size, by Region, 2018 - 2030 (USD Billion)
Figure 26 Asia-Pacific Sustainable Steel Market Highlight
Figure 27 Asia-Pacific Sustainable Steel Market Size, By Production Technology, 2018 - 2030 (USD Billion)
Figure 28 Asia-Pacific Sustainable Steel Market Size, By Energy Source, 2018 - 2030 (USD Billion)
Figure 29 Asia-Pacific Sustainable Steel Market Size, By End User, 2018 - 2030 (USD Billion)
Figure 30 Asia-Pacific Sustainable Steel Market Size, by Region, 2018 - 2030 (USD Billion)
Figure 31 RoW Sustainable Steel Market Highlight
Figure 32 RoW Sustainable Steel Market Size, By Production Technology, 2018 - 2030 (USD Billion)
Figure 33 RoW Sustainable Steel Market Size, By Energy Source, 2018 - 2030 (USD Billion)
Figure 34 RoW Sustainable Steel Market Size, By End User, 2018 - 2030 (USD Billion)
Figure 35 RoW Sustainable Steel Market Size, by Region, 2018 - 2030 (USD Billion)
Global Sustainable Steel Market Coverage
Production Technology Insight and Forecast 2025-2030
Energy Source Insight and Forecast 2025-2030
End User Insight and Forecast 2025-2030
Geographical Segmentation
Sustainable Steel Market by Region
North America
Europe
Asia-Pacific (APAC)
Rest of the World (RoW)
Vynz Research know in your business needs, you required specific answers pertaining to the market, Hence, our experts and analyst can provide you the customized research support on your specific needs.
After the purchase of current report, you can claim certain degree of free customization within the scope of the research.
Please let us know, how we can serve you better with your specific requirements to your research needs. Vynz research promises for quick reversal for your current business requirements.
Purchase Options
Latest Report
Research Methodology
Connect With Our Sales Team