| Status : Published | Published On : Jul, 2024 | Report Code : VRICT5184 | Industry : ICT & Media | Available Format :
|
Page : 203 |
The EdTech Smart Classroom Market is projected to grow from USD 146.4 billion in 2023 to USD 279.3 billion in 2030 at a CAGR of 15.7% during the forecast period from 2025 to 2030.

EdTech is a short form used for Educational Technology that is the use of technology to support learning and teaching processes. It covers a wide range of platforms, applications and digital tools that provide access to educational resources, assist educational activities and enable personalized and interactive learning experiences. The concept of smart classrooms is to create dynamic and engaging learning environments that shall leverage technology. Interactive displays, video conferencing tools, audio systems and collaboration software are the tools used for smart classrooms. With these technologies teachers can deliver content in a more interactive that shall foster student engagement. Students can actively participate in lessons, access digital resources that supplement their learning and collaborate with peers.
Market Segmentation
Insight by Deployment Mode
On the basis of deployment, the global EdTech Smart Classroom Market is bifurcated into Cloud-based and On-premise. Cloud-based deployment dominates the market due to its numerous advantages and benefits for educational institutions. Cloud-based solutions provide easy access to educational resources and tools at any time and from any location.
Insight by Component
Based on component, the global EdTech Smart Classroom Market is divided into (Hardware (Interactive Displays, Interactive Projectors, Others), Software (Learning Management Systems (LMS), Student Information Systems (SIS), Classroom Management Systems (CMS), and Others), and Services). The hardware segment dominate the market as it encompasses the physical devices and equipment that are used in smart classrooms, such as laptops, audio systems, interactive displays, projectors, tablets, cameras and networking infrastructure. These hardware components form the foundation of smart classrooms and are essential for creating a technology-enabled learning space.
Insight by End-User
On the basis of end-user, the global EdTech Smart Classroom Market is segregated into K-12, Higher Education and Corporate Training. The higher education sector dominates the market as there is an increase in demand for learning tools and advanced teaching. The growing emphasis on digital learning and online education is one of the major factors contributing to the higher education sector’s dominant market share. EdTech solutions and smart classrooms play a crucial role in facilitating online learning by providing interactive and engaging digital platforms for students and teachers. Furthermore, Universities and colleges are offering online courses and degree programs to cater to the rising demand for flexible education.
|
Report Metric |
Details |
|
Historical Period |
2020 - 2024 |
|
Base Year Considered |
2025 |
|
Forecast Period |
2026 - 2035 |
|
Market Size in 2025 |
U.S.D. 146.4 Billion |
|
Revenue Forecast in 2035 |
U.S.D. 279.3 Billion |
|
Growth Rate |
15.7% |
|
Segments Covered in the Report |
By Deployment Mode, By Component, By End-User |
|
Report Scope |
Market Trends, Drivers, and Restraints; Revenue Estimation and Forecast; Segmentation Analysis; Impact of COVID-19; Companies’ Strategic Developments; Market Share Analysis of Key Players; Company Profiling |
|
Regions Covered in the Report |
North America, Europe, Asia-Pacific, Latin America, Middle East And Africa |
Industry Dynamics
Growth Drivers
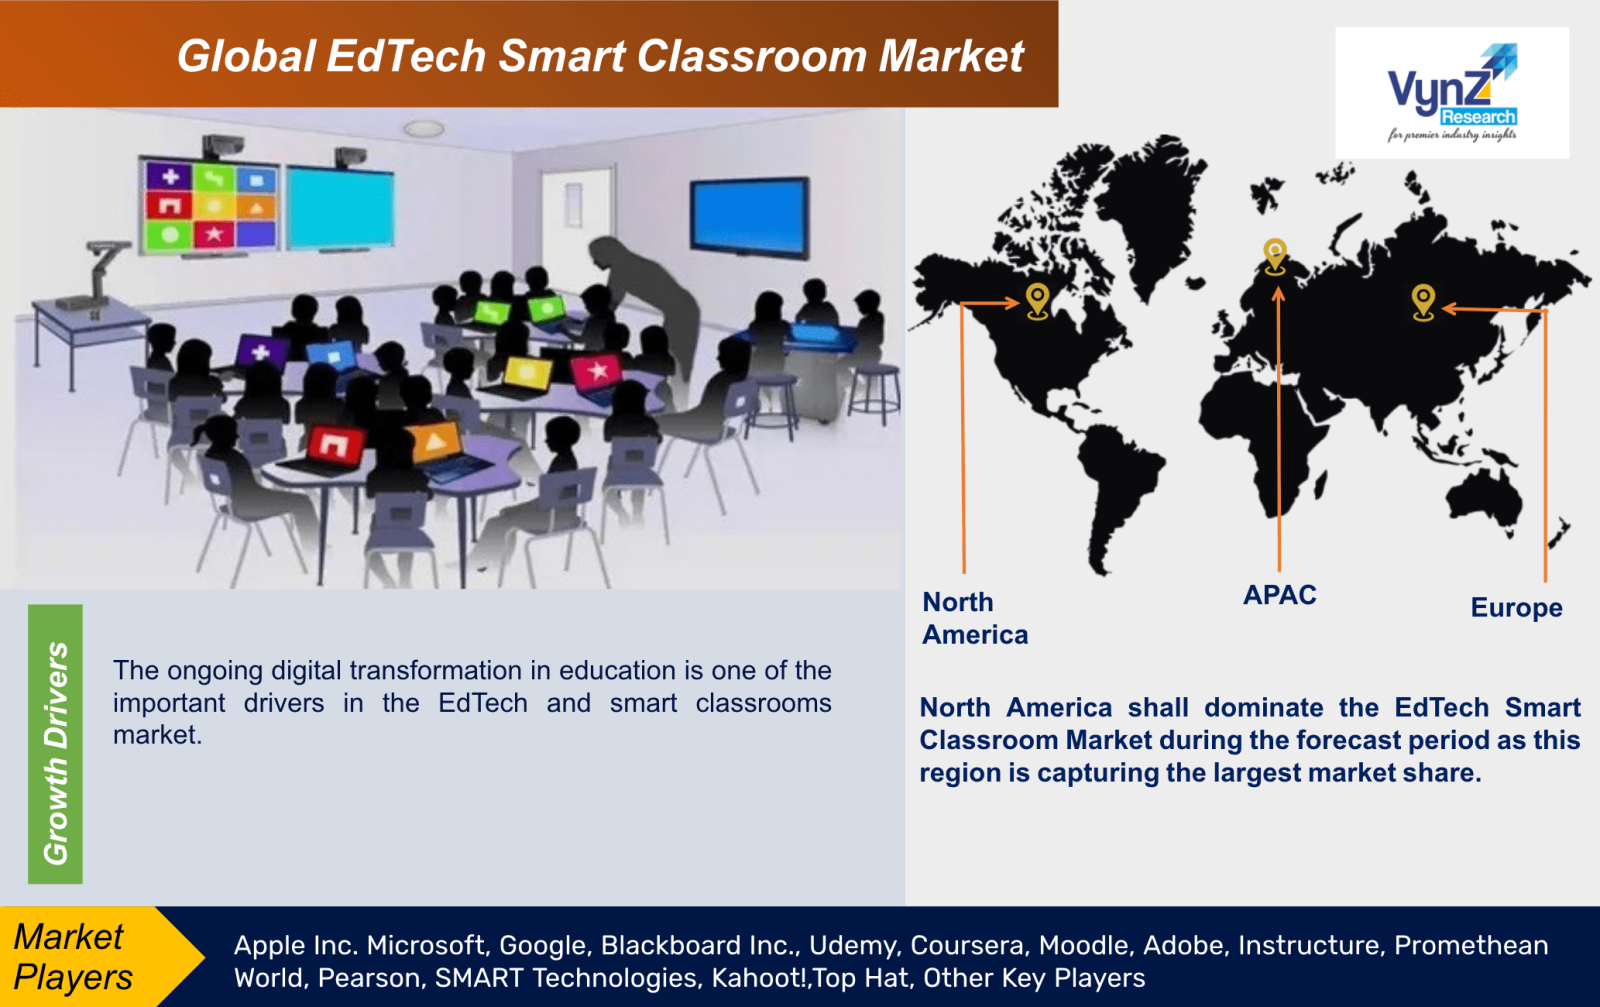
The ongoing digital transformation in education is one of the important drivers in the EdTech and smart classrooms market. The increasing recognition of the potential benefits of technology in enhancing teaching and learning experiences has led to a surge in the adoption of EdTech solutions. Digital transformation in education involves the integration of technology into various aspects of the education ecosystem, including curriculum development, instructional delivery, student assessment, and administrative processes. The desire to improve educational outcomes, prepare students for the digital age and increase accessibility has driven the market growth. The demand for remote and online education, need for personalized and adaptive learning and the growing availability of digital resources and tools are the factors responsible for this transformation in the market that is reshaping traditional educational practices and creating new opportunities for both learners and educators.
Restraints
The main constraint of Global EdTech Smart Classroom Market is privacy and data security concern. There is growing concern about the security and privacy of student and teacher data, as educational institutions rely on technology and data-driven solutions. EdTech solutions often gather and store sensitive personal information that includes student records, learning analytics and assessment data. The improper handling of this data can lead to identity theft, privacy breaches.
Continuous innovation and collaboration with educators and stakeholders are required to adapt to changing learning environments requires.
Geographic Overview
• North America
• Europe
• Asia Pacific (APAC)
• Latin America
• Middle East and Africa
North America shall dominate the EdTech Smart Classroom Market during the forecast period as this region is capturing the largest market share. Moreover, many key players in the EdTech industry based in North America add to the region’s capacity to drive technological advancements in smart classrooms. Robust infrastructure, a culture that is more receptive to adopting technological innovations in educational settings and investment in educational technology are the factors responsible for the growth of this market in this region.
Competitive Insights
To gain a fair share of the market, key players adopted different strategies such as partnership, product launch and product development. The market is expected to become more competitive during the forecast period, as many companies from various sectors planning to use the huge opportunities to enter the market.
Udemy, Inc. is an education technology company, that is founded in May 2010. It is based in San Francisco, California, United States, with hubs in Denver, Colorado, Melbourne, Australia, Dublin, Ireland Austin, Texas, Istanbul, Turkey, and Gurgaon, India. Udemy is an online learning and teaching marketplace with over 220000 courses and 70 million students. Learn programming, marketing, data science and more.
Coursera Inc. is an American global massive open online course provider. It was founded in 2012 by Stanford University. Coursera works with universities and other organizations to offer certifications, online courses and degrees in a variety of subjects.
Key Players Covered in the Report
Some of the key players in the EdTech Smart Classroom Market are Apple Inc. Microsoft, Google, Blackboard Inc., Udemy, Coursera, Moodle, Adobe, Instructure, Promethean World, Pearson, SMART Technologies, Kahoot!,Top Hat, Other Key Players
Recent developments by Key Players
Microsoft’s workhorse operating system stays in step with education’s needs, addressing equity, accessibility and security gaps. With a renewed focus on accessibility since the pandemic, K–12 institutions are looking for ways to give all students a path to a fair and equal level of education. Windows 11 tackles accessibility with its Learning Accelerators. These tools are numerous, including Immersive Reader, which helps students improve reading comprehension. Search Coach, which helps students learn how to form effective search queries. Live Caption, a FERPA-compliant tool that delivers real-time captions and subtitles displaying the spoken word as text on the device.
Segments Covered in the Report
Region Covered in the Report
.png)
Source: VynZ Research
.png)
Source: VynZ Research
1. Research Overview
1.1. The Report Offers
1.2. Market Coverage
1.2.1. By Deployment Mode
1.2.2. By Component
1.2.3. By End-User
1.2.4. By Region
1.3. Research Phases
1.4. Limitations
1.5. Market Methodology
1.5.1. Data Sources
1.5.1.1. Primary Research
1.5.1.2. Secondary Research
1.5.2. Methodology
1.5.2.1. Data Exploration
1.5.2.2. Forecast Parameters
1.5.2.3. Data Validation
1.5.2.4. Assumptions
1.5.3. Study Period & Data Reporting Unit
2. Executive Summary
3. Industry Overview
3.1. Industry Dynamics
3.1.1. Market Growth Drivers
3.1.2. Market Restraints
3.1.3. Key Market Trends
3.1.4. Major Opportunities
3.2. Industry Ecosystem
3.2.1. Porter’s Five Forces Analysis
3.2.2. Recent Development Analysis
3.2.3. Value Chain Analysis
3.3. Competitive Insight
3.3.1. Competitive Position of Industry Players
3.3.2. Market Attractive Analysis
3.3.3. Market Share Analysis
4. Global Market Estimate and Forecast
4.1. Global Market Overview
4.2. Global Market Estimate and Forecast to 2030
5. Market Segmentation Estimate and Forecast
5.1. By Deployment Mode
5.1.1. Cloud-based
5.1.1.1. Market Definition
5.1.1.2. Market Estimation and Forecast to 2030
5.1.2. On-premise
5.1.2.1. Market Definition
5.1.2.2. Market Estimation and Forecast to 2030
5.2. By Component
5.2.1. Hardware
5.2.1.1. Market Definition
5.2.1.2. Market Estimation and Forecast to 2030
5.2.2. Hardware
5.2.2.1. Market Definition
5.2.2.2. Market Estimation and Forecast to 2030
5.2.3. Classroom Management Systems
5.2.3.1. Market Definition
5.2.3.2. Market Estimation and Forecast to 2030
5.2.4. Services
5.2.4.1. Market Definition
5.2.4.2. Market Estimation and Forecast to 2030
5.3 By End-User
5.3.1. K12
5.3.1.1. Market Definition
5.3.1.2. Market Estimation and Forecast to 2030
5.3.2. Higher Education
5.3.2.1. Market Definition
5.3.2.2. Market Estimation and Forecast to 2030
5.3.3. Corporate Training
5.3.3.1. Market Definition
5.3.3.2. Market Estimation and Forecast to 2030
6. North America Market Estimate and Forecast
6.1. By Deployment Mode
6.2. By Component
6.3. By End-User
6.4.1. U.S. Market Estimate and Forecast
6.4.2. Canada Market Estimate and Forecast
6.4.3. Mexico Market Estimate and Forecast
7. Europe Market Estimate and Forecast
7.1. By Deployment Mode
7.2. By Component
7.3. By End-User
7.4.1. Germany Market Estimate and Forecast
7.4.2. France Market Estimate and Forecast
7.4.3. U.K. Market Estimate and Forecast
7.4.4. Italy Market Estimate and Forecast
7.4.5. Spain Market Estimate and Forecast
7.4.6. Rest of Europe Market Estimate and Forecast
8. Asia-Pacific Market Estimate and Forecast
8.1. By Deployment Mode
8.2. By Component
8.3. By End-User
8.4. By Country – China, Japan, India, South Korea, and Rest of Asia-Pacific
8.4.1. China Market Estimate and Forecast
8.4.2. Japan Market Estimate and Forecast
8.4.3. India Market Estimate and Forecast
8.4.4. South Korea Market Estimate and Forecast
8.4.5. Singapore Market Estimate and Forecast
8.4.6. Rest of Asia-Pacific Market Estimate and Forecast
9. Rest of the World (RoW) Market Estimate and Forecast
9.1. By Deployment Mode
9.2. By Component
9.3. By End-User
9.4. By Country – Brazil, Saudi Arabia, South Africa, U.A.E., and Other Countries
9.4.1. Brazil Market Estimate and Forecast
9.4.2. Saudi Arabia Market Estimate and Forecast
9.4.3. South Africa Market Estimate and Forecast
9.4.4. Other Countries Market Estimate and Forecast
10. Company Profiles
10.1. Apple Inc.
10.1.1. Snapshot
10.1.2. Overview
10.1.3. Offerings
10.1.4. Financial Insight
10.1.5. Recent Developments
10.2. Microsoft
10.2.1. Snapshot
10.2.2. Overview
10.2.3. Offerings
10.2.4. Financial Insight
10.2.5. Recent Developments
10.3. Google
10.3.1. Snapshot
10.3.2. Overview
10.3.3. Offerings
10.3.4. Financial Insight
10.3.5. Recent Developments
10.4. Blackboard Inc.
10.4.1. Snapshot
10.4.2. Overview
10.4.3. Offerings
10.4.4. Financial Insight
10.4.5. Recent Developments
10.5. Udemy
10.5.1. Snapshot
10.5.2. Overview
10.5.3. Offerings
10.5.4. Financial Insight
10.5.5. Recent Developments
10.6. Coursera
10.6.1. Snapshot
10.6.2. Overview
10.6.3. Offerings
10.6.4. Financial Insight
10.6.5. Recent Developments
10.7. Moodle
10.7.1. Snapshot
10.7.2. Overview
10.7.3. Offerings
10.7.4. Financial Insight
10.7.5. Recent Developments
10.8. Adobe
10.8.1. Snapshot
10.8.2. Overview
10.8.3. Offerings
10.8.4. Financial Insight
10.8.5. Recent Developments
10.9. Instructure
10.9.1. Snapshot
10.9.2. Overview
10.9.3. Offerings
10.9.4. Financial Insight
10.9.5. Recent Developments
10.10 Promethean World
10.10.1. Snapshot
10.10.2. Overview
10.10.3. Offerings
10.10.4. Financial Insight
10.10.5. Recent Developments
10.11. Pearson
10.11.1. Snapshot
10.11.2. Overview
10.11.3. Offerings
10.11.4. Financial Insight
10.11.5. Recent Developments
10.12. SMART Technologies
10.12.1. Snapshot
10.12.2. Overview
10.12.3. Offerings
10.12.4. Financial Insight
10.12.5. Recent Developments
10.13. Kahoot!
10.13.1. Snapshot
10.13.2. Overview
10.13.3. Offerings
10.13.4. Financial Insight
10.13.5. Recent Developments
10.14. BYJU’s
10.14.1. Snapshot
10.14.2. Overview
10.14.3. Offerings
10.14.4. Financial Insight
10.14.5. Recent Developments
10.15. Top Hat
10.15.1. Snapshot
10.15.2. Overview
10.15.3. Offerings
10.15.4. Financial Insight
10.15.5. Recent Developments
11. Appendix
11.1. Exchange Rates
11.2. Abbreviations
Note: Financial insight and recent developments of different companies are subject to the availability of information in the secondary domain.
List of Tables
Table 1 Deployment Mode
Table 2 Study Periods
Table 3 Data Reporting Unit
Table 4 Global EdTech Smart Classroom Market Size, by Deployment Mode, 2018-2023 (USD Billion)
Table 5 Global EdTech Smart Classroom Market Size, by Deployment Mode, 2025-2030 (USD Billion)
Table 6 Global EdTech Smart Classroom Market Size, by Component 2018-2023 (USD Billion)
Table 7 Global EdTech Smart Classroom Market Size, by Component 2025-2030 (USD Billion)
Table 8 Global EdTech Smart Classroom Market Size, by End-User, 2018-2023 (USD Billion)
Table 9 Global EdTech Smart Classroom Market Size, by End-User, 2025-2030 (USD Billion)
Table 10 Global EdTech Smart Classroom Market Size, by Region, 2018-2023 (USD Billion)
Table 11 Global EdTech Smart Classroom Market Size, by Region, 2025-2030 (USD Billion)
Table 12 North America EdTech Smart Classroom Market Size, by Deployment Mode, 2018-2023 (USD Billion)
Table 13 North America EdTech Smart Classroom Market Size, by Deployment Mode, 2025-2030 (USD Billion)
Table 14 North America EdTech Smart Classroom Market Size, by Component 2018-2023 (USD Billion)
Table 15 North America EdTech Smart Classroom Market Size, by Component 2025-2030 (USD Billion)
Table 16 North America EdTech Smart Classroom Market Size, by End-User, 2018-2023 (USD Billion)
Table 17 North America EdTech Smart Classroom Market Size, by End-User, 2025-2030 (USD Billion)
Table 18 North America EdTech Smart Classroom Market Size, by Country, 2018-2023 (USD Billion)
Table 19 North America EdTech Smart Classroom Market Size, by Country, 2025-2030 (USD Billion)
Table 20 Europe EdTech Smart Classroom Market Size, by Deployment Mode, 2018-2023 (USD Billion)
Table 21 Europe EdTech Smart Classroom Market Size, by Deployment Mode, 2025-2030 (USD Billion)
Table 22 Europe EdTech Smart Classroom Market Size, by Component 2018-2023 (USD Billion)
Table 23 Europe EdTech Smart Classroom Market Size, by Component 2025-2030 (USD Billion)
Table 24 Europe EdTech Smart Classroom Market Size, by End-User, 2018-2023 (USD Billion)
Table 25 Europe EdTech Smart Classroom Market Size, by End-User, 2025-2030 (USD Billion)
Table 26 Europe EdTech Smart Classroom Market Size, by Country, 2018-2023 (USD Billion)
Table 27 Europe EdTech Smart Classroom Market Size, by Country, 2025-2030 (USD Billion)
Table 28 Asia-Pacific EdTech Smart Classroom Market Size, by Deployment Mode, 2018-2023 (USD Billion)
Table 29 Asia-Pacific EdTech Smart Classroom Market Size, by Deployment Mode, 2025-2030 (USD Billion)
Table 30 Asia-Pacific EdTech Smart Classroom Market Size, by Component 2018-2023 (USD Billion)
Table 31 Asia-Pacific EdTech Smart Classroom Market Size, by Component 2025-2030 (USD Billion)
Table 32 Asia-Pacific EdTech Smart Classroom Market Size, by End-User, 2018-2023 (USD Billion)
Table 33 Asia-Pacific EdTech Smart Classroom Market Size, by End-User, 2025-2030 (USD Billion)
Table 34 Asia-Pacific EdTech Smart Classroom Market Size, by Country, 2018-2023 (USD Billion)
Table 35 Asia-Pacific EdTech Smart Classroom Market Size, by Country, 2025-2030 (USD Billion)
Table 36 RoW EdTech Smart Classroom Market Size, by Deployment Mode, 2018-2023 (USD Billion)
Table 37 RoW EdTech Smart Classroom Market Size, by Deployment Mode, 2025-2030 (USD Billion)
Table 38 RoW EdTech Smart Classroom Market Size, by Component 2018-2023 (USD Billion)
Table 39 RoW EdTech Smart Classroom Market Size, by Component 2025-2030 (USD Billion)
Table 40 RoW EdTech Smart Classroom Market Size, by End-User, 2018-2023 (USD Billion)
Table 41 RoW EdTech Smart Classroom Market Size, by End-User, 2025-2030 (USD Billion)
Table 42 RoW EdTech Smart Classroom Market Size, by Country, 2018-2023 (USD Billion)
Table 43 RoW EdTech Smart Classroom Market Size, by Country, 2025-2030 (USD Billion)
Table 44 Snapshot – Apple Inc.
Table 45 Snapshot – Microsoft
Table 46 Snapshot – Google
Table 47 Snapshot – Blackboard Inc.
Table 48 Snapshot – Udemy
Table 49 Snapshot – Coursera
Table 50 Snapshot – Moodle
Table 51 Snapshot – Adobe
Table 52 Snapshot – Instructure
Table 53 Snapshot – Promethean World
Table 54 Snapshot – Pearson
Table 55 Snapshot – SMART Technologies
Table 56 Snapshot – Kahoot!
Table 57 Snapshot – Zipline International Inc.
Table 58 Snapshot – Top Hat
Table 59 Snapshot – Others
List of Figures
Figure 1 Market Coverage
Figure 2 Research Phases
Figure 3 Secondary Deployment Modes for Different Parameters
Figure 4 Methodology
Figure 5 Data Mining & Exploration
Figure 6 Data Triangulation
Figure 7 Assumptions for Market Estimation and Forecast
Figure 8 Market Synopsis
Figure 9 Global EdTech Smart Classroom Market- Growth Drivers and Restraints
Figure 10 Competitive Benchmark
Figure 11 Global EdTech Smart Classroom Market Highlight
Figure 12 Global EdTech Smart Classroom Market Size, by Deployment Mode, 2018 – 2030 (USD Billion)
Figure 13 Global EdTech Smart Classroom Market Size, by Component 2018 – 2030 (USD Billion)
Figure 14 Global EdTech Smart Classroom Market Size, by End-User 2018 – 2030 (USD Billion)
Figure 15 Global EdTech Smart Classroom Market Size, by Region, 2018 – 2030 (USD Billion)
Figure 16 North America EdTech Smart Classroom Market Highlight
Figure 17 North America EdTech Smart Classroom Market Size, by Deployment Mode, 2018 – 2030 (USD Billion)
Figure 18 North America EdTech Smart Classroom Market Size, by Component 2018–2030 (USD Billion)
Figure 19 North America EdTech Smart Classroom Market Size, by End-User 2018–2030 (USD Billion)
Figure 20 North America EdTech Smart Classroom Market Size, by Country, 2018 – 2030 (USD Billion)
Figure 21 Europe EdTech Smart Classroom Market Highlight
Figure 22 Europe EdTech Smart Classroom Market Size, by Deployment Mode, 2018 – 2030 (USD Billion)
Figure 23 Europe EdTech Smart Classroom Market Size, by Component 2018 – 2030 (USD Billion)
Figure 24 Europe EdTech Smart Classroom Market Size, by End-User 2018 – 2030 (USD Billion)
Figure 25 Europe EdTech Smart Classroom Market Size, by Country, 2018 – 2030 (USD Billion)
Figure 26 Asia-Pacific EdTech Smart Classroom Market Highlight
Figure 27 Asia-Pacific EdTech Smart Classroom Market Size, by Deployment Mode, 2018 – 2030 (USD Billion)
Figure 28 Asia-Pacific EdTech Smart Classroom Market Size, by Component 2018 – 2030 (USD Billion)
Figure 29 Asia-Pacific EdTech Smart Classroom Market Size, by End-User 2018 – 2030 (USD Billion)
Figure 30 Asia-Pacific EdTech Smart Classroom Market Size, by Country, 2018 – 2030 (USD Billion)
Figure 31 Row EdTech Smart Classroom Market Highlight
Figure 32 Row EdTech Smart Classroom Market Size, by Deployment Mode, 2018 – 2030 (USD Billion)
Figure 33 Row EdTech Smart Classroom Market Size, by Component 2018 – 2030 (USD Billion)
Figure 34 Row EdTech Smart Classroom Market Size, by End-User 2018 – 2030 (USD Billion)
Figure 35 Row EdTech Smart Classroom Market Size, by Country, 2018 – 2030 (USD Billion)
EdTech Smart Classroom Market Coverage
By Deployment Mode Insight and Forecast 2023-2030
By Component Insight and Forecast 2023-2030
By End-User Insight and Forecast 2023-2030
Global EdTech Smart Classroom Market by Region
North America
Europe
Asia-Pacific (APAC)
Rest of the World (RoW)
Vynz Research know in your business needs, you required specific answers pertaining to the market, Hence, our experts and analyst can provide you the customized research support on your specific needs.
After the purchase of current report, you can claim certain degree of free customization within the scope of the research.
Please let us know, how we can serve you better with your specific requirements to your research needs. Vynz research promises for quick reversal for your current business requirements.
Purchase Options
Latest Report
Research Methodology
Connect With Our Sales Team
EdTech Smart Classroom Market