| Status : Published | Published On : Jan, 2024 | Report Code : VRSME9048 | Industry : Semiconductor & Electronics | Available Format :
|
Page : 165 |
The Global Linear Motor Market is projected to witness significant growth in the coming years. According to estimates, the market size reached USD 1.4 billion in 2023 and is anticipated to reach USD 2.8 billion by 2030, reflecting a compound annual growth rate (CAGR) of 4.8%. Linear motors are electric motors designed with an unrolled stator and rotor configuration, generating linear force instead of rotational torque. It's important to note that linear motors can have non-linear shapes. Essentially, these motors are advanced synchronous brushless motors that operate similarly to torque motors, but with a flattened and extended structure.

The semiconductor industry's increasing demand for quality inspection and automation, as well as reduced time-to-market and growing demand for miniaturisation of electronic devices, are a few major driving factors propelling the market growth.
• Automotive
• Electronics
• Machine tools
• Medical & Pharmaceuticals
• Packaging/Labelling
• Robotics
• Mobile off highways
• Agricultural and construction
• Petrochemical
• Printing
• Paper
• Textile
• Woodworking
In the linear motion market, the automotive industry is one of the fastest-growing. In terms of manufacturing and manufacturing technology, this industry has seen rapid advancements. To produce a better, cheaper product in less time, automotive manufacturers are upgrading systems, adding inspection and networking capabilities, and leveraging integration. Linear rail guides, linear motors, controllers, and linear actuators are in high demand around the world because they help improve the efficiency of production and manufacturing facilities in the automotive industry.
• North America
• Europe
• APAC
• Latin America
• MEA
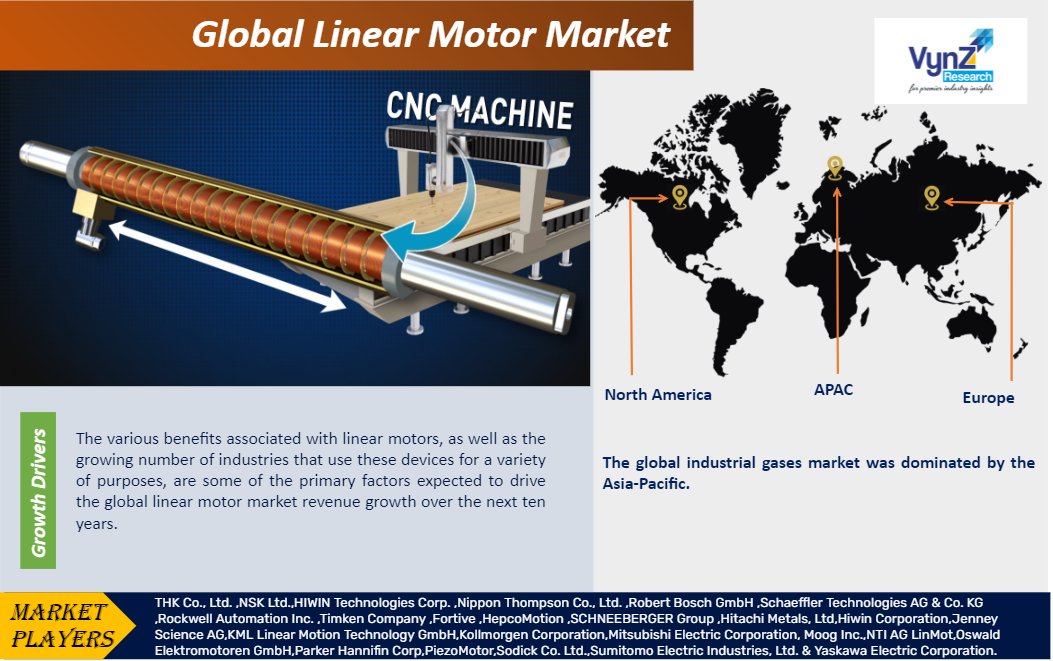
During the forecast period, APAC is expected to continue to hold the largest share of the overall linear motion market in terms of value. APAC's emerging economies, such as China and India, are experiencing rapid changes in the adoption of new technologies and manufacturing advancements. In addition, the government has launched a number of large-scale initiatives to improve IT infrastructure. As a result of these factors, APAC has the highest growth rate in the linear motion market. In almost every business sector, the region is highly focused on adopting new technologies, and it is more interested in technologically innovative, cost-effective solutions. In APAC, Japan has one of the highest rates of linear motion product adoption.
|
Report Metric |
Details |
|
Historical Period |
2020 - 2024 |
|
Base Year Considered |
2025 |
|
Forecast Period |
2026 - 2035 |
|
Market Size in 2025 |
U.S.D. 1.4 Billion |
|
Revenue Forecast in 2035 |
U.S.D. 2.8 Billion |
|
Growth Rate |
4.8% |
|
Segments Covered in the Report |
By Application |
|
Report Scope |
Market Trends, Drivers, and Restraints; Revenue Estimation and Forecast; Segmentation Analysis; Impact of COVID-19; Companies’ Strategic Developments; Market Share Analysis of Key Players; Company Profiling |
|
Regions Covered in the Report |
North America, Europe, Asia-Pacific, Middle East, and Rest of the World |
Motor manufacturers all over the world are focused on new technologies, and as a result, they are engaging in a variety of activities.
The ball screw and inherent reliability of direct drive linear motors are controlled by a new direct drive–Green Drive actuator (combination of speed and rugged operation) designed by Servo Components and Systems Ltd. The Green Drive actuator has a speed of up to 5m/s and a positional accuracy of 50 microns, making it suitable for a wide range of industrial applications and propelling the linear motor industry forward.
As a result, the demand for linear motors in a variety of industrial applications can be attributed to technological advancements in direct drives, which are fueling the linear motor market's growth.
The various benefits associated with linear motors, as well as the growing number of industries that use these devices for a variety of purposes, are some of the primary factors expected to drive the global linear motor market revenue growth over the next ten years. Furthermore, linear motors are frequently used in conjunction with servo controls, allowing for easy coordination and cost-effectiveness even in the most complex of configurations. Additionally, their compact design, high accuracy, and low maintenance costs are expected to contribute to the global linear motor industry's continued growth in the coming years.
Linear motion components are used in the machining tools industry to automate processes such as cutting, boring, grinding, shearing, and other types of metal deformation in order to provide a high-reliability and low-maintenance solution. Linear motion components like linear guides, ball screws, linear actuators, linear motors, and so on are designed to maximise the efficiency of equipment that performs repetitive tasks. As a result, there is a strong demand for linear motion's precision and path-following capabilities to provide consistent results with greater versatility than other dedicated cutting machines.
Furthermore, linear motors do not rely on mechanical parts like pulleys, belts, pinions, etc., which are commonly found in traditional systems, and do not need elastic components like couplings, gearboxes, etc., minimising the likelihood of motion errors and backlash. The potential for additional business growth is projected to skyrocket over the next ten years as a result of the aforementioned factors.
The high cost and complicated construction of the electromagnets used in linear motors is one of the major issues with them. To raise and transfer one magnet over the other, more powerful electromagnets are needed, which consume a lot of electric power. To overcome this problem, linear motors use superconducting magnets.
COVID-19 Impact on the Global Linear Motor Markets
Due to enforced lockdowns and placed restrictions by respective regulatory bodies in the wake of the recent COVID-19 outbreak, various industries' activities have either been temporarily suspended or are operating with a reduced workforce. This is no different in the global linear motor market, and this factor is expected to have a negative effect on the industry's revenue growth. Furthermore, the relatively high set-up costs associated with the installation and implementation of linear motors in respective industries may limit the global linear motor market's revenue growth in the coming years.
Some of the key players in the global linear motor market are:
• THK Co., Ltd.
• NSK Ltd.
• HIWIN Technologies Corp.
• Nippon Thompson Co., Ltd.
• Robert Bosch GmbH
• Schaeffler Technologies AG & Co. KG
• Rockwell Automation Inc.
• Timken Company
• Fortive
• HepcoMotion
• SCHNEEBERGER Group
• Hitachi Metals, Ltd
• Hiwin Corporation
• Jenney Science AG
• KML Linear Motion Technology GmbH
• Kollmorgen Corporation
• Mitsubishi Electric Corporation, Moog Inc.
• NTI AG LinMot
• Oswald Elektromotoren GmbH
• Parker Hannifin Corp
• PiezoMotor
• Sodick Co. Ltd.
• Sumitomo Electric Industries, Ltd.
• Yaskawa Electric Corporation
THK India Pvt Ltd which is a distinguished producer of linear motion guides and subsidiary of THK Co Ltd, Japan, has broken ground for an additional plant in Sri City. THK India’s new facility is expected to be operational soon with an investment of Rs 300 crore. This expansion aligns with the company’s strategic response to meet the growing demand for our linear motion guides.
Sodick Co. Ltd. (Japanese manufacturing equipment supplier) has acquired a minority share of 9.5% of Prima Additive. The agreement will allow the development of a business alliance between the two companies that aims the growth of Prima Additive's metal additive manufacturing technology portfolio.
The Linear Motor Market report offers a comprehensive market segmentation analysis along with an estimation for the forecast period 2025–2030.
Segments Covered in the Report
Region Covered in the Report
.png)
Source: VynZ Research
.png)
Source: VynZ Research
1. Research Overview
1.1. The Report Offers
1.2. Market Coverage
1.2.1. By Application
1.3. Research Phases
1.4. Limitations
1.5. Research Methodology
1.5.1. Data Sources
1.5.1.1. Primary Research
1.5.1.2. Secondary Research
1.5.2. Methodology
1.5.2.1. Data Exploration
1.5.2.2. Forecast Parameters
1.5.2.3. Data Validation
1.5.2.4. Assumptions
1.5.3. Study Period & Data Reporting Unit
2. Executive Summary
3. Industry Overview
3.1. Industry Dynamics
3.1.1. Market Growth Drivers
3.1.2. Market Restraints
3.1.3. Key Market Trends
3.1.4. Major Opportunities
3.2. Industry Ecosystem
3.2.1. Porter’s Five Forces Analysis
3.2.2. Recent Development Analysis
3.2.3. Value Chain Analysis
3.3. Competitive Insight
3.3.1. Competitive Position of Industry Players
3.3.2. Market Attractive Analysis
4. Global Market Estimate and Forecast
4.1. Global Market Overview
4.2. Global Market Estimate and Forecast to 2030
5. Market Segmentation Estimate and Forecast
5.1. By Application
5.1.1. Automotive
5.1.1.1. Market Definition
5.1.1.2. Market Estimation and Forecast to 2030
5.1.2. Electronics
5.1.2.1. Market Definition
5.1.2.2. Market Estimation and Forecast to 2030
5.1.3. Machine Tools
5.1.3.1. Market Definition
5.1.3.2. Market Estimation and Forecast to 2030
5.1.4. Medical & Pharmaceuticals
5.1.4.1. Market Definition
5.1.4.2. Market Estimation and Forecast to 2030
5.1.5. Packaging/Labelling
5.1.5.1. Market Definition
5.1.5.2. Market Estimation and Forecast to 2030
5.1.6. Robotics
5.1.6.1. Market Definition
5.1.6.2. Market Estimation and Forecast to 2030
5.1.7. Mobile off highways
5.1.7.1. Market Definition
5.1.7.2. Market Estimation and Forecast to 2030
5.1.8. Agricultural and constructions
5.1.8.1. Market Definition
5.1.8.2. Market Estimation and Forecast to 2030
5.1.9. Petrochemicals
5.1.9.1. Market Definition
5.1.9.2. Market Estimation and Forecast to 2030
5.1.10. Printing
5.1.10.1. Market Definition
5.1.10.2. Market Estimation and Forecast to 2030
5.1.11. Paper
5.1.11.1. Market Definition
5.1.11.2. Market Estimation and Forecast to 2030
5.1.12. Textile
5.1.12.1. Market Definition
5.1.12.2. Market Estimation and Forecast to 2030
5.1.13. Wood Working
5.1.13.1. Market Definition
5.1.13.2. Market Estimation and Forecast to 2030
6. North America Market Estimate and Forecast
6.1. By Application
6.2. By Country
6.2.1. U.S. Market Estimate and Forecast
6.2.2. Canada Market Estimate and Forecast
6.2.3. Mexico Market Estimate and Forecast
7. Europe Market Estimate and Forecast
7.1. By Application
7.2. By Country
7.2.1. Germany Market Estimate and Forecast
7.2.2. France Market Estimate and Forecast
7.2.3. U.K. Market Estimate and Forecast
7.2.4. Italy Market Estimate and Forecast
7.2.5. Spain Market Estimate and Forecast
7.2.6. Russia Market Estimate and Forecast
7.2.7. Rest of Europe Market Estimate and Forecast
8. Asia-Pacific Market Estimate and Forecast
8.1. By Application
8.2. By Country
8.2.1. China Market Estimate and Forecast
8.2.2. Japan Market Estimate and Forecast
8.2.3. India Market Estimate and Forecast
8.2.4. South Korea Market Estimate and Forecast
8.2.5. Rest of Asia-Pacific Market Estimate and Forecast
9. Rest of the World (RoW) Market Estimate and Forecast
9.1. By Application
9.2. By Country
9.2.1. Brazil Market Estimate and Forecast
9.2.2. Saudi Arabia Market Estimate and Forecast
9.2.3. South Africa Market Estimate and Forecast
9.2.4. U.A.E. Market Estimate and Forecast
9.2.5. Other Countries Market Estimate and Forecast
10. Company Profiles
10.1. THK Co., Ltd.
10.1.1. Snapshot
10.1.2. Overview
10.1.3. Offerings
10.1.4. Financial Insight
10.1.5. Recent Developments
10.2. NSK Ltd.
10.2.1. Snapshot
10.2.2. Overview
10.2.3. Offerings
10.2.4. Financial Insight
10.2.5. Recent Developments
10.3. HIWIN Technologies Corp.
10.3.1. Snapshot
10.3.2. Overview
10.3.3. Offerings
10.3.4. Financial Insight
10.3.5. Recent Developments
10.4. Nippon Thompson Co., Ltd.
10.4.1. Snapshot
10.4.2. Overview
10.4.3. Offerings
10.4.4. Financial Insight
10.4.5. Recent Developments
10.5. Robert Bosch GmbH
10.5.1. Snapshot
10.5.2. Overview
10.5.3. Offerings
10.5.4. Financial Insight
10.5.5. Recent Developments
10.6. Schaeffler Technologies AG & Co. KG
10.6.1. Snapshot
10.6.2. Overview
10.6.3. Offerings
10.6.4. Financial Insight
10.6.5. Recent Developments
10.7. Rockwell Automation Inc.
10.7.1. Snapshot
10.7.2. Overview
10.7.3. Offerings
10.7.4. Financial Insight
10.7.5. Recent Developments
10.8. Timken Company
10.8.1. Snapshot
10.8.2. Overview
10.8.3. Offerings
10.8.4. Financial Insight
10.8.5. Recent Developments
10.9. Fortive
10.9.1. Snapshot
10.9.2. Overview
10.9.3. Offerings
10.9.4. Financial Insight
10.9.5. Recent Developments
10.10. HepcoMotion
10.10.1. Snapshot
10.10.2. Overview
10.10.3. Offerings
10.10.4. Financial Insight
10.10.5. Recent Developments
10.11. SCHNEEBERGER Group
10.11.1. Snapshot
10.11.2. Overview
10.11.3. Offerings
10.11.4. Financial Insight
10.11.5. Recent Developments
10.12. Hitachi Metals, Ltd
10.12.1. Snapshot
10.12.2. Overview
10.12.3. Offerings
10.12.4. Financial Insight
10.12.5. Recent Developments
10.13. Hiwin Corporation
10.13.1. Snapshot
10.13.2. Overview
10.13.3. Offerings
10.13.4. Financial Insight
10.13.5. Recent Developments
10.14. Jenney Science AG
10.14.1. Snapshot
10.14.2. Overview
10.14.3. Offerings
10.14.4. Financial Insight
10.14.5. Recent Developments
10.15. KML Linear Motion Technology GmbH
10.15.1. Snapshot
10.15.2. Overview
10.15.3. Offerings
10.15.4. Financial Insight
10.15.5. Recent Developments
10.16. Kollmorgen Corporation
10.16.1. Snapshot
10.16.2. Overview
10.16.3. Offerings
10.16.4. Financial Insight
10.16.5. Recent Developments
10.17. Mitsubishi Electric Corporation, Moog Inc.
10.17.1. Snapshot
10.17.2. Overview
10.17.3. Offerings
10.17.4. Financial Insight
10.17.5. Recent Developments
10.18. NTI AG LinMot
10.18.1. Snapshot
10.18.2. Overview
10.18.3. Offerings
10.18.4. Financial Insight
10.18.5. Recent Developments
10.19. Oswald Elektromotoren GmbH
10.19.1. Snapshot
10.19.2. Overview
10.19.3. Offerings
10.19.4. Financial Insight
10.19.5. Recent Developments
10.20. Parker Hannifin Corp
10.20.1. Snapshot
10.20.2. Overview
10.20.3. Offerings
10.20.4. Financial Insight
10.20.5. Recent Developments
10.21. PiezoMotor
10.21.1. Snapshot
10.21.2. Overview
10.21.3. Offerings
10.21.4. Financial Insight
10.21.5. Recent Developments
10.22. Sodick Co. Ltd.
10.22.1. Snapshot
10.22.2. Overview
10.22.3. Offerings
10.22.4. Financial Insight
10.22.5. Recent Developments
10.22. Sumitomo Electric Industries, Ltd.
10.22.1. Snapshot
10.22.2. Overview
10.22.3. Offerings
10.22.4. Financial Insight
10.22.5. Recent Developments
10.22. Yaskawa Electric Corporation
10.22.1. Snapshot
10.22.2. Overview
10.22.3. Offerings
10.22.4. Financial Insight
10.22.5. Recent Developments
11. Appendix
11.1. Exchange Rates
11.2. Abbreviations
List of Tables
Table 1 Sources
Table 2 Study Periods
Table 3 Data Reporting Unit
Table 4 Global Linear Motor Market Size, By Application Type, 2018– 2023 (USD Billion)
Table 5 Global Linear Motor Market Size, By Application Type, 2025– 2030 (USD Billion)
Table 6 Global Linear Motor Market Size, by Region,2018– 2023 (USD Billion)
Table 7 Global Linear Motor Market Size, by Region, 2025– 2030 (USD Billion)
Table 8 North America Linear Motor Market Size, By Application Type,2018– 2023 (USD Billion)
Table 9 North America Linear Motor Market Size, By Application Type, 2025– 2030 (USD Billion)
Table 10 North America Linear Motor Market Size, by Region,2018– 2023 (USD Billion)
Table 11 North America Linear Motor Market Size, by Region, 2025– 2030 (USD Billion)
Table 12 Europe Linear Motor Market Size, By Application Type,2018– 2023 (USD Billion)
Table 13 Europe Linear Motor Market Size, By Application Type, 2025– 2030 (USD Billion)
Table 14 Europe Linear Motor Market Size, by Region,2018– 2023 (USD Billion)
Table 15 Europe Linear Motor Market Size, by Region, 2025– 2030 (USD Billion)
Table 16 Asia-Pacific Linear Motor Market Size, By Application Type,2018– 2023 (USD Billion)
Table 17 Asia-Pacific Linear Motor Market Size, By Application Type, 2025– 2030 (USD Billion)
Table 18 Asia-Pacific Linear Motor Market Size, by Region,2018– 2023 (USD Billion)
Table 19 Asia-Pacific Linear Motor Market Size, by Region, 2025– 2030 (USD Billion)
Table 20 RoW Linear Motor Market Size, By Application Type,2018– 2023 (USD Billion)
Table 21 RoW Linear Motor Market Size, By Application Type, 2025– 2030 (USD Billion)
Table 22 RoW Linear Motor Market Size, by Region,2018– 2023 (USD Billion)
Table 23 RoW Linear Motor Market Size, by Region, 2025– 2030 (USD Billion)
Table 24 Snapshot – THK Co., Ltd.
Table 25 Snapshot – NSK Ltd.
Table 26 Snapshot – HIWIN Technologies Corp.
Table 27 Snapshot – Nippon Thompson Co., Ltd.
Table 28 Snapshot – Robert Bosch GmbH
Table 29 Snapshot – Schaeffler Technologies AG & Co. KG
Table 30 Snapshot – Rockwell Automation Inc.
Table 31 Snapshot – Timken Company
Table 32 Snapshot – Fortive
Table 33 Snapshot – HepcoMotion
Table 34 Snapshot – SCHNEEBERGER Group
Table 35 Snapshot – Hitachi Metals, Ltd
Table 36 Snapshot – Hiwin Corporation
Table 37 Snapshot – Jenney Science AG
Table 38 Snapshot – KML Linear Motion Technology GmbH
Table 39 Snapshot – Kollmorgen Corporation
Table 40 Snapshot – Mitsubishi Electric Corporation, Moog Inc.
Table 41 Snapshot – NTI AG LinMot
Table 42 Snapshot – Oswald Elektromotoren GmbHIvl5
Table 43 Snapshot – Parker Hannifin Corp
Table 44 Snapshot – PiezoMotor
Table 45 Snapshot – Sodick Co. Ltd.
Table 46 Snapshot – Sumitomo Electric Industries, Ltd.
Table 47 Snapshot – Yaskawa Electric Corporation
List of Figures
Figure 1 Market Coverage
Figure 2 Research Phases
Figure 3 Secondary Sources for Different Parameters
Figure 4 Methodology
Figure 5 Data Mining & Exploration
Figure 6 Data Triangulation
Figure 7 Assumptions for Market Estimation and Forecast
Figure 8 Market Synopsis
Figure 9 Global Linear Motor Market - Growth Drivers and Restraints
Figure 10 Competitive Benchmark
Figure 11 Global Linear Motor Market Highlight
Figure 12 Global Linear Motor Market Size, By Application Type, 2018– 2030 (USD Billion)
Figure 13 Global Linear Motor Market Size, by Region, 2018– 2030 (USD Billion)
Figure 14 North America Linear Motor Market Highlight
Figure 15 North America Linear Motor Market Size, By Application Type, 2018– 2030 (USD Billion)
Figure 16 North America Linear Motor Market Size, by Region, 2018– 2030 (USD Billion)
Figure 17 Europe Linear Motor Market Highlight
Figure 18 Europe Linear Motor Market Size, By Application Type, 2018– 2030 (USD Billion)
Figure 19 Europe Linear Motor Market Size, by Region, 2018– 2030 (USD Billion)
Figure 20 Asia-Pacific Linear Motor Market Highlight
Figure 21 Asia-Pacific Linear Motor Market Size, By Application Type, 2018– 2030 (USD Billion)
Figure 22 Asia-Pacific Linear Motor Market Size, by Region, 2018– 2030 (USD Billion)
Figure 23 RoW Linear Motor Market Highlight
Figure 24 RoW Linear Motor Market Size, By Application Type, 2018– 2030 (USD Billion)
Figure 25 RoW Linear Motor Market Size, by Region, 2018– 2030 (USD Billion)
Global Linear Motor Market Coverage
Application Insight and Forecast 2025-2030
Geographical Segmentation
Global Linear Motor Market by Region
North America
Europe
Asia-Pacific (APAC)
Rest of the World (RoW)
Vynz Research know in your business needs, you required specific answers pertaining to the market, Hence, our experts and analyst can provide you the customized research support on your specific needs.
After the purchase of current report, you can claim certain degree of free customization within the scope of the research.
Please let us know, how we can serve you better with your specific requirements to your research needs. Vynz research promises for quick reversal for your current business requirements.
Purchase Options
Latest Report
Research Methodology
Connect With Our Sales Team