TIC Market for Electronics and Electrical Products Industry Overview
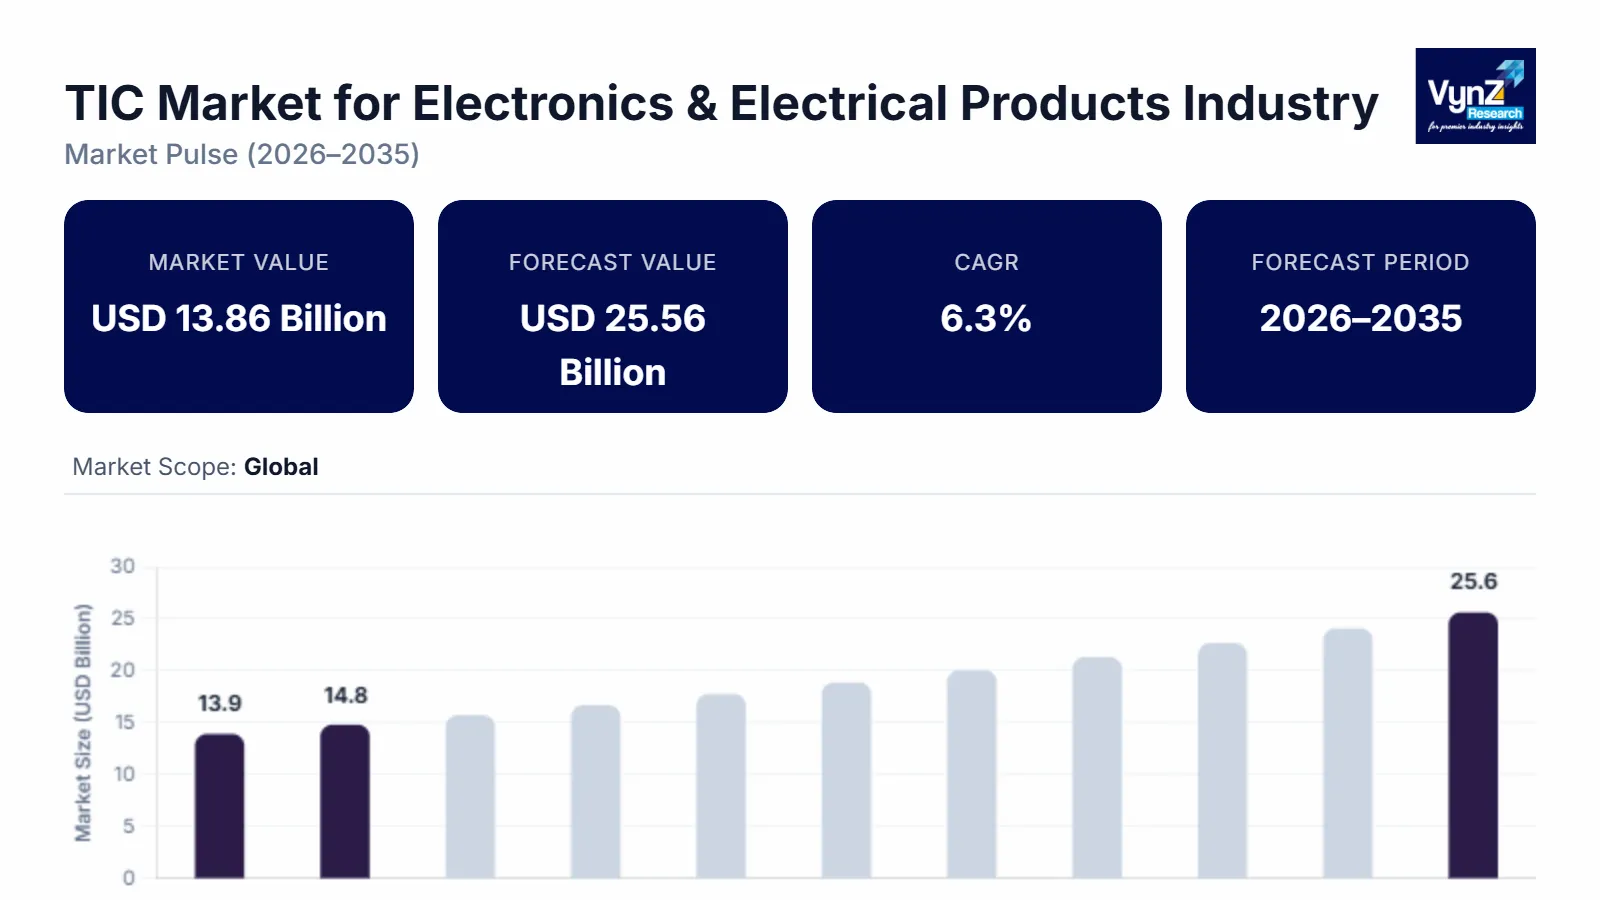
The Electronics & Electrical Products Testing, Inspection, and Certification Market Which was valued at approximately USD 13.86 billion in 2025 and is estimated to reach around USD 14.75 billion in 2026, is projected to reach close to USD 25.56 billion by 2035, expanding at a CAGR of about 6.3% during the forecast period from 2026 to 2035.
TIC market for electronics and electrical products is witnessing growth owing to the adoption of advanced technologies in the electronics and electrical sector and offering new services and solutions like virtual inspections, visual inspections, and remote auditing. Moreover globalization, rapid urbanization, and rising brand protection, regulatory compliance have propelled the growth of the TIC market for electronics & electrical products. Furthermore, owing to the integration of electronics infrastructure, there is an increasing demand for automotive testing, standards, and regulations to reduce greenhouse emissions from vehicles, rising energy conservation movement in the automotive sector. Also, the growing need for comfort and safety has led to innovations and R&D efforts from OEM and automotive dealers to test electronics parts and comply with regulations, resulting in the growth of the TIC market for electronics & electrical products. Thus, mounting demand for household appliance testing and the increasing need for equipment validation will drive the growth of the TIC market for electronics and electrical products.
TIC Market for Electronics & Electrical Products Industry Dynamics
Market Trends
The need for compliance testing and certification is rising as a result of the rapid innovation in semiconductors, smart appliances, EV components, and IoT devices. Globally, digital inspection technologies, risk-based certification frameworks, and third-party verification are being accelerated by supply chain complexity, cross-border trade, and sustainability standards. As safety, electromagnetic compatibility (EMC), energy efficiency, and cybersecurity rules become more stringent, the TIC market for the Electronics & Electrical Products sector is changing.
Growth Drivers
Electronics and electrical products are at the center of some of the most rigorously regulated trade routes in worldwide manufacturing, and compliance requirements often change. Standards that ensure the safety of electrical insulation, electromagnetic compatibility, energy efficiency, and product labeling are being updated in almost all the big markets. Manufacturers are now required to have their products tested and certified by third parties not only at the point of market entry but also throughout the entire product lifecycles. It is estimated that around 38–40% of the total demand of the sector is compliance-driven TIC activities, with the number of services gradually increasing at a rate of about 6.8% per year.
Increasing product complexity is one of the factors that the testing industry has delved deeper before the product launch. Consumer electronics, industrial electrical equipment, and smart devices consist of several components, software layers, and connectivity features, all of which are subjected to different regulatory checks. Now, functional safety testing, EMC validation, and reliability testing have become commonplace in all product categories. The demand for TIC services related to sophisticated electronics and integrated electrical systems is growing at a much faster rate than that of the traditional segments, reaching almost 8% as smart and connected devices get more popular.
The introduction of shorter product lifecycles has added yet another structural layer of demand. To stay viable, electronics manufacturers carry out frequent model updates, thus triggering repeated rounds of testing, certification, and conformity assessment. This cycle is most apparent in consumer electronics and low-voltage electrical products where the time for design refresh is counted in months rather than years. Thus, TIC services associated with re-certification and compliance renewal are experiencing a steady increase even when the overall production volumes are at a standstill or are declining.
Market Restraints / Challenges
The lack of global certification standards, growth fluctuations, trade wars, massive investment in automating and installing industrial safety systems, lack of testing facilities, and huge cost involved in TIC due to diverse standards and regulations may restrict the growth of the testing, inspection, and certification market in electronics & electrical products.
Market Opportunities
Rapid technological advancement and stricter regulations, the TIC (Testing, Inspection, and Certification) industry for electronics and electrical products has a large potential for growth. The need for safe electrical components, connectivity devices and power equipment is growing drastically as electricity distribution becomes more digitalized and telecom networks modernize.
Global supply chains are also benefiting from quicker, scalable, and data-driven compliance solutions is made possible by digital inspection tools, AI-enabled testing platforms, and remote auditing services. Another major opportunity lies in the wide expansion of 5G infrastructure, data centers, and smart grid systems.
Global TIC Market for Electronics and Electrical Products Industry Report Coverage
|
Report Metric
|
Details
|
|
Historical Period
|
2020 - 2024
|
|
Base Year Considered
|
2025
|
|
Forecast Period
|
2026 - 2035
|
|
Market Size in 2025
|
U.S.D. 13.86 Billion
|
|
Revenue Forecast in 2035
|
U.S.D. 25.56 Billion
|
|
Growth Rate
|
6.3%
|
|
Segments Covered in the Report
|
Service Type, Sourcing Type, Product category and Compliance Focus Stage
|
|
Report Scope
|
Market Trends, Drivers, and Restraints; Revenue Estimation and Forecast; Segmentation Analysis; Companies’ Strategic Developments; Market Share Analysis of Key Players; Company Profiling
|
|
Regions Covered in the Report
|
North America, Europe, Asia Pacific
|
TIC Market for Electronics & Electrical Products Industry Segmentation
By Service Type
TIC demand in the electronics and electrical products industry is mainly driven by testing services which account for about 46–48% of the total revenue. This is mainly brought about by electrical safety testing, EMC analysis, environmental stress testing, and performance validation. The next position is held by certification services with a share of approximately 28–30%, which are helped by mandatory approvals such as CE, UL, and other regional marks. The remaining demand is accounted for by inspection services that are mostly linked to factory audits and pre-shipment checks.
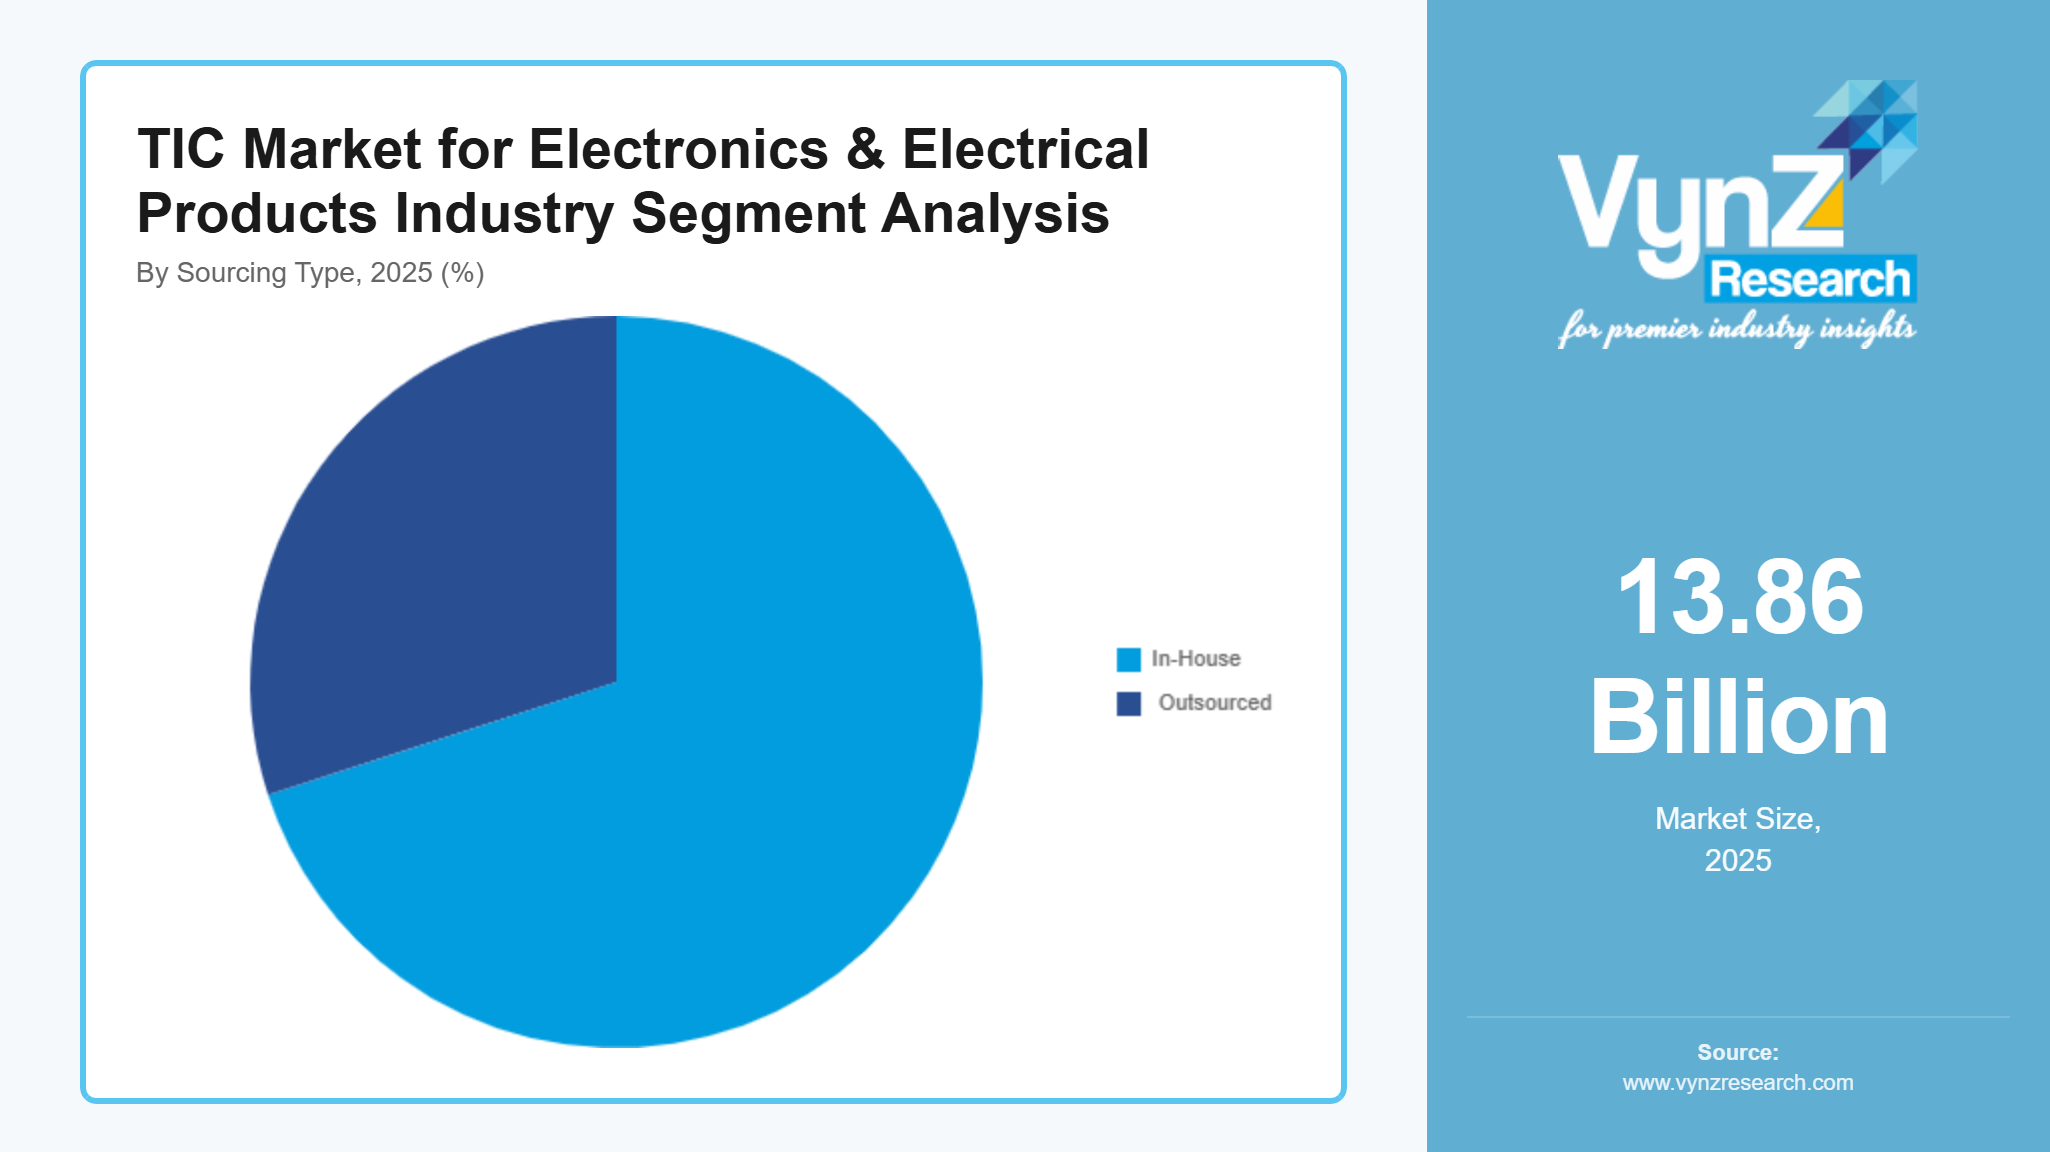
By Sourcing Type
Nearly 70% of the market demand for TIC services are performed by outsourced TIC services as most of the manufacturers are willing to use accredited third-party laboratories in order to get global acceptance of test results. The outsourced services are growing at a compound annual growth rate of approximately 7.5%, being supported by the increasing cross-border trade. In-house testing is still restricted to large multinational manufacturers and makes up about 30% of the demand, growing at a slower rate of around 4.5%, and mainly for internal quality control.
By Product Category
Consumer electronics are the most significant application segment, providing almost 42% of the TIC demand, as a result of the high production volumes and the frequent design updates. Industrial electrical equipment is the second-largest segment with a contribution of approximately 34% and is supported by stringent safety and performance requirements. The remaining portion is made up of low-voltage electrical products, such as cables, switches, and connectors, which have a steady demand due to regulatory oversight and replacement cycles.
By Compliance Focus
Electrical safety testing is the largest area of compliance and accounts for about 39% of TIC activity, with the second largest being EMC and RF testing which accounts for roughly 31%. Energy efficiency and environmental compliance, including RoHS and related directives, make up the rest of the demand. The TIC services connected with energy efficiency certification are expanding at a faster rate, almost 8% per year, due to the stricter efficiency standards in the major markets.
Regional Insights
North America
North America is still a significant market for electronics and electrical TIC services, and it is responsible for about 30–32% of the global demand. The US is the main driver of the regional activity due to stringent safety standards, large consumer electronics consumption, and solid enforcement of compliance requirements. Manufacturers that supply the region have to go through rigorous testing and certification processes, especially for EMC, RF exposure, and energy efficiency. TIC services in North America that are closely linked to regulatory approvals and re-certification cycles are on the rise at a speed of approximately 6.7% per year, and this increase is supported by frequent product refreshes as well as enforcement consistency. The growth is also supported by the increasing need for testing of smart home devices, connected appliances, and industrial automation equipment.
Europe
Europe is the origin of about 25–27% of the world's demand for TIC services in the electronics and electrical products sector. The Region is known to have harmonized regulatory frameworks and the strong enforcement under the EU directives. Testing and certification activities are generated from the product categories due to CE marking, EMC compliance, energy efficiency, and environmental regulations. There is a steady increase in the services related to energy efficiency and sustainability compliance, at a pace of nearly 7.5% per year. Moreover, there is a continuous demand for testing due to regulatory update and product reformulation cycles throughout the region.
Asia Pacific
Asia Pacific is the region with the most rapid growth and its rate is estimated to be between 8% and 9% CAGR. The production and export volumes of China, South Korea, Japan, and Southeast Asia, determine the need for third-party testing and certification services. Export-oriented manufacturers cannot do without accredited TIC providers if they want to meet the requirements of the destination market in North America and Europe. Consequently, the demand for TIC in the region is not only the result of domestic regulation but also of international compliance needs. The continued adoption of smart electronics and industrial automation in Asia Pacific is also a factor that enhances the demand for advanced testing and certification services.
Competitive Landscape / Company Insights
The chemical TIC market is moderately concentrated with strong global competitors and numerous regional specialists competing on service breadth, technical expertise, and regulatory alignment. Leading players dominate through extensive geographic coverage, diversified service portfolios, technological investments, and strategic partnerships or acquisitions to enhance capacity in chemical-specific testing and certification services.
Mini Profiles
SGS S.A. is a global leader in testing, inspection, and certification, SGS offers comprehensive services for electronics, including safety, EMC, energy efficiency, and environmental compliance. Their extensive laboratory network and global presence support cross-border certification and supply chain verification.
Bureau Veritas provides certification, testing, and inspection solutions for electronics and electrical products. Strong in regulatory compliance, product safety audits, and sustainability verification, with expertise in IoT devices, consumer electronics, and industrial equipment.
Intertek Group plc offers end-to-end TIC services for electronics, including performance testing, EMC, functional safety, and RoHS/REACH compliance. Focused on fast time-to-market solutions for global manufacturers.
UL LLC provides applied safety science services, including product certification, cybersecurity testing, and functional safety validation for electronics and electrical equipment across multiple sectors.
Eurofins Scientific delivers specialized testing and certification services for electronics, including chemical compliance, environmental testing, and performance verification, leveraging advanced laboratory automation and analytics.
Key Players
- Intertek Group Plc
- Bureau Veritas
- UL LLC
- SGS SA
- Eurofins USA
- TUV Rheinland
- TUV SUD
- MISTRAS Group
- ASTM
- Applus+
- DNV GL
Recent Developments
In November 2025, Intertek Group plc, a leading Total Quality Assurance provider to industries worldwide, has acquired Suplilab, a market-leading provider of food safety and medical devices testing services, based in San José, Costa Rica.
In December 2025, Bureau Veritas Marine & Offshore (BV) has classed its first methanol-fueled containership, CMA CGM ANTIGONE. The 15,000 TEU methanol dual-fuel vessel was built by CSSC Jiangnan Shipyard for the CMA CGM Group.
In July 2005, Applus+ completed the acquisition of Notice Belgelendirme Muayene ve Denetim Hizmetleri A.Ş., a Turkey‑based Notified Body specialising in medical devices certification under the EU Medical Device Regulation (MDR). This strategic move expands Applus+’s service portfolio by combining Notice’s regulatory expertise with its global testing infrastructure, enabling a one‑stop solution for medical device manufacturers from product testing to system certification and MDR conformity assessment in Europe. Notice’s MDR designation (NB 2764) and ISO 13485 certification capabilities enhance Applus+’s ability to support clients through complex regulatory transitions and accelerate market access for safer, compliant products.
