TIC Market for Oil & Gas Industry Overview
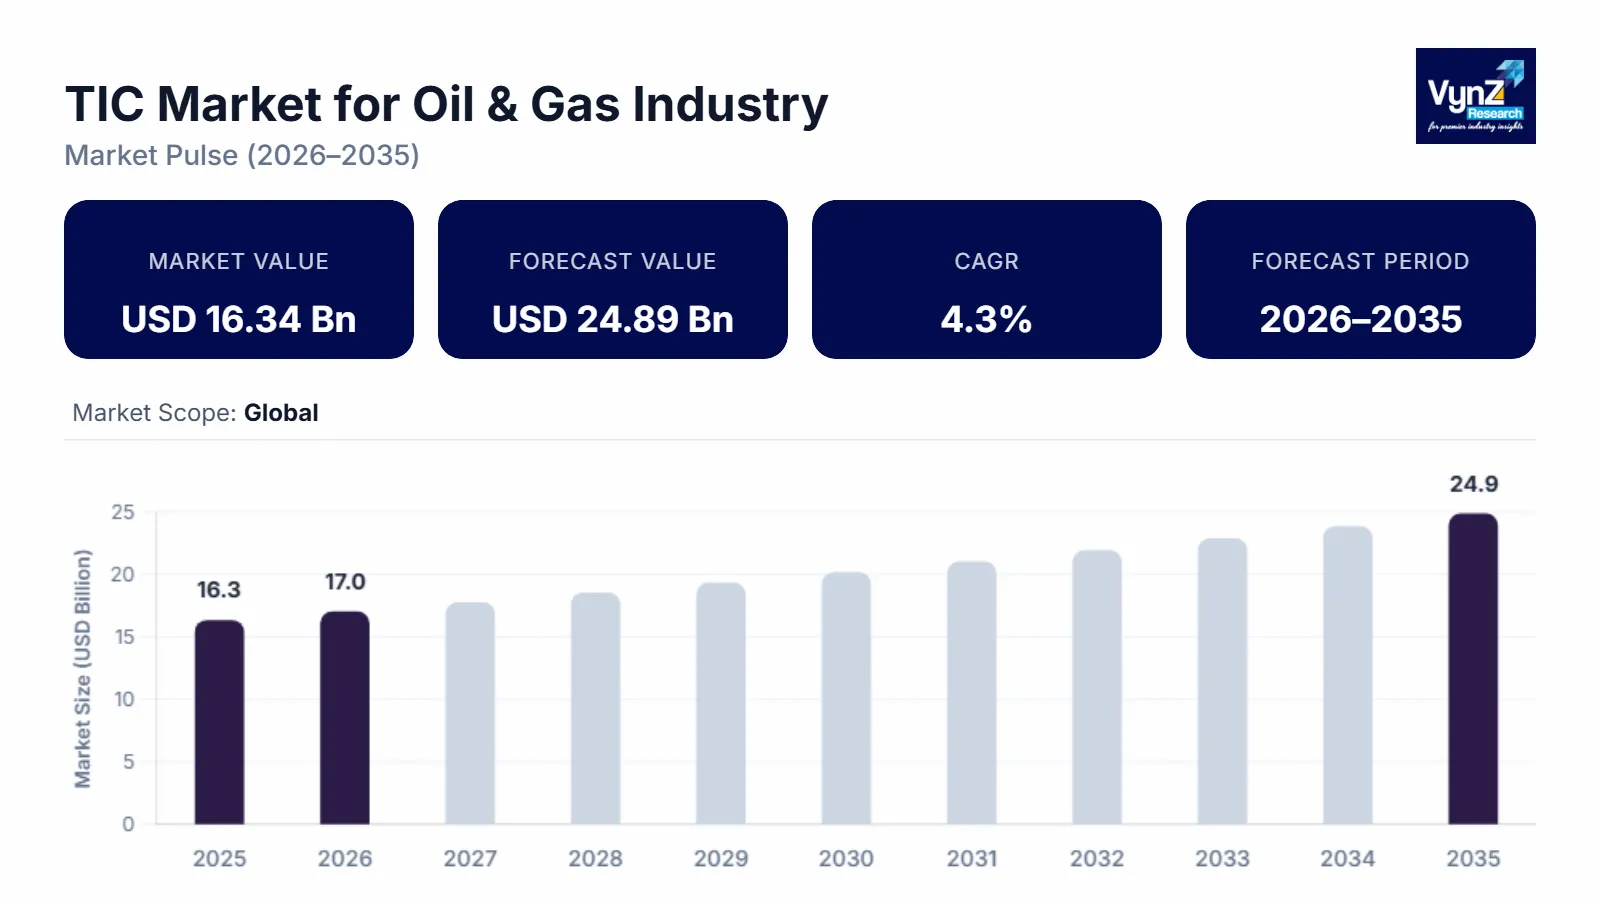
The global TIC Market for Oil & Gas Industry, which was valued at approximately USD 16.34 billion in 2025 and is estimated to reach around USD 17.03 billion in 2026, is projected to reach approximately USD 24.89 billion by 2035, expanding at a CAGR of about 4.3% during the forecast period from 2026 to 2035.
Testing in TIC means an industry activity that assures manufactured products, individual components, and multi-component systems are suitable for the predetermined purpose. Inspection and testing are the operating parts of quality control, which is the most critical factor for the survival of any manufacturing company. Quality control directly supports other factors such as cost, productivity, on-time delivery, and market share. The testing, inspection, and certification market report is composed of conformity assessment agencies, which provide services from audit and inspection to testing, verification, quality assurance, and certification.
Growing foreign investments in exploration, production, and infrastructure development are driving the oil and gas industry's Testing, Inspection, and Certification (TIC) market. The need to guarantee asset reliability, tighter regulations, and growing safety concerns are all drivers propelling market expansion. Demand for TIC services is further increased by growing offshore operations and aging pipeline networks. Regional and international businesses provide specialized solutions in the upstream, midstream, and downstream segments of the fiercely competitive sector. Data-driven monitoring and remote inspection are two new business prospects brought about by digitalization. Service demand is being impacted by the energy transition and the shift to sustainability, setting up TIC providers for consistent long-term development.
Moreover, the growing middle-class population, rapid urbanization, population migration from rural to urban areas globally, mandatory safety regulations, upsurge in the illicit trade of counterfeit and pirated products, advancement in networking and communication technology, the inclination of outsourcing testing, inspection, and certification services has propelled the growth of the TIC market in oil & gas industry. Nevertheless, TIC provides various advantages related to its credibility and image, compliance with legal and regulatory requirements, less turnover of employees, high level of cost control improvement, and fast improvement of different processes. Oil & gas are the main industries in the energy market and play a significant role in the world’s economic fuel resources. The advent of new and advanced technologies, processes, and systems required for producing and distributing oil and gas are complex, thus requiring inspection and testing at regular intervals, the TIC market is anticipated to witness growth, irrespective of industrial seasonality.
TIC Market for Oil & Gas Industry Dynamics
Market Trends
Important market trends, such as increasing digitization and the use of robotics, drones, and AI-driven inspection technologies to increase productivity and reduce operational risks, are shaping the Testing, Inspection, and Certification (TIC) market in the oil and gas sector. Asset integrity management is becoming increasingly and more crucial due to aging infrastructure, particularly in established pipeline networks and oil fields. Demand for enhanced compliance and certification services is being driven by strict environmental and safety laws. Specialized TIC solutions are also becoming more and more necessary due to the growth of deepwater and offshore exploration activities. Service portfolios are also being impacted by sustainability objectives and the global energy transition; providers are expanding into low-carbon compliance and renewable energy inspection services.
Growth Drivers
Tightening safety rules plus tougher environmental laws keep pushing demand for TIC in oil and gas. Because governments require regular checks on pipelines, refineries, offshore rigs, or storage sites. Firms are spending about 32–38% of their risk and compliance cash on outside inspectors - just to dodge spills, mishaps, fines, or halted output.
Aging systems in oil production, transport, and refining push up need for inspection checks. More than half of worldwide energy facilities are over two decades old - raising chances of rust, wear, or breakdowns. Because of this, integrity scans plus damage-free evaluations expand by around 7 to 9 percent every year.
Energy shift efforts are changing what’s needed in testing and inspection. Alongside this, checking emissions or spotting methane leaks is getting more attention fast. So is verifying green tech that cuts carbon output. In oil and gas, these eco-focused checks now grow by about 8 to 10 percent each year. That's because companies face tougher environmental goals they must meet.
Market Restraints / Challenges
The testing, inspection, and certification market face certain challenges like trade wars and growth fluctuations, huge investment for automation and installation of industrial safety systems, high cost of TIC owing to diverse standards and regulations globally. Moreover, ensuring people and site safety, processes need to be optimized from extraction which requires higher pressures and temperatures, a statutory inspection of production assets, and asset life extension are hampering the oil & gas industry. Furthermore, a lack of testing facilities and skilled personnel may hamper the growth of the TIC market.
Market Opportunities
Testing, inspection, and certification is a massive market that provides lucrative opportunities in technologies such as AI, robotics, drones, big data analytics, next-generation automation, and cloud and cybersecurity. Moreover, R&D in TIC will provide promising opportunities for manufacturers in the oil & gas industry which will provide growth in industrial applications and help in providing compatibility to TIC companies for future appraisal and development.
Global TIC Market for Oil & Gas Industry Report Coverage
|
Report Metric
|
Details
|
|
Historical Period
|
2020 - 2024
|
|
Base Year Considered
|
2025
|
|
Forecast Period
|
2026 - 2035
|
|
Market Size in 2025
|
U.S.D. 16.34 Billion
|
|
Revenue Forecast in 2035
|
U.S.D. 24.89 Billion
|
|
Growth Rate
|
4.3%
|
|
Segments Covered in the Report
|
Service Type, Sector, Inspection and Testing Method and End User
|
|
Report Scope
|
Market Trends, Drivers, and Restraints; Revenue Estimation and Forecast; Segmentation Analysis; Companies’ Strategic Developments; Market Share Analysis of Key Players; Company Profiling
|
|
Regions Covered in the Report
|
North America, Europe, Asia Pacific
|
TIC Market for Oil & Gas Industry Segmentation
By Service Type
Depending on what they do, the oil and gas TIC sector covers checking equipment, running tests, giving approvals, doing reviews, also offering guidance. Checking gear is growing quickest - close to 8.9% each year - as pipelines need safety scans, refineries require checks during stoppages, while offshore sites get surveyed along every step.
Checks bring in about 45–47% of all market earnings because safety reviews are required by law. Staying on top of inspections helps avoid downtime while satisfying rules from authorities or insurers.
Testing checks what stuff is made of, looks at rust problems, or measures fumes. More companies use high-tech materials and sensors - so they need more testing.
Certification’s picking up speed because companies want to meet global rules on safety, environment - also quality.
By Sector
In terms of area, the business covers extraction, transport, refining, also gas processing. Transport part’s growing quickest - about 9.2% per year - thanks to more pipelines, bigger storage sites, plus stricter rules.
Pipeline systems need regular checks for damage or leaks, which keeps maintenance teams busy. Rules about safe transport also mean these checkups happen again and again.
Upstream work keeps needing TIC because of exploration, plus tough conditions push stricter checks. Drilling activities require frequent assessments, while offshore rigs face more demanding safety rules.
Refineries plus chemical plants need regular checkups when they shut down, which keeps inspection work steady. Emissions tests during these pauses help maintain a reliable flow of safety checks.
By Inspection and Testing Method
Checking stuff by testing means the field covers ways like scanning without damage, breaking things to test them, checking from far away, or using digital tools. Scanning without harm is growing quickest - around 9.5% each year - since companies want to know how equipment’s doing while keeping work going.
Ultrasonic checks, X-ray scans, or magnetic leak detection often spot issues in pipes and tanks. They help gear last longer while cutting delays.
More folks are using drones to check hard-to-reach spots, which makes inspections safer but also cheaper at the same time.
Destructive testing still matters a lot when checking materials or figuring out why they broke - especially while building stuff or fixing it later.
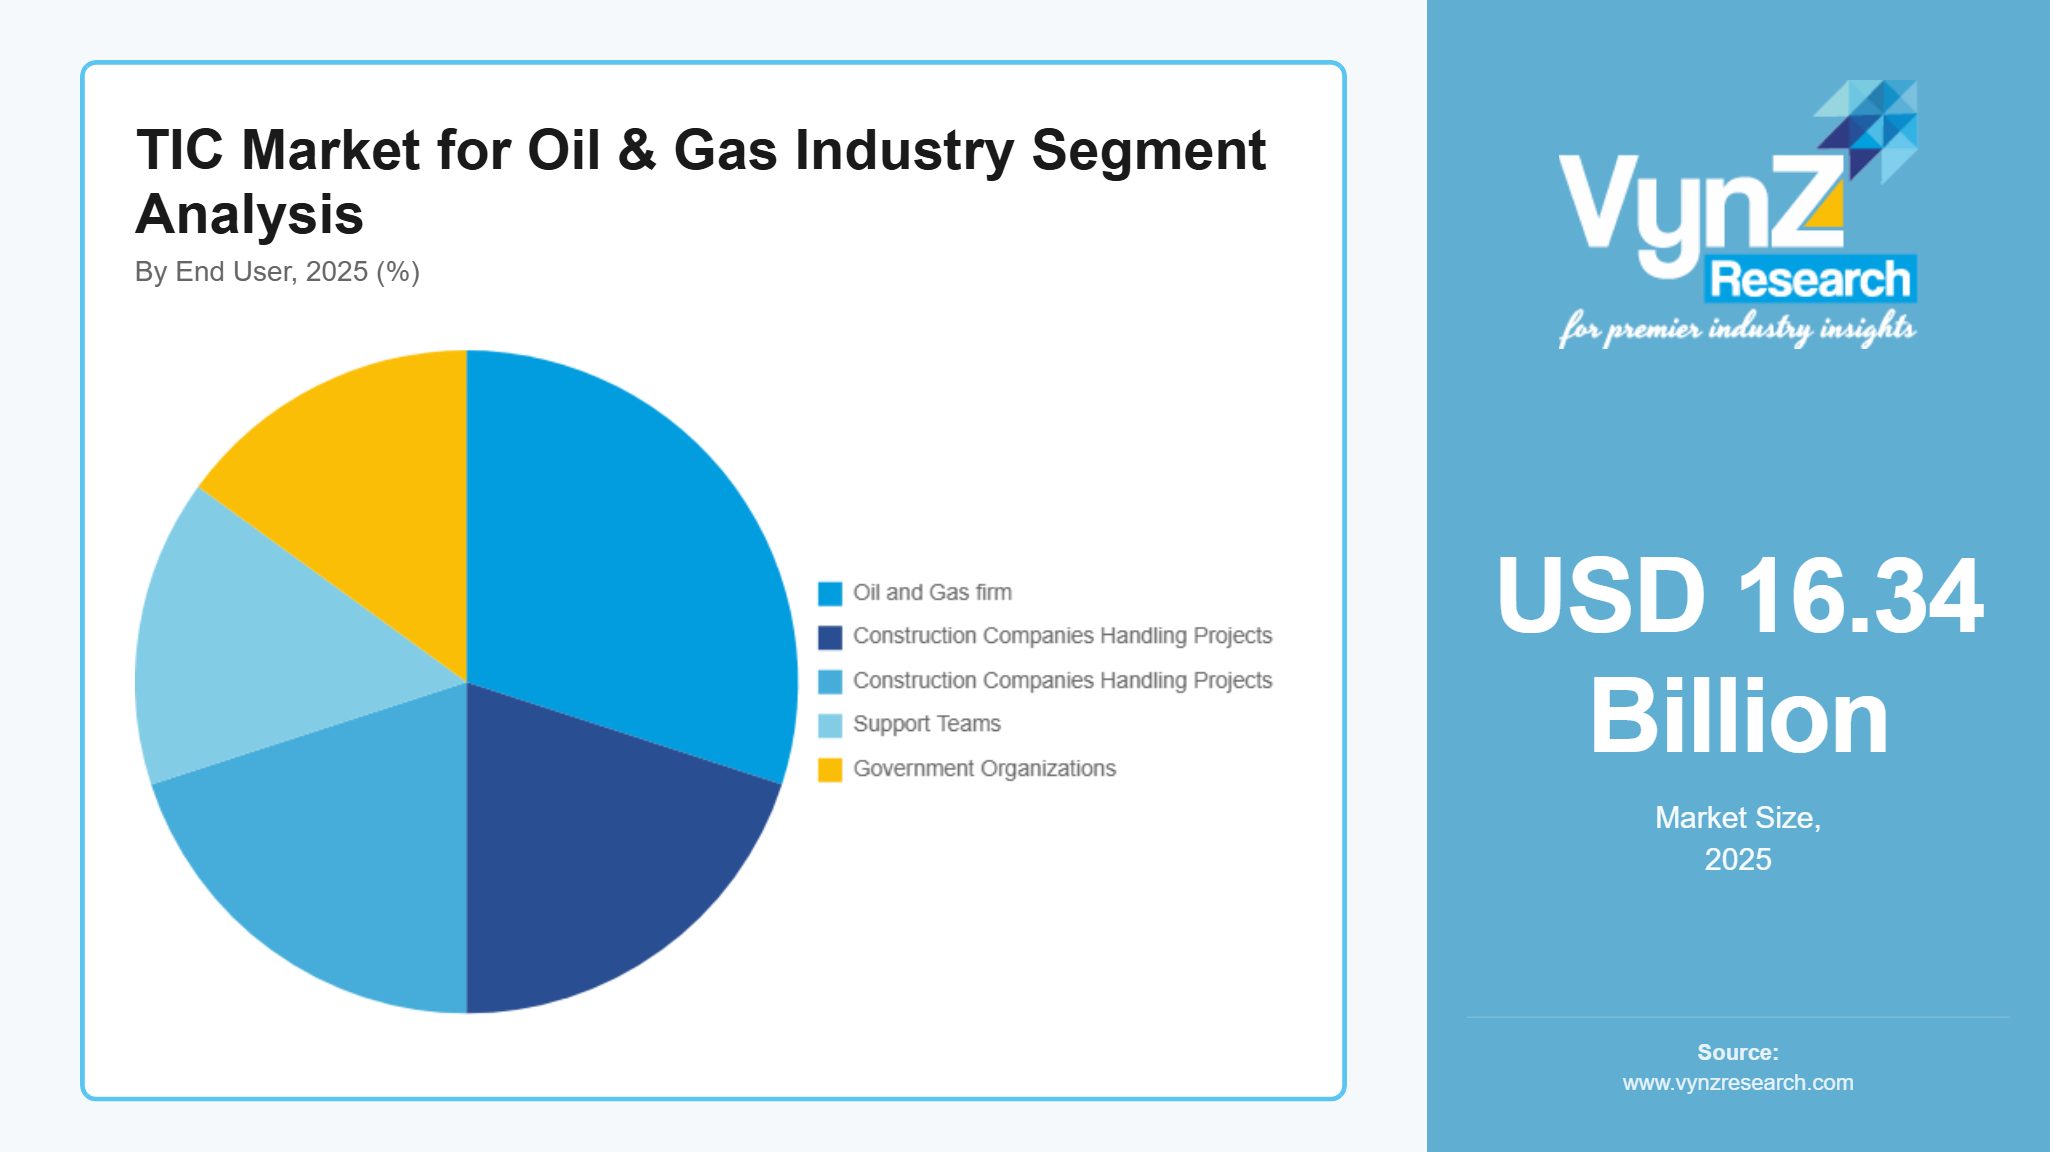
By End User
Depending on who’s using it, this market helps oil and gas firms, construction companies handling projects, support teams, or government watchdogs. Oil and gas players drive most needs - more than half the income here comes from them because they’ve got to follow rules and keep equipment safe.
EPC builders use TIC checks while putting up and starting up sites - this helps keep standards solid plus meet rules smoothly.
Oilfield service companies rely on TIC checks to make sure tools work right - particularly when dealing with extreme heat or pressure.
Regulatory bodies engage TIC providers for independent audits and compliance enforcement across the industry.
Regional Insights
North America
North America still sees big activity in oil and gas testing, rising around 6.1 to 6.7 percent every year. Old pipe systems, fracking sites, along with deepwater rigs keep inspections busy across the region.
Methane tracking plus leak spotting rises about 10% each year - tighter rules in the U.S., along with Canada, push growth.
Digital checks plus drones are catching on fast - making inspections quicker while boosting use of modern testing services.
Asia Pacific
Asia Pacific’s growth leads globally - around 9 to 10 percent each year - fueled by higher power needs plus fresh construction work. Instead of waiting, nations like China or India push ahead with fuel plants, gas lines, along with import hubs across nearby countries.
More cash flowing into LNG hubs and storage spots means more checks and approvals needed. On top of that, stricter safety rules from officials push testing services to grow faster.
Big testing firms boost local reach by teaming up with area players - while setting up on-the-ground checks across regions.
Europe
Europe sees steady gains near 5.5–6% each year, thanks to tough rules on safety and pollution. Meeting EU standards for emissions keeps testing needs stable.
Fewer old oil and gas sites mean more checks and scans. Safety reviews plus eco-checks rise quicker than standard checkups.
EU inspection firms target premium consulting jobs, so deals bring in more cash even if sales don't grow fast. While volumes inch up slowly, their work leans heavily on regulation support and tailored advice across industries.
Competitive Landscape / Company Insights
The Testing, Inspection, and Certification (TIC) market for the oil & gas industry is moderately fragmented, with a mix of global leaders and regional specialists competing on technology, scale, and service quality. The top players collectively hold a limited share, indicating strong competition and opportunities for niche providers.
Mini Profiles
SGS SA is a global leader in TIC services, SGS offers extensive inspection, testing, and certification solutions across oil & gas assets. The company emphasizes sustainability, ESG verification, and digital inspection tools, strengthening its leadership position through acquisitions and innovation.
Founded in 1828, Bureau Veritas operates in over 140 countries with a strong presence in marine, offshore, and industrial services. It focuses on AI-driven compliance, lifecycle asset management, and digital platforms for continuous inspection.
Intertek Group plc provides quality assurance and testing services across 100+ countries. It leverages a large lab network and focuses on digital solutions and acquisitions to expand its oil & gas and environmental testing capabilities.
DNV is a major certification and risk management provider with strong expertise in offshore oil & gas and energy systems. It focuses on safety, asset integrity, and energy transition services, including renewables and decarbonization.
Key Players
- Intertek Group Plc
- Bureau Veritas
- MISTRAS Group
- SGS SA
- Eurofins Scientific
- TUV Rheinland
- TUV SUD
- DEKRA SE
- Applus+
- DNV GL
Recent Developments
In March 2026, Panasonic has launched a liquid cooling systems business for AI data centers. This business focus on cooling systems for high-performance computing & generative AI servers and development of high-capacity cooling units (1,200 kW+) which aligns with rising demand from data centers and cloud computing.
In March 2026, ABB Robotics Partners with NVIDIA to Deliver Industrial-Grade Physical AI at Scale. The collaboration focuses on combining ABB Robotics’ software programming, design and simulation suite, RobotStudio, with the physically accurate simulation power of NVIDIA Omniverse libraries to close technology's long-standing 'sim-to-real’ gap. Developers can simulate robots in digital twins and generate synthetic data to train their physical AI models, enabling businesses of all types and sizes to deploy AI-driven robotics for various industrial workflows.
In February 2026, Google has awarded Form Energy, Inc. a USD billion contract to provide its cutting-edge iron-air batteries for a Minnesota data center project. One of the biggest and longest-lasting battery installations in the world, this project entails the deployment of a massive energy storage system that can provide electricity constantly for up to 100 hours. Iron-air batteries are less expensive for widespread use since they are made of inexpensive materials like iron.
