Status : Published | Published On : Dec, 2023 | Report Code : VRAT4061 | Industry : Automotive & Transportation | Available Format :
![]() |
Page : 171 |
The global electric bus charging station market is projected to reach USD 13.4 billion by 2030, registering a CAGR of 10.5% during the forecast period. Increasing adoption of electric buses in the public transportation system, supporting government initiatives and schemes, and growing investment towards charging station infrastructure, propelling the growth of the market.
On the basis of charger, the global electric bus charging station market is categorized into off-board and on-board chargers, wherein on-board category accounted for larger share in 2020 in terms of sales volume. The category is expected to lead throughout the forecast period. However, the off-board category is expected to witness faster growth during the forecast period because it offers the electric bus manufacturers to reduce the weight of the buses and makes it lighter, with the help of off-board station. This will result in fast charging at higher power levels.
On the basis of type, the global electric bus charging station market is divided into depot charging, opportunity charging, and inductive charging. Of all, the depot charging category accounted for largest share in 2020 in terms of sales volume. This is attributed to the increasing demand of private and public transport agencies towards overnight charging buses, depot charging stations have more similar operational characteristics to diesel buses.
On the basis of power, the global electric bus charging station market is categorized into less than 50 kW, 50–150 kW, 151–450 kW, and more than 450 kW. Of all, the less than 50 kW category accounted for largest share in 2020 in terms of volume. The major reason behind the growth of the category in the market is the lower cost associated with these charging stations.
Report Metric |
Details |
Historical Period |
2020 - 2024 |
Base Year Considered |
2025 |
Forecast Period |
2026 - 2035 |
Market Size in 2025 |
U.S.D. Billion |
Revenue Forecast in 2035 |
U.S.D. Billion |
Growth Rate |
% |
Segments Covered in the Report |
|
Report Scope |
Market Trends, Drivers, and Restraints; Revenue Estimation and Forecast; Segmentation Analysis; Impact of COVID-19; Companies’ Strategic Developments; Market Share Analysis of Key Players; Company Profiling |
Regions Covered in the Report |
|
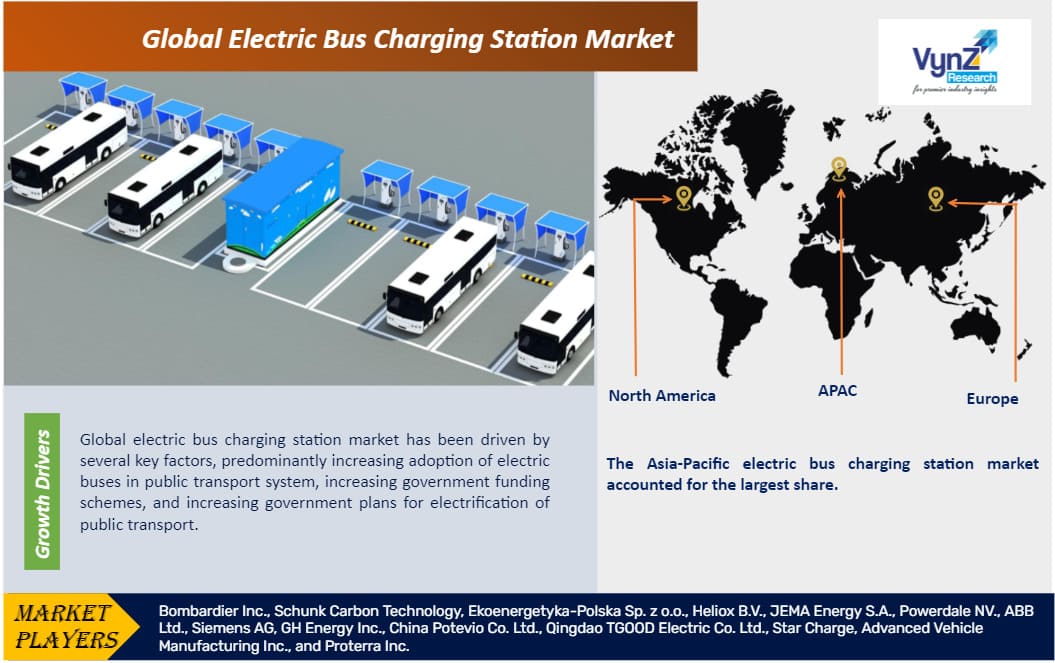
Global electric bus charging station market has been driven by several key factors, predominantly increasing adoption of electric buses in public transport system, increasing government funding schemes, and increasing government plans for electrification of public transport.
Different governments across the globe are taking initiatives to replace the petroleum-based automotive fleet with electric powered vehicles. Different countries provide incentive and frame regulations to support the adoption of electric vehicles. In European Union, governments are undertaking key initiatives to opt for green energy-driven vehicles. The policies related to electric buss in EU is mainly focused on technological optimization and market development.
Similarly, China has an aggressive target to reduce carbon emission and adopt electric vehicles. As reported by Forbes, the central and local government in China spent $ 7.7 billion on electric vehicles subsidiary in 2017. Similarly, in China electric vehicles are exempt from purchase taxes during 2014 – 2017, Chinese government has further extended it to 2020. The Chinese government at Centre offers consumers subsidy renews its plans in every two or three years. For battery electric vehicles, subsidies were around 40 to 60% of the vehicle cost. Also, in 2018, the country implemented dual-credit policy which targets automakers selling passenger vehicles based on their average fuel consumption credits and new energy vehicle credits. This applies to the manufacturers of 30,000 vehicles or more annually. All the above stated factors help in the growth of the electric bus charging station market.
Key factors hindering the growth of the global electric bus charging station market are high installation cost and high maintenance cost of an electric bus charging station.
Geographically, the Asia-Pacific electric bus charging station market accounted for the largest share in 2020 in terms of volumes. This is attributed to the increasing adoption rate of electric vehicles in China, government supporting schemes for the adoption of electric vehicles and for developing infrastructure related to electric vehicles include charging station.
Bombardier Inc. is a Canadian business jet manufacturer which is headquartered in Montreal. The company was founded in 1942 by Joseph-Armand Bombardier to market his snowmobiles and became one of the world's biggest producers of aircraft and trains.
Schunk Carbon Technology is a global leader in the development, manufacture and application of carbon and graphite solutions. Company combine innovative strength and exceptional service to offer a range of products and services that is unique in the market.
Some of the key players operating in the global electric bus charging station market are Bombardier Inc., Schunk Carbon Technology, Ekoenergetyka-Polska Sp. z o.o., Heliox B.V., JEMA Energy S.A., Powerdale NV., ABB Ltd., Siemens AG, GH Energy Inc., China Potevio Co. Ltd., Qingdao TGOOD Electric Co. Ltd., Star Charge, Advanced Vehicle Manufacturing Inc., and Proterra Inc.
ABB E-mobility and MAN Truck & Bus collaborated for megawatt charging (MCS). This shall help to establish reliable products as quickly as possible in an emerging market environment
Siemens recently acquired Heliox which complements Siemens’ existing eMobility charging portfolio by adding products and solutions ranging from 40 kilowatts to megawatt charging solutions for depots and en-route charging.
Forecast Parameters
- Identifying variables and establishing market impact.
- Establishing market trends regionally.
- Analyzing opportunities and market penetration rates by understanding product commercialization, regional expansion.
- Analyzing demand and supply trends and changes in industry dynamics to establish future growth.
- Analyzing sustainability strategies adhered by market participants in an attempt to determine future course of the market.
- Analyzing historical market trends and super-imposing them on the current and future variables to determine the year-on-year trend.
- Understanding adoption, production, export, import, and regulatory framework.
Data Validation
- Estimated and forecasted data was validated through industry experts.
- Apart from industry experts, data triangulation methods were used for validation.
- Bottom-up and top-down approach has been used for estimation and forecast of market data, whereas top-down approach was used for validation.
- Demand, as well as supply-side surveys, were conducted in order to understand the industry dynamics and data validation.
Primary Research
VynZ Research conducts extensive primary research to understand the market dynamics, validate market data and have key opinions from the industry experts. The key profiles approached within the industry include CEO, CFO, CTO, President, Vice President, Product Managers, Regional Heads and Others. Also, end-user surveys comprising of consumers are also conducted to understand consumer behaviour.
The Electric Bus Charging Station Market report offers a comprehensive market segmentation analysis along with an estimation for the forecast period 2025–2030.
Segments Covered in the Report
Geographical Segmentation
Source: VynZ Research
1. Research Overview
1.1. The Report Offers
1.2. Market Coverage
1.2.1. By Charger
1.2.2. By Type
1.2.3. By Power
1.2.4. By Region
1.3. Research Phases
1.4. Limitations
1.5. Market Size Estimations and Forecast
1.5.1. Data Sources
1.5.1.1. Primary Research
1.5.1.2. Secondary Research
1.5.2. Methodology
1.5.2.1. Data Exploration
1.5.2.2. Forecast Parameters
1.5.2.3. Data Validation
1.5.2.4. Assumptions
1.5.3. Study Period & Data Reporting Unit
2. Executive Summary
3. Market Definition
3.1. By Charger
3.1.1. Off-Board
3.1.2. On-Board
3.2. By Type
3.2.1. Depot Charging
3.2.2. Opportunity Charging
3.2.3. Inductive Charging
3.3. By Power
3.3.1. <50 kW
3.3.2. 50–150 kW
3.3.3. 150–450 kW
3.3.4. >450 kW
4. Industry Overview
4.1. Industry Dynamics
4.1.1. Market Growth Drivers
4.1.2. Market Growth Restraints
4.1.3. Key Market Trends
4.1.4. Major Opportunities
4.2. Industry Ecosystem
4.2.1. Porter’s Five Forces Analysis
4.2.2. Recent Development Analysis
4.2.3. Value Chain Analysis
4.3. Competitive Insight
4.3.1. Competitive Position of Industry Players
4.3.2. Market Attractive Analysis
4.3.3. Market Share Analysis
5. Global Market Estimate and Forecast
5.1. By Charger
5.2. By Type
5.3. By Power
5.4. By Region – North America, Europe, Asia-Pacific, and Rest of the World
6. North America Market Estimate and Forecast
6.1. By Charger
6.2. By Type
6.3. By Power
6.4. By Country – U.S. and Canada
7. Europe Market Estimate and Forecast
7.1. By Charger
7.2. By Type
7.3. By Power
7.4. By Country – U.K., Germany, France, Spain, Netherlands, Sweden, Poland, Belgium, and Rest of Europe
8. Asia-Pacific Market Estimate and Forecast
8.1. By Charger
8.2. By Type
8.3. By Power
8.4. By Country – China, India, and Rest of Asia-Pacific
9. Rest of the World (RoW) Market Estimate and Forecast
9.1. By Charger
9.2. By Type
9.3. By Power
9.4. By Country – Brazil, and Other Countries
10. Company Profiles
10.1. Bombardier Inc.
10.1.1. Snapshot
10.1.2. Overview
10.1.3. Offerings
10.1.4. Financial Insight
10.1.5. Recent Developments
10.2. Schunk Carbon Technology
10.2.1. Snapshot
10.2.2. Overview
10.2.3. Offerings
10.2.4. Financial Insight
10.2.5. Recent Developments
10.3. Ekoenergetyka-Polska Sp. z o.o.
10.3.1. Snapshot
10.3.2. Overview
10.3.3. Offerings
10.3.4. Financial Insight
10.3.5. Recent Developments
10.4. Heliox B.V.
10.4.1. Snapshot
10.4.2. Overview
10.4.3. Offerings
10.4.4. Financial Insight
10.4.5. Recent Developments
10.5. JEMA Energy S.A.
10.5.1. Snapshot
10.5.2. Overview
10.5.3. Offerings
10.5.4. Financial Insight
10.5.5. Recent Developments
10.6. Powerdale NV
10.6.1. Snapshot
10.6.2. Overview
10.6.3. Offerings
10.6.4. Financial Insight
10.6.5. Recent Developments
10.7. ABB Ltd.
10.7.1. Snapshot
10.7.2. Overview
10.7.3. Offerings
10.7.4. Financial Insight
10.7.5. Recent Developments
10.8. Siemens AG
10.8.1. Snapshot
10.8.2. Overview
10.8.3. Offerings
10.8.4. Financial Insight
10.8.5. Recent Developments
10.9. GH Energy Inc.
10.9.1. Snapshot
10.9.2. Overview
10.9.3. Offerings
10.9.4. Financial Insight
10.9.5. Recent Developments
10.10. China Potevio Co. Ltd.
10.10.1. Snapshot
10.10.2. Overview
10.10.3. Offerings
10.10.4. Financial Insight
10.10.5. Recent Developments
10.11. Qingdao TGOOD Electric Co. Ltd.
10.11.1. Snapshot
10.11.2. Overview
10.11.3. Offerings
10.11.4. Financial Insight
10.11.5. Recent Developments
10.12. Star Charge
10.12.1. Snapshot
10.12.2. Overview
10.12.3. Offerings
10.12.4. Financial Insight
10.12.5. Recent Developments
10.13. Advanced Vehicle Manufacturing Inc.
10.13.1. Snapshot
10.13.2. Overview
10.13.3. Offerings
10.13.4. Financial Insight
10.13.5. Recent Developments
10.14. Proterra Inc.
10.14.1. Snapshot
10.14.2. Overview
10.14.3. Offerings
10.14.4. Financial Insight
10.14.5. Recent Developments
11. Appendix
11.1. Exchange Rates
11.2. Abbreviations
Note: Financial insight and recent developments of different companies are subject to availability of information in secondary domain.
List of Tables
Table 1 Sources
Table 2 Study Periods
Table 3 Data Reporting Unit
Table 4 Global Electric Bus Charging Station Market Size, by Charger, 2018 – 2023(Units)
Table 5 Global Electric Bus Charging Station Market Size, by Charger, 2025 – 2030 (Units)
Table 6 Global Electric Bus Charging Station Market Size, by Charger, 2018 – 2023(USD Billion)
Table 7 Global Electric Bus Charging Station Market Size, by Charger, 2025 – 2030 (USD Billion)
Table 8 Global Electric Bus Charging Station Market Size, by Type, 2018 – 2023(Units)
Table 9 Global Electric Bus Charging Station Market Size, by Type, 2025 – 2030 (Units)
Table 10 Global Electric Bus Charging Station Market Size, by Type, 2018 – 2023(USD Billion)
Table 11 Global Electric Bus Charging Station Market Size, by Type, 2025 – 2030 (USD Billion)
Table 12 Global Electric Bus Charging Station Market Size, by Power, 2018 – 2023(Units)
Table 13 Global Electric Bus Charging Station Market Size, by Power, 2025 – 2030 (Units)
Table 14 Global Electric Bus Charging Station Market Size, by Power, 2018 – 2023(USD Billion)
Table 15 Global Electric Bus Charging Station Market Size, by Power, 2025 – 2030 (USD Billion)
Table 16 Global Electric Bus Charging Station Market Size, by Region, 2018 – 2023(Units)
Table 17 Global Electric Bus Charging Station Market Size, by Region, 2025 – 2030 (Units)
Table 18 Global Electric Bus Charging Station Market Size, by Region, 2018 – 2023(USD Billion)
Table 19 Global Electric Bus Charging Station Market Size, by Region, 2025 – 2030 (USD Billion)
Table 20 North America Electric Bus Charging Station Market Size, by Charger, 2018 – 2023(Units)
Table 21 North America Electric Bus Charging Station Market Size, by Charger, 2025 – 2030 (Units)
Table 22 North America Electric Bus Charging Station Market Size, by Charger, 2018 – 2023(USD Billion)
Table 23 North America Electric Bus Charging Station Market Size, by Charger, 2025 – 2030 (USD Billion)
Table 24 North America Electric Bus Charging Station Market Size, by Type, 2018 – 2023(Units)
Table 25 North America Electric Bus Charging Station Market Size, by Type, 2025 – 2030 (Units)
Table 26 North America Electric Bus Charging Station Market Size, by Type, 2018 – 2023(USD Billion)
Table 27 North America Electric Bus Charging Station Market Size, by Type, 2025 – 2030 (USD Billion)
Table 28 North America Electric Bus Charging Station Market Size, by Power, 2018 – 2023(Units)
Table 29 North America Electric Bus Charging Station Market Size, by Power, 2025 – 2030 (Units)
Table 30 North America Electric Bus Charging Station Market Size, by Power, 2018 – 2023(USD Billion)
Table 31 North America Electric Bus Charging Station Market Size, by Power, 2025 – 2030 (USD Billion)
Table 32 North America Electric Bus Charging Station Market Size, by Country, 2018 – 2023(Units)
Table 33 North America Electric Bus Charging Station Market Size, by Country, 2025 – 2030 (Units)
Table 34 North America Electric Bus Charging Station Market Size, by Country, 2018 – 2023(USD Billion)
Table 35 North America Electric Bus Charging Station Market Size, by Country, 2025 – 2030 (USD Billion)
Table 36 Europe Electric Bus Charging Station Market Size, by Charger, 2018 – 2023(Units)
Table 37 Europe Electric Bus Charging Station Market Size, by Charger, 2025 – 2030 (Units)
Table 38 Europe Electric Bus Charging Station Market Size, by Charger, 2018 – 2023(USD Billion)
Table 39 Europe Electric Bus Charging Station Market Size, by Charger, 2025 – 2030 (USD Billion)
Table 40 Europe Electric Bus Charging Station Market Size, by Type, 2018 – 2023(Units)
Table 41 Europe Electric Bus Charging Station Market Size, by Type, 2025 – 2030 (Units)
Table 42 Europe Electric Bus Charging Station Market Size, by Type, 2018 – 2023(USD Billion)
Table 43 Europe Electric Bus Charging Station Market Size, by Type, 2025 – 2030 (USD Billion)
Table 44 Europe Electric Bus Charging Station Market Size, by Power, 2018 – 2023(Units)
Table 45 Europe Electric Bus Charging Station Market Size, by Power, 2025 – 2030 (Units)
Table 46 Europe Electric Bus Charging Station Market Size, by Power, 2018 – 2023(USD Billion)
Table 47 Europe Electric Bus Charging Station Market Size, by Power, 2025 – 2030 (USD Billion)
Table 48 Europe Electric Bus Charging Station Market Size, by Country, 2018 – 2023(Units)
Table 49 Europe Electric Bus Charging Station Market Size, by Country, 2025 – 2030 (Units)
Table 50 Europe Electric Bus Charging Station Market Size, by Country, 2018 – 2023(USD Billion)
Table 51 Europe Electric Bus Charging Station Market Size, by Country, 2025 – 2030 (USD Billion)
Table 52 Asia-Pacific Electric Bus Charging Station Market Size, by Charger, 2018 – 2023(Units)
Table 53 Asia-Pacific Electric Bus Charging Station Market Size, by Charger, 2025 – 2030 (Units)
Table 54 Asia-Pacific Electric Bus Charging Station Market Size, by Charger, 2018 – 2023(USD Billion)
Table 55 Asia-Pacific Electric Bus Charging Station Market Size, by Charger, 2025 – 2030 (USD Billion)
Table 56 Asia-Pacific Electric Bus Charging Station Market Size, by Type, 2018 – 2023(Units)
Table 57 Asia-Pacific Electric Bus Charging Station Market Size, by Type, 2025 – 2030 (Units)
Table 58 Asia-Pacific Electric Bus Charging Station Market Size, by Type, 2018 – 2023(USD Billion)
Table 59 Asia-Pacific Electric Bus Charging Station Market Size, by Type, 2025 – 2030 (USD Billion)
Table 60 Asia-Pacific Electric Bus Charging Station Market Size, by Power, 2018 – 2023(Units)
Table 61 Asia-Pacific Electric Bus Charging Station Market Size, by Power, 2025 – 2030 (Units)
Table 62 Asia-Pacific Electric Bus Charging Station Market Size, by Power, 2018 – 2023(USD Billion)
Table 63 Asia-Pacific Electric Bus Charging Station Market Size, by Power, 2025 – 2030 (USD Billion)
Table 64 Asia-Pacific Electric Bus Charging Station Market Size, by Country, 2018 – 2023(Units)
Table 65 Asia-Pacific Electric Bus Charging Station Market Size, by Country, 2025 – 2030 (Units)
Table 66 Asia-Pacific Electric Bus Charging Station Market Size, by Country, 2018 – 2023(USD Billion)
Table 67 Asia-Pacific Electric Bus Charging Station Market Size, by Country, 2025 – 2030 (USD Billion)
Table 68 RoW Electric Bus Charging Station Market Size, by Charger, 2018 – 2023(Units)
Table 69 RoW Electric Bus Charging Station Market Size, by Charger, 2025 – 2030 (Units)
Table 70 RoW Electric Bus Charging Station Market Size, by Charger, 2018 – 2023(USD Billion)
Table 71 RoW Electric Bus Charging Station Market Size, by Charger, 2025 – 2030 (USD Billion)
Table 72 RoW Electric Bus Charging Station Market Size, by Type, 2018 – 2023(Units)
Table 73 RoW Electric Bus Charging Station Market Size, by Type, 2025 – 2030 (Units)
Table 74 RoW Electric Bus Charging Station Market Size, by Type, 2018 – 2023(USD Billion)
Table 75 RoW Electric Bus Charging Station Market Size, by Type, 2025 – 2030 (USD Billion)
Table 76 RoW Electric Bus Charging Station Market Size, by Power, 2018 – 2023(Units)
Table 77 RoW Electric Bus Charging Station Market Size, by Power, 2025 – 2030 (Units)
Table 78 RoW Electric Bus Charging Station Market Size, by Power, 2018 – 2023(USD Billion)
Table 79 RoW Electric Bus Charging Station Market Size, by Power, 2025 – 2030 (USD Billion)
Table 80 RoW Electric Bus Charging Station Market Size, by Country, 2018 – 2023(Units)
Table 81 RoW Electric Bus Charging Station Market Size, by Country, 2025 – 2030 (Units)
Table 82 RoW Electric Bus Charging Station Market Size, by Country, 2018 – 2023(USD Billion)
Table 83 RoW Electric Bus Charging Station Market Size, by Country, 2025 – 2030 (USD Billion)
Table 84 Snapshot – Bombardier Inc.
Table 85 Snapshot – Schunk Carbon Technology
Table 86 Snapshot – Ekoenergetyka-Polska Sp. z o.o.
Table 87 Snapshot – Heliox B.V.
Table 88 Snapshot – JEMA Energy S.A.
Table 89 Snapshot – Powerdale NV
Table 90 Snapshot – ABB Ltd.
Table 91 Snapshot – Siemens AG
Table 92 Snapshot – GH Energy Inc.
Table 93 Snapshot – China Potevio Co. Ltd.
Table 94 Snapshot – Qingdao TGOOD Electric Co. Ltd.
Table 95 Snapshot – Star Charge
Table 96 Snapshot – Advanced Vehicle Manufacturing Inc.
Table 97 Snapshot – Proterra Inc.
List of Figures
Figure 1 Market Coverage
Figure 2 Research Phases
Figure 3 Secondary Offerings for Different Parameters
Figure 4 Methodology
Figure 5 Data Mining & Exploration
Figure 6 Data Triangulation
Figure 7 Assumptions for Market Estimation and Forecast
Figure 8 Market Synopsis
Figure 9 Global Electric Bus Charging Station Market - Growth Drivers and Restraints
Figure 10 Competitive Benchmark
Figure 11 Global Electric Bus Charging Station Market Highlight
Figure 12 Global Electric Bus Charging Station Market Size, by Charger, 2018 - 2030 (Units)
Figure 13 Global Electric Bus Charging Station Market Size, by Type, 2018 - 2030 (Units)
Figure 14 Global Electric Bus Charging Station Market Size, by Power, 2018 - 2030 (Units)
Figure 15 Global Electric Bus Charging Station Market Size, by Region, 2018 - 2030 (Units)
Figure 16 North America Electric Bus Charging Station Market Highlight
Figure 17 North America Electric Bus Charging Station Market Size, by Charger, 2018 - 2030 (Units)
Figure 18 North America Electric Bus Charging Station Market Size, by Type, 2018 - 2030 (Units)
Figure 19 North America Electric Bus Charging Station Market Size, by Power, 2018 - 2030 (Units)
Figure 20 North America Electric Bus Charging Station Market Size, by Country, 2018 - 2030 (Units)
Figure 21 Europe Electric Bus Charging Station Market Highlight
Figure 22 Europe Electric Bus Charging Station Market Size, by Charger, 2018 - 2030 (Units)
Figure 23 Europe Electric Bus Charging Station Market Size, by Type, 2018 - 2030 (Units)
Figure 24 Europe Electric Bus Charging Station Market Size, by Power, 2018 - 2030 (Units)
Figure 25 Europe Electric Bus Charging Station Market Size, by Country, 2018 - 2030 (Units)
Figure 26 Asia-Pacific Electric Bus Charging Station Market Highlight
Figure 27 Asia-Pacific Electric Bus Charging Station Market Size, by Charger, 2018 - 2030 (Units)
Figure 28 Asia-Pacific Electric Bus Charging Station Market Size, by Type, 2018 - 2030 (Units)
Figure 29 Asia-Pacific Electric Bus Charging Station Market Size, by Power, 2018 - 2030 (Units)
Figure 30 Asia-Pacific Electric Bus Charging Station Market Size, by Country, 2018 - 2030 (Units)
Figure 31 RoW Electric Bus Charging Station Market Highlight
Figure 32 RoW Electric Bus Charging Station Market Size, by Charger, 2018 - 2030 (Units)
Figure 33 RoW Electric Bus Charging Station Market Size, by Type, 2018 - 2030 (Units)
Figure 34 RoW Electric Bus Charging Station Market Size, by Power, 2018 - 2030 (Units)
Figure 35 RoW Electric Bus Charging Station Market Size, by Country, 2018 - 2030 (Units)
Global Electric Bus Charging Station Market Coverage
Charger Insight and Forecast 2025-2030
Type Insight and Forecast 2025-2030
Power Insight and Forecast 2025-2030
Geographical Segmentation
Electric Bus Charging Station Market by Region
North America
Europe
Asia-Pacific
Rest of the World (RoW)
Vynz Research know in your business needs, you required specific answers pertaining to the market, Hence, our experts and analyst can provide you the customized research support on your specific needs.
After the purchase of current report, you can claim certain degree of free customization within the scope of the research.
Please let us know, how we can serve you better with your specific requirements to your research needs. Vynz research promises for quick reversal for your current business requirements.
Purchase Options
Latest Report
Research Methodology
Connect With Our Sales Team
Electric Bus Charging Station Market