Status : Published | Published On : Dec, 2023 | Report Code : VRAT4064 | Industry : Automotive & Transportation | Available Format : | Page : 185 |
Industry Overview
The Global Electric Vehicle Communication Controller Market is expected to reach USD 0.64 billion by 2030, growing at a CAGR of 34.6% during the forecast period. The global electric vehicle communication controller market is growing at a noteworthy pace, due to the increasing adoption of electric vehicles and several government initiatives across the globe. Among the vehicle type segment, passenger cars contribute a major share of the market. With the occurrence of high-power batteries in the automotive industry, the demand for fast charging has accelerated rapidly. As a result, this will boost the demand for fast-charging types in the passenger vehicle sector.
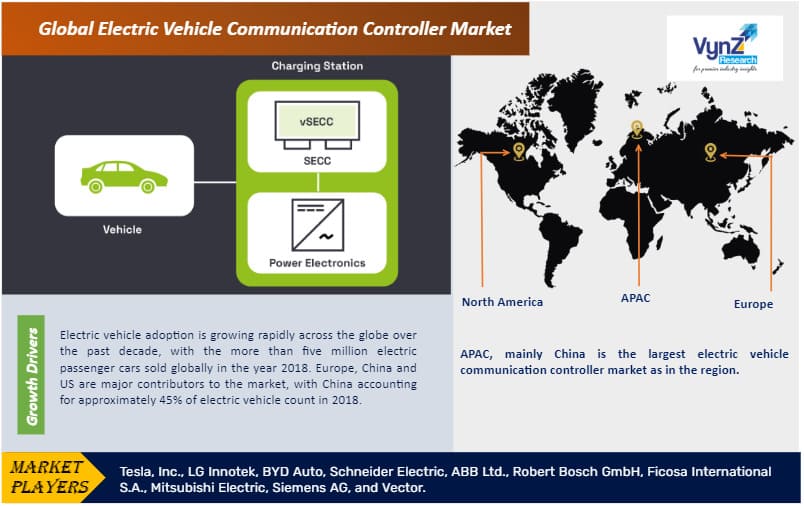
The Electric Vehicle Communication Controller acts as a key component supporting communication between electric vehicles and chargers for fast and reliable charging. EVCC is a gateway between an external charger and vehicle ECU (Engine Control Unit) assisting in exchanging the information mutually through communication.
Market Segmentation
Insight by System
Based on the system, the market is bifurcated into electric vehicle communication controller (EVCC) and supply equipment communication controller (SECC). Among both the system types, the EVCC segment is expected to grow at the fastest rate in the market. In addition, the SECC is the control unit that runs the communication protocol, and the segment is expected to grow in a sector where vehicle safety is one of the prime disquiets. However, the EVCC sector captured a major market share in 2018 and is expected to grow rapidly, owing to concerns about the more user-friendly and secure mode of charging EVs.
Insight by Charging Type
On the basis of charging type, the market is subdivided into plug-in and inductive. Among both these charging types, plug-in also known as wired charging mode accounted foremost share in the EVCC market, being one of the most adopted charging methods. However, inductive or wireless charging is one of the most innovative technologies that is aggressively advancing and is expected to be a game changer for the EV market.
Insight by Vehicle Type
Based on vehicle type, the market is bifurcated into passenger cars and commercial vehicles. Passenger car is expected to account for the highest market share in the current year. Furthermore, commercial vehicles include all types of CVs such as LCV (light commercial vehicle), MCV (medium commercial vehicle), and HCV (heavy commercial vehicle) however; the electric vehicle adoption in this sector is less as compared to the passenger cars.
Report Metric |
Details |
Historical Period |
2018 - 2023 |
Base Year Considered |
2024 |
Forecast Period |
2025 - 2030 |
Market Size in 2023 |
U.S.D. XX Billion |
Revenue Forecast in 2030 |
U.S.D. 0.64 Billion |
Growth Rate |
34.6% |
Segments Covered in the Report |
By System,By Charging Type,By Vehicle Type |
Report Scope |
Market Trends, Drivers, and Restraints; Revenue Estimation and Forecast; Segmentation Analysis; Impact of COVID-19; Companies’ Strategic Developments; Market Share Analysis of Key Players; Company Profiling |
Regions Covered in the Report |
North America,Europe,Asia-Pacific (APAC),Rest of the World (RoW) |
Industry Dynamics
Industry Trends
The introduction of Vehicle-To-Grid (V2G) technology in electric vehicle charging stations is the major trend in the electric vehicle communication controller market. The V2G technology will enable electric energy to be pushed back to the grid from the battery of an electric vehicle and will as a result help in energy saving.
Growth Drivers
Electric vehicle adoption has grown rapidly across the globe over the past decade, with more than five million electric passenger cars sold globally in the year 2018. Europe, China, and the US are major contributors to the market, with China accounting for approximately 45% of the electric vehicle count in 2018. Followed by Europe and US, accounting for close to 24% and 22% respectively. Further, this has boosted the EV charging station growth as well. The total number of charging points active globally in 2018 was projected to be around 5.2 million, growing around 45% year on year. Further, the upsurge was mostly seen in the private charging points. This as a result will impact the electric vehicle communication controller progression in the market.
Challenges
The absence of standardization in charging infrastructure and diverse government policies and market framework towards carbon emission and fuel consumption may obstructs the growth of the electric vehicle communication controller market.
Geographic Overview
Geographically, APAC, mainly China is the largest electric vehicle communication controller market in the region, owing to the largest (around 2.3 million) electric vehicle running on the road. In addition, the region also accounts for noteworthy investment in battery manufacturing, this will further surge the growth of the China electric vehicle communication controller market in years to come.
Further, the US and Europe hold the second and third largest electric vehicle communication controller market share respectively, due to the growing electric vehicle adoption, and the increasing deployment of charging stations. In addition, some of the other developing nations in APAC and Europe are also rapidly deploying electric vehicles, this as a result is also creating a positive impact on the electric vehicle communication controller market growth in the region.
Competitive Insight
Key players in the electric vehicle communication controller market include automotive OEMs who are making huge investments in the development of new charging technologies and penetration in developing nations. Further, merger & acquisition, collaboration, and new product developments are other key strategies adopted by the vehicle OEMs. For instance, in May 2017, Tesla acquired Grohmann Engineering, a Germany-based engineering firm for approximately US$ 150 million to expand their auto-making expertise.
Some of the key players operating in the electric vehicle communication controller market are Tesla, Inc., LG Innotek, BYD Auto, Schneider Electric, ABB Ltd., Robert Bosch GmbH, Ficosa International S.A., Mitsubishi Electric, Siemens AG, and Vector.
Primary Research
VynZ Research conducts extensive primary research to understand the market dynamics, validate market data and have key opinions from the industry experts. The key profiles approached within the industry include, CEO, CFO, CTO, President, Vice President, Product Managers, Regional Heads, and Others. Also, end user surveys comprising of consumers are also conducted to understand consumer behavior.
The Electric Vehicle Communication Controller Market report offers a comprehensive market segmentation analysis and estimates for the forecast period 2025–2030.
Segments Covered in the Report
Geographical Segmentation
Source: VynZ Research
1. Research Overview
1.1. The Report Offers
1.2. Market Coverage
1.2.1. By System
1.2.2. By Charging Type
1.2.3. By Electric Vehicle Type
1.2.4. By Vehicle Type
1.2.5. By Region
1.3. Research Phases
1.4. Limitations
1.5. Research Methodology
1.5.1. Data Sources
1.5.1.1. Primary Research
1.5.1.2. Secondary Research
1.5.2. Methodology
1.5.2.1. Data Exploration
1.5.2.2. Forecast Parameters
1.5.2.3. Data Validation
1.5.2.4. Assumptions
1.5.3. Study Period & Data Reporting Unit
2. Executive Summary
3. Industry Overview
3.1. Industry Dynamics
3.1.1. Market Growth Drivers
3.1.2. Market Restraints
3.1.3. Key Market Trends
3.1.4. Major Opportunities
3.2. Industry Ecosystem
3.2.1. Porter’s Five Forces Analysis
3.2.2. Recent Development Analysis
3.2.3. Value Chain Analysis
3.3. Competitive Insight
3.3.1. Competitive Position of Industry Players
3.3.2. Market Attractive Analysis
3.3.3. Market Share Analysis
4. Global Market Estimate and Forecast
4.1. Global Market Overview
4.2. Global Market Estimate and Forecast to 2030
5. Market Segmentation Estimate and Forecast
5.1. By System
5.1.1. Electric Vehicle Communication Controller (EVCC)
5.1.1.1. Market Definition
5.1.1.2. Market Estimation and Forecast to 2030
5.1.2. Supply Equipment Communication Controller (SECC)
5.1.2.1. Market Definition
5.1.2.2. Market Estimation and Forecast to 2030
5.2. By Charging Type
5.2.1. Plug-In
5.2.1.1. Market Definition
5.2.1.2. Market Estimation and Forecast to 2030
5.2.2. Inductive
5.2.2.1. Market Definition
5.2.2.2. Market Estimation and Forecast to 2030
5.3. By Electric Vehicle Type
5.3.1. Battery Electric Vehicle (BEV)
5.3.1.1. Market Definition
5.3.1.2. Market Estimation and Forecast to 2030
5.3.2. Plug-In Hybrid Electric Vehicle (PHEV)
5.3.2.1. Market Definition
5.3.2.2. Market Estimation and Forecast to 2030
5.4. By Vehicle Type
5.4.1. Passenger Car
5.4.1.1. Market Definition
5.4.1.2. Market Estimation and Forecast to 2030
5.4.2. Commercial Vehicle
5.4.2.1. Market Definition
5.4.2.2. Market Estimation and Forecast to 2030
6. North America Market Estimate and Forecast
6.1. By System
6.2. By Charging Type
6.3. By Electric Vehicle Type
6.4. By Vehicle Type
6.5. By Country
6.5.1. U.S. Market Estimate and Forecast
6.5.2. Canada Market Estimate and Forecast
6.5.3. Mexico Market Estimate and Forecast
7. Europe Market Estimate and Forecast
7.1. By System
7.2. By Charging Type
7.3. By Electric Vehicle Type
7.4. By Vehicle Type
7.5. By Country
7.5.1. Germany Market Estimate and Forecast
7.5.2. France Market Estimate and Forecast
7.5.3. U.K. Market Estimate and Forecast
7.5.4. Norway Market Estimate and Forecast
7.5.5. Spain Market Estimate and Forecast
7.5.6. Denmark Market Estimate and Forecast
7.5.7. Netherlands Market Estimate and Forecast
7.5.8. Austria Market Estimate and Forecast
7.5.9. Switzerland Market Estimate and Forecast
7.5.10. Sweden Market Estimate and Forecast
7.5.11. Rest of Europe Market Estimate and Forecast
8. Asia-Pacific Market Estimate and Forecast
8.1. By System
8.2. By Charging Type
8.3. By Electric Vehicle Type
8.4. By Vehicle Type
8.5. By Country
8.5.1. China Market Estimate and Forecast
8.5.2. Japan Market Estimate and Forecast
8.5.3. India Market Estimate and Forecast
8.5.4. South Korea Market Estimate and Forecast
8.5.5. Rest of Asia-Pacific Market Estimate and Forecast
9. Rest of the World (RoW) Market Estimate and Forecast
9.1. By System
9.2. By Charging Type
9.3. By Electric Vehicle Type
9.4. By Vehicle Type
9.5. By Country
9.5.1. Brazil Market Estimate and Forecast
9.5.2. Saudi Arabia Market Estimate and Forecast
9.5.3. South Africa Market Estimate and Forecast
9.5.4. Other Countries Market Estimate and Forecast
10. Company Profiles
10.1. Tesla, Inc.
10.1.1. Snapshot
10.1.2. Overview
10.1.3. Offerings
10.1.4. Financial Insight
10.1.5. Recent Developments
10.2. LG Innotek
10.2.1. Snapshot
10.2.2. Overview
10.2.3. Offerings
10.2.4. Financial Insight
10.2.5. Recent Developments
10.3. BYD Auto
10.3.1. Snapshot
10.3.2. Overview
10.3.3. Offerings
10.3.4. Financial Insight
10.3.5. Recent Developments
10.4. Schneider Electric
10.4.1. Snapshot
10.4.2. Overview
10.4.3. Offerings
10.4.4. Financial Insight
10.4.5. Recent Developments
10.5. ABB Ltd.
10.5.1. Snapshot
10.5.2. Overview
10.5.3. Offerings
10.5.4. Financial Insight
10.5.5. Recent Developments
10.6. Robert Bosch GmbH
10.6.1. Snapshot
10.6.2. Overview
10.6.3. Offerings
10.6.4. Financial Insight
10.6.5. Recent Developments
10.7. Ficosa International S.A.
10.7.1. Snapshot
10.7.2. Overview
10.7.3. Offerings
10.7.4. Financial Insight
10.7.5. Recent Developments
10.8. Mitsubishi Electric
10.8.1. Snapshot
10.8.2. Overview
10.8.3. Offerings
10.8.4. Financial Insight
10.8.5. Recent Developments
10.9. Vector
10.9.1. Snapshot
10.9.2. Overview
10.9.3. Offerings
10.9.4. Financial Insight
10.9.5. Recent Developments
10.10. Siemens AG
10.10.1. Snapshot
10.10.2. Overview
10.10.3. Offerings
10.10.4. Financial Insight
10.10.5. Recent Developments
11. Appendix
11.1. Exchange Rates
11.2. Abbreviations
Note: Financial insight and recent developments of different companies are subject to availability of information in secondary domain.
List of Tables
Table 1 Sources
Table 2 Study Periods
Table 3 Data Reporting Unit
Table 4 Global EVCC Market Size, by System, 2018 – 2023 (USD Billion)
Table 5 Global EVCC Market Size, by System, 2025 – 2030 (USD Billion)
Table 6 Global EVCC Market Size, by System, 2018 – 2023 (USD Billion)
Table 7 Global EVCC Market Size, by System, 2025 – 2030 (USD Billion)
Table 8 Global EVCC Market Size, by Charging Type, 2018 – 2023 (USD Billion)
Table 9 Global EVCC Market Size, by Charging Type, 2025 – 2030 (USD Billion)
Table 10 Global EVCC Market Size, by Charging Type, 2018 – 2023 (USD Billion)
Table 11 Global EVCC Market Size, by Charging Type, 2025 – 2030 (USD Billion)
Table 12 Global EVCC Market Size, by Electric Vehicle Type, 2018 – 2023 (USD Billion)
Table 13 Global EVCC Market Size, by Electric Vehicle Type, 2025 – 2030 (USD Billion)
Table 14 Global EVCC Market Size, by Electric Vehicle Type, 2018 – 2023 (USD Billion)
Table 15 Global EVCC Market Size, by Electric Vehicle Type, 2025 – 2030 (USD Billion)
Table 16 Global EVCC Market Size, by Vehicle Type, 2018 – 2023 (USD Billion)
Table 17 Global EVCC Market Size, by Vehicle Type, 2025 – 2030 (USD Billion)
Table 18 Global EVCC Market Size, by Vehicle Type, 2018 – 2023 (USD Billion)
Table 19 Global EVCC Market Size, by Vehicle Type, 2025 – 2030 (USD Billion)
Table 20 Global EVCC Market Size, by Region, 2018 – 2023 (USD Billion)
Table 21 Global EVCC Market Size, by Region, 2025 – 2030 (USD Billion)
Table 22 Global EVCC Market Size, by Region, 2018 – 2023 (USD Billion)
Table 23 Global EVCC Market Size, by Region, 2025 – 2030 (USD Billion)
Table 24 North America EVCC Market Size, by System, 2018 – 2023 (USD Billion)
Table 25 North America EVCC Market Size, by System, 2025 – 2030 (USD Billion)
Table 26 North America EVCC Market Size, by System, 2018 – 2023 (USD Billion)
Table 27 North America EVCC Market Size, by System, 2025 – 2030 (USD Billion)
Table 28 North America EVCC Market Size, by Charging Type, 2018 – 2023 (USD Billion)
Table 29 North America EVCC Market Size, by Charging Type, 2025 – 2030 (USD Billion)
Table 30 North America EVCC Market Size, by Charging Type, 2018 – 2023 (USD Billion)
Table 31 North America EVCC Market Size, by Charging Type, 2025 – 2030 (USD Billion)
Table 32 North America EVCC Market Size, by Electric Vehicle Type, 2018 – 2023 (USD Billion)
Table 33 North America EVCC Market Size, by Electric Vehicle Type, 2025 – 2030 (USD Billion)
Table 34 North America EVCC Market Size, by Electric Vehicle Type, 2018 – 2023 (USD Billion)
Table 35 North America EVCC Market Size, by Electric Vehicle Type, 2025 – 2030 (USD Billion)
Table 36 North America EVCC Market Size, by Vehicle Type, 2018 – 2023 (USD Billion)
Table 37 North America EVCC Market Size, by Vehicle Type, 2025 – 2030 (USD Billion)
Table 38 North America EVCC Market Size, by Vehicle Type, 2018 – 2023 (USD Billion)
Table 39 North America EVCC Market Size, by Vehicle Type, 2025 – 2030 (USD Billion)
Table 40 North America EVCC Market Size, by Country, 2018 – 2023 (USD Billion)
Table 41 North America EVCC Market Size, by Country, 2025 – 2030 (USD Billion)
Table 42 North America EVCC Market Size, by Country, 2018 – 2023 (USD Billion)
Table 43 North America EVCC Market Size, by Country, 2025 – 2030 (USD Billion)
Table 44 Europe EVCC Market Size, by System, 2018 – 2023 (USD Billion)
Table 45 Europe EVCC Market Size, by System, 2025 – 2030 (USD Billion)
Table 46 Europe EVCC Market Size, by System, 2018 – 2023 (USD Billion)
Table 47 Europe EVCC Market Size, by System, 2025 – 2030 (USD Billion)
Table 48 Europe EVCC Market Size, by Charging Type, 2018 – 2023 (USD Billion)
Table 49 Europe EVCC Market Size, by Charging Type, 2025 – 2030 (USD Billion)
Table 50 Europe EVCC Market Size, by Charging Type, 2018 – 2023 (USD Billion)
Table 51 Europe EVCC Market Size, by Charging Type, 2025 – 2030 (USD Billion)
Table 52 Europe EVCC Market Size, by Electric Vehicle Type, 2018 – 2023 (USD Billion)
Table 53 Europe EVCC Market Size, by Electric Vehicle Type, 2025 – 2030 (USD Billion)
Table 54 Europe EVCC Market Size, by Electric Vehicle Type, 2018 – 2023 (USD Billion)
Table 55 Europe EVCC Market Size, by Electric Vehicle Type, 2025 – 2030 (USD Billion)
Table 56 Europe EVCC Market Size, by Vehicle Type, 2018 – 2023 (USD Billion)
Table 57 Europe EVCC Market Size, by Vehicle Type, 2025 – 2030 (USD Billion)
Table 58 Europe EVCC Market Size, by Vehicle Type, 2018 – 2023 (USD Billion)
Table 59 Europe EVCC Market Size, by Vehicle Type, 2025 – 2030 (USD Billion)
Table 60 Europe EVCC Market Size, by Country, 2018 – 2023 (USD Billion)
Table 61 Europe EVCC Market Size, by Country, 2025 – 2030 (USD Billion)
Table 62 Europe EVCC Market Size, by Country, 2018 – 2023 (USD Billion)
Table 63 Europe EVCC Market Size, by Country, 2025 – 2030 (USD Billion)
Table 64 Asia-Pacific EVCC Market Size, by System, 2018 – 2023 (USD Billion)
Table 65 Asia-Pacific EVCC Market Size, by System, 2025 – 2030 (USD Billion)
Table 66 Asia-Pacific EVCC Market Size, by System, 2018 – 2023 (USD Billion)
Table 67 Asia-Pacific EVCC Market Size, by System, 2025 – 2030 (USD Billion)
Table 68 Asia-Pacific EVCC Market Size, by Charging Type, 2018 – 2023 (USD Billion)
Table 69 Asia-Pacific EVCC Market Size, by Charging Type, 2025 – 2030 (USD Billion)
Table 70 Asia-Pacific EVCC Market Size, by Charging Type, 2018 – 2023 (USD Billion)
Table 71 Asia-Pacific EVCC Market Size, by Charging Type, 2025 – 2030 (USD Billion)
Table 72 Asia-Pacific EVCC Market Size, by Electric Vehicle Type, 2018 – 2023 (USD Billion)
Table 73 Asia-Pacific EVCC Market Size, by Electric Vehicle Type, 2025 – 2030 (USD Billion)
Table 74 Asia-Pacific EVCC Market Size, by Electric Vehicle Type, 2018 – 2023 (USD Billion)
Table 75 Asia-Pacific EVCC Market Size, by Electric Vehicle Type, 2025 – 2030 (USD Billion)
Table 76 Asia-Pacific EVCC Market Size, by Vehicle Type, 2018 – 2023 (USD Billion)
Table 77 Asia-Pacific EVCC Market Size, by Vehicle Type, 2025 – 2030 (USD Billion)
Table 78 Asia-Pacific EVCC Market Size, by Vehicle Type, 2018 – 2023 (USD Billion)
Table 79 Asia-Pacific EVCC Market Size, by Vehicle Type, 2025 – 2030 (USD Billion)
Table 80 Asia-Pacific EVCC Market Size, by Country, 2018 – 2023 (USD Billion)
Table 81 Asia-Pacific EVCC Market Size, by Country, 2025 – 2030 (USD Billion)
Table 82 Asia-Pacific EVCC Market Size, by Country, 2018 – 2023 (USD Billion)
Table 83 Asia-Pacific EVCC Market Size, by Country, 2025 – 2030 (USD Billion)
Table 84 RoW EVCC Market Size, by System, 2018 – 2023 (USD Billion)
Table 85 RoW EVCC Market Size, by System, 2025 – 2030 (USD Billion)
Table 86 RoW EVCC Market Size, by System, 2018 – 2023 (USD Billion)
Table 87 RoW EVCC Market Size, by System, 2025 – 2030 (USD Billion)
Table 88 RoW EVCC Market Size, by Charging Type, 2018 – 2023 (USD Billion)
Table 89 RoW EVCC Market Size, by Charging Type, 2025 – 2030 (USD Billion)
Table 90 RoW EVCC Market Size, by Charging Type, 2018 – 2023 (USD Billion)
Table 91 RoW EVCC Market Size, by Charging Type, 2025 – 2030 (USD Billion)
Table 92 RoW EVCC Market Size, by Electric Vehicle Type, 2018 – 2023 (USD Billion)
Table 93 RoW EVCC Market Size, by Electric Vehicle Type, 2025 – 2030 (USD Billion)
Table 94 RoW EVCC Market Size, by Electric Vehicle Type, 2018 – 2023 (USD Billion)
Table 95 RoW EVCC Market Size, by Electric Vehicle Type, 2025 – 2030 (USD Billion)
Table 96 RoW EVCC Market Size, by Vehicle Type, 2018 – 2023 (USD Billion)
Table 97 RoW EVCC Market Size, by Vehicle Type, 2025 – 2030 (USD Billion)
Table 98 RoW EVCC Market Size, by Vehicle Type, 2018 – 2023 (USD Billion)
Table 99 RoW EVCC Market Size, by Vehicle Type, 2025 – 2030 (USD Billion)
Table 100 RoW EVCC Market Size, by Country, 2018 – 2023 (USD Billion)
Table 101 RoW EVCC Market Size, by Country, 2025 – 2030 (USD Billion)
Table 102 RoW EVCC Market Size, by Country, 2018 – 2023 (USD Billion)
Table 103 RoW EVCC Market Size, by Country, 2025 – 2030 (USD Billion)
Table 104 Snapshot – Tesla, Inc.
Table 105 Snapshot – LG Innotek
Table 106 Snapshot – BYD Auto
Table 107 Snapshot – Schneider Electric
Table 108 Snapshot – ABB Ltd.
Table 109 Snapshot – Robert Bosch GmbH
Table 110 Snapshot – Ficosa International S.A.
Table 111 Snapshot – Mitsubishi Electric
Table 112 Snapshot – Vector
Table 113 Snapshot – Siemens AG
List of Figures
Figure 1 Market Coverage
Figure 2 Research Phases
Figure 3 Secondary Systems for Different Parameters
Figure 4 Methodology
Figure 5 Data Mining & Exploration
Figure 6 Data Triangulation
Figure 7 Assumptions for Market Estimation and Forecast
Figure 8 Market Synopsis
Figure 9 Global EVCC Market - Growth Drivers and Restraints
Figure 10 Competitive Benchmark
Figure 11 Global EVCC Market Highlight
Figure 12 Global EVCC Market Size, by System, 2018 - 2030 (USD Billion)
Figure 13 Global EVCC Market Size, by Charging Type, 2018 - 2030 (USD Billion)
Figure 14 Global EVCC Market Size, by Electric Vehicle Type, 2018 - 2030 (USD Billion)
Figure 15 Global EVCC Market Size, by Vehicle Type, 2018 - 2030 (USD Billion)
Figure 16 Global EVCC Market Size, by Region, 2018 - 2030 (USD Billion)
Figure 17 North America EVCC Market Highlight
Figure 18 North America EVCC Market Size, by System, 2018 - 2030 (USD Billion)
Figure 19 North America EVCC Market Size, by Charging Type, 2018 - 2030 (USD Billion)
Figure 20 North America EVCC Market Size, by Electric Vehicle Type, 2018 - 2030 (USD Billion)
Figure 21 North America EVCC Market Size, by Vehicle Type, 2018 - 2030 (USD Billion)
Figure 22 North America EVCC Market Size, by Country, 2018 - 2030 (USD Billion)
Figure 23 Europe EVCC Market Highlight
Figure 24 Europe EVCC Market Size, by System, 2018 - 2030 (USD Billion)
Figure 25 Europe EVCC Market Size, by Charging Type, 2018 - 2030 (USD Billion)
Figure 26 Europe EVCC Market Size, by Electric Vehicle Type, 2018 - 2030 (USD Billion)
Figure 27 Europe EVCC Market Size, by Vehicle Type, 2018 - 2030 (USD Billion)
Figure 28 Europe EVCC Market Size, by Country, 2018 - 2030 (USD Billion)
Figure 29 Asia-Pacific EVCC Market Highlight
Figure 30 Asia-Pacific EVCC Market Size, by System, 2018 - 2030 (USD Billion)
Figure 31 Asia-Pacific EVCC Market Size, by Charging Type, 2018 - 2030 (USD Billion)
Figure 32 Asia-Pacific EVCC Market Size, by Electric Vehicle Type, 2018 - 2030 (USD Billion)
Figure 33 Asia-Pacific EVCC Market Size, by Vehicle Type, 2018 - 2030 (USD Billion)
Figure 34 Asia-Pacific EVCC Market Size, by Country, 2018 - 2030 (USD Billion)
Figure 35 RoW EVCC Market Highlight
Figure 36 RoW EVCC Market Size, by System, 2018 - 2030 (USD Billion)
Figure 37 RoW EVCC Market Size, by Charging Type, 2018 - 2030 (USD Billion)
Figure 38 RoW EVCC Market Size, by Electric Vehicle Type, 2018 - 2030 (USD Billion)
Figure 39 RoW EVCC Market Size, by Vehicle Type, 2018 - 2030 (USD Billion)
Figure 40 RoW EVCC Market Size, by Country, 2018 - 2030 (USD Billion)
Global Electric Vehicle Communication Controller Market Coverage
System Insight and Forecast 2025-2030
Charging Type Insight and Forecast 2025-2030
Electric Vehicle Type Insight and Forecast 2025-2030
Vehicle Type Insight and Forecast 2025-2030
Geographical Segmentation
Electric Vehicle Communication Controller Market by Region
North America
Europe
Asia-Pacific (APAC)
Rest of the World (RoW)
Vynz Research know in your business needs, you required specific answers pertaining to the market, Hence, our experts and analyst can provide you the customized research support on your specific needs.
After the purchase of current report, you can claim certain degree of free customization within the scope of the research.
Please let us know, how we can serve you better with your specific requirements to your research needs. Vynz research promises for quick reversal for your current business requirements.
Electric Vehicle Communication Controller Market