Status : Published | Published On : Dec, 2023 | Report Code : VREP3017 | Industry : Energy & Power | Available Format :
![]() |
Page : 177 |
The Global Energy Storage System Market size is expected to grow to USD 440.5 billion by 2030 from USD 205.5 billion in 2023. It will register a CAGR of 9% during the forecast period 2025-2030.
The energy storage system is a device designed to store energy in several forms such as mechanical and electrochemical, enabling its flexible application as needed. These systems find applications in meeting high power demands and unexpected spikes in power requirements. Integrating energy storage systems into innovative power networks is essential.
The global energy storage system market segments include electrochemical, thermal storage, mechanical energy storage, and others. Mechanical energy storage, notably the pumped hydro storage segment, is expected to dominate due to its significant capacity, cost-effectiveness, and efficiency.
The market is also divided into grid storage and transportation, with transportation expected to grow rapidly due to the increasing adoption of battery-powered Electric Vehicles (EVs). End users like residential, non-residential, and utilities also divides the market with the non-residential sectors leading due to higher adoption.
The global energy storage system market is categorized into electro chemical, thermal storage, mechanical energy storage, and other segments, based on technology. the electro chemical segment is further subdivided into lithium-ion battery, lead acid battery, sodium sulfur (NAS) battery, flow battery, and other subsections. Mechanical energy storage is further segmented into pumped hydro storage, compressed air and liquid energy storage, and flywheel energy storage.
Out of these segments, the mechanical energy storage segment is expected to dominate the market share in the forecast period. This is mainly attributed to the substantial storage capacity, economic viability, and ability to leverage natural resources efficiently of these systems.
Pumped hydro storage, specifically, holds a prominent position due to the large number of storage systems using water reservoirs, higher demand for power generation, and helpful government initiatives toward renewable energy generation.
Categorized by application, the global energy storage system market is divided into grid storage and transportation. Out of these two segments, the transportation segment is expected to experience a higher growth rate in the forecast period. This is mainly driven by the growing adoption of battery-powered Electric Vehicles (EVs). This trend not only aids in curbing vehicle emissions but also contributes to the expansion of railway networks.
The global energy storage system market is divided into residential, non-residential, and utilities segments based on the ned users. Out of these segments, the non-residential category encompasses commercial and industrial sectors.
The non-residential segment is anticipated to lead the market share, driven by the strong growth of industries such as sugar mills, chemical plants, automobile plants, paper mills, etc. Meanwhile, the residential sector is expected to experience substantial growth during the forecast period due to growing adoption of solar panels for lowering cost of electricity and managing power outages.
The growing adoption of renewable energy sources such as solar and wind power is driving the need for energy storage systems.
Continual development in battery technology, particularly in lithium-ion batteries, is leading to improved energy density, longer lifetimes, and reduced costs, making energy storage systems more efficient and accessible.
The growth of electric vehicles (EVs) is boosting the demand for energy storage systems to support charging infrastructure development and grid integration.
Governments and utilities worldwide are investing in grid modernization initiatives, including smart grids and microgrids.
Growing frequency and severity of grid disruptions and natural disasters are driving the adoption of energy storage systems for greater resilience.
The integration of multiple energy storage technologies, such as combining lithium-ion batteries with flywheel or pumped hydro storage, is gaining traction to enhance performance, flexibility, and applicability.
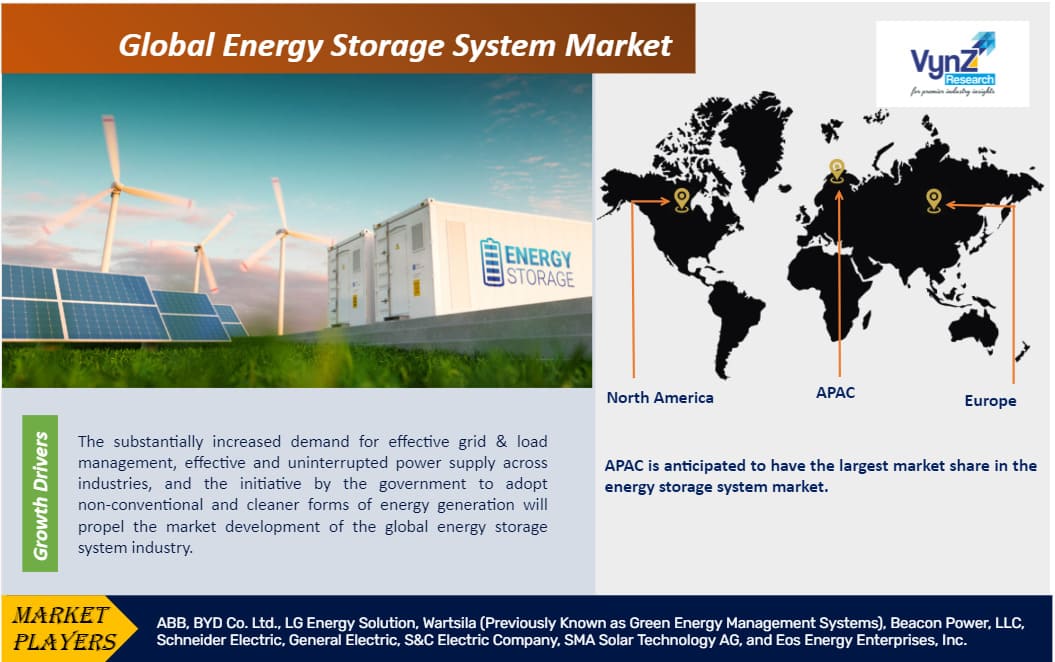
The growth in demand for efficient grid and load management, as well as the consistent need for reliable power supply across various industries, along with governmental initiatives promoting cleaner energy generation, will drive the growth of the global energy storage system industry.
Moreover, growing concerns about environmental protection and carbon emissions along with development of sustainable energy sources have further propelled market expansion.
Also, the increasing imperative to reduce vehicular pollution has prompted a shift towards less polluting vehicles like electric cars, buses, and trucks. This has consequently boosted sales of energy storage systems.
All these combined factors have contributed to the expansion of the energy storage system market worldwide.
The growth of the energy storage system market is likely to be hindered by the large capital investment required and growing environmental pollution concerns. Furthermore, hindrance to the market expansion is expected due to an imbalance between the supply and demand of raw materials.
Rising investment in power infrastructure networks, modernization, and grid expansion, along with rapid development in the Electric Vehicle sector are creating new opportunities for growth of the global energy storage system market.
The Asia Pacific region is poised to grow and lead the energy storage system market, driven by increased engineering projects in countries like India, Japan, and China, alongside growing adoption of smart grids. Additionally, rising electric vehicle sales and stringent pollution regulations further propel market growth. Key drivers include investments in rural electrification, government initiatives promoting sustainable energy, and incentives for corporate adoption of renewables.
North American market is led by the US and Canada and is expected to grow due to renewable energy integration, grid modernization, and government incentives. The European market is led by Germany, the UK, France, and Italy and is expected to grow due to the EU's Clean Energy package to promote renewable integration and grid stability.
Recent years have seen a global trend of project contracting, installation, and commissioning in the energy storage business. To stay ahead of their rivals, industry participants have recently started some projects focusing on cutting-edge technology, and product development, and formed collaborations with stakeholders. They are emphasizing enhancing the distribution network, focusing on R&D activities, and handling working capital requirements effectively to flourish in the global energy storage system market.
ABB has a fully digitalized energy storage portfolio that improves grid efficiency at every level. It offers factory-built, pre-tested solutions that can attain extensive quality control and provide a high level of safety. ABB solutions can be deployed directly to the customer site, resulting in faster installation, shorter project execution time, and higher customer savings. Their energy storage offerings include E-mobility, Renewables, Distribution Utility, and Commercial and industrial.
GE is well known throughout the world for creating and providing specialized energy storage solutions for a range of applications. A versatile, portable energy storage option for AC or DC coupled systems is GE's Reservoir. The Reservoir solution integrates GE's cutting-edge technology and expertise in an electrical balance of plant, power electronics, battery management systems, and plant controls, all of which are supported by performance guarantees. By 2030, GE hopes to invest $103 billion in energy storage projects.
Some of the major players operating in the global energy storage system industry include ABB, BYD Co. Ltd., LG Energy Solution, Wartsila (Previously Known as Green Energy Management Systems), Beacon Power, LLC, Schneider Electric, General Electric, S&C Electric Company, SMA Solar Technology AG, and Eos Energy Enterprises, Inc.
Schneider Electric (French multinational energy management company) has launched two new battery energy storage systems with enclosures of 2.1 metres and 6.06 metres. Their power ranges from 60 kW to 500 kW. It is available in two enclosure sizes and has different storage and discharge configurations.
Grenergy Renovables SA (Spanish renewables company) has collaborated with China’s BYD Co Ltd. to procure the first batch of batteries for its colossal USD-1.4-billion (USD 1.28bn) Oasis de Atacama solar-plus-storage project in Chile. Oasis de Atacama is hailed by Grenergy as the world’s largest storage project, with a planned total capacity of 4.1 GWh of batteries and 1 GW of solar.
The Energy Storage System Market report offers a comprehensive market segmentation analysis along with an estimation for the forecast period 2025–2030.
Segments Covered in the Report
Region Covered in the Report
Source: VynZ Research
1. Research Overview
1.1. The Report Offers
1.2. Market Coverage
1.2.1. By Technology
1.2.2. By Application
1.2.3. By End-User
1.2.4. By Region
1.3. Research Phases
1.4. Limitations
1.5. Market Methodology
1.5.1. Data Sources
1.5.1.1. Primary Research
1.5.1.2. Secondary Research
1.5.2. Methodology
1.5.2.1. Data Exploration
1.5.2.2. Forecast Parameters
1.5.2.3. Data Validation
1.5.2.4. Assumptions
1.5.3. Study Period & Data Reporting Unit
2. Executive Summary
3. Industry Overview
3.1. Industry Dynamics
3.1.1. Market Growth Drivers
3.1.2. Market Restraints
3.1.3. Key Market Trends
3.1.4. Major Opportunities
3.2. Industry Ecosystem
3.2.1. Porter’s Five Forces Analysis
3.2.2. Recent Development Analysis
3.2.3. Value Chain Analysis
3.3. Competitive Insight
3.3.1. Competitive Position of Industry Players
3.3.2. Market Attractive Analysis
3.3.3. Market Share Analysis
4. Global Market Estimate and Forecast
4.1. Global Market Overview
4.2. Global Market Estimate and Forecast to 2030
5. Market Segmentation Estimate and Forecast
5.1. By Technology
5.1.1. Electro Chemical
5.1.1.1. Market Definition
5.1.1.2. Market Estimation and Forecast to 2030
5.1.1.2.1. Lithium-Ion Battery
5.1.1.2.2. Lead Acid Battery
5.1.1.2.3. Sodium Sulfur (NAS) Battery
5.1.1.2.4. Flow Battery
5.1.1.2.5. Others
5.1.2. Thermal Storage
5.1.1.1. Market Definition
5.1.1.2. Market Estimation and Forecast to 2030
5.1.3. Mechanical Energy Storage
5.1.3.1. Market Definition
5.1.3.2. Market Estimation and Forecast to 2030
5.1.3.2.1. Pumped Hydro Storage
5.1.3.2.2. Compressed Air & Liquid Energy Storage
5.1.3.2.3. Flywheel Energy Storage
5.1.3.2.4. Others
5.2. By Application
5.2.1. Grid Storage
5.2.1.1. Market Definition
5.2.1.2. Market Estimation and Forecast to 2030
5.2.2. Transportation Storage
5.2.2.1. Market Definition
5.2.2.2. Market Estimation and Forecast to 2030
5.3. By End User
5.3.1. Residential
5.3.1.1. Market Definition
5.3.1.2. Market Estimation and Forecast to 2030
5.3.2. Non-Residential
5.3.2.1. Market Definition
5.3.2.2. Market Estimation and Forecast to 2030
5.3.3. Utilities
5.3.3.1. Market Definition
5.3.3.2. Market Estimation and Forecast to 2030
6. North America Market Estimate and Forecast
6.1. By Technology
6.2. By Application
6.3. By End User
6.4. By Country
6.4.1. U.S. Market Estimate and Forecast
6.4.2. Canada Market Estimate and Forecast
6.4.3. Mexico Market Estimate and Forecast
7. Europe Market Estimate and Forecast
7.1. By Technology
7.2. By Application
7.3. By End User
7.4. By Country
7.4.1. Germany Market Estimate and Forecast
7.4.2. France Market Estimate and Forecast
7.4.3. U.K. Market Estimate and Forecast
7.4.4. Italy Market Estimate and Forecast
7.4.5. Spain Market Estimate and Forecast
7.4.6. Rest of Europe Market Estimate and Forecast
8. Asia-Pacific Market Estimate and Forecast
8.1. By Technology
8.2. By Application
8.3. By End User
8.4. By Country
8.4.1. China Market Estimate and Forecast
8.4.2. Japan Market Estimate and Forecast
8.4.3. India Market Estimate and Forecast
8.4.4. South Korea Market Estimate and Forecast
8.4.5. Singapore Market Estimate and Forecast
8.4.6. Rest of Asia-Pacific Market Estimate and Forecast
9. Rest of the World (RoW) Market Estimate and Forecast
9.1. By Technology
9.2. By Application
9.3. By End User
9.4. By Country
9.4.1. Brazil Market Estimate and Forecast
9.4.2. Saudi Arabia Market Estimate and Forecast
9.4.3. South Africa Market Estimate and Forecast
9.4.4. Other Countries Market Estimate and Forecast
10. Company Profiles
10.1. ABB
10.1.1. Snapshot
10.1.2. Overview
10.1.3. Offerings
10.1.4. Financial Insight
10.1.5. Recent Developments
10.2. BYD Co. Ltd
10.2.1. Snapshot
10.2.2. Overview
10.2.3. Offerings
10.2.4. Financial Insight
10.2.5. Recent Developments
10.3. LG Energy Solution
10.3.1. Snapshot
10.3.2. Overview
10.3.3. Offerings
10.3.4. Financial Insight
10.3.5. Recent Developments
10.4. Wartsila
10.4.1. Snapshot
10.4.2. Overview
10.4.3. Offerings
10.4.4. Financial Insight
10.4.5. Recent Developments
10.5. Beacon Power
10.5.1. Snapshot
10.5.2. Overview
10.5.3. Offerings
10.5.4. Financial Insight
10.5.5. Recent Developments
10.6. LLC
10.6.1. Snapshot
10.6.2. Overview
10.6.3. Offerings
10.6.4. Financial Insight
10.6.5. Recent Developments
10.7. Schneider Electric
10.7.1. Snapshot
10.7.2. Overview
10.7.3. Offerings
10.7.4. Financial Insight
10.7.5. Recent Developments
10.8. General Electric
10.8.1. Snapshot
10.8.2. Overview
10.8.3. Offerings
10.8.4. Financial Insight
10.8.5. Recent Developments
10.9. S&C Electric Company
10.9.1. Snapshot
10.9.2. Overview
10.9.3. Offerings
10.9.4. Financial Insight
10.9.5. Recent Developments
10.10. SMA Solar Technology AG
10.10.1. Snapshot
10.10.2. Overview
10.10.3. Offerings
10.10.4. Financial Insight
10.10.5. Recent Developments
10.11. Eos Energy Enterprises, Inc.
10.11.1. Snapshot
10.11.2. Overview
10.11.3. Offerings
10.11.4. Financial Insight
10.11.5. Recent Developments
11. Appendix
11.1. Exchange Rates
11.2. Abbreviations
Note: Financial insight and recent developments of different companies are subject to the availability of information in the secondary domain.
List of Tables
Table 1 Sources
Table 2 Study Periods
Table 3 Data Reporting Unit
Table 4 Global Energy Storage System Market Size, By Technology, 2018-2023 (USD Billion)
Table 5 Global Energy Storage System Market Size, By Technology, 2025-2030 (USD Billion)
Table 6 Global Energy Storage System Market Size, By Application, 2018-2023 (USD Billion)
Table 7 Global Energy Storage System Market Size, By Application, 2025-2030 (USD Billion)
Table 8 Global Energy Storage System Market Size, By End User, 2018-2023 (USD Billion)
Table 9 Global Energy Storage System Market Size, By End User, 2025-2030 (USD Billion)
Table 10 Global Energy Storage System Market Size, by Region, 2018-2023 (USD Billion)
Table 11 Global Energy Storage System Market Size, by Region, 2025-2030 (USD Billion)
Table 12 North America Energy Storage System Market Size, By Technology, 2018-2023 (USD Billion)
Table 13 North America Energy Storage System Market Size, By Technology, 2025-2030 (USD Billion)
Table 14 North America Energy Storage System Market Size, By Application, 2018-2023 (USD Billion)
Table 15 North America Energy Storage System Market Size, By Application, 2025-2030 (USD Billion)
Table 16 North America Energy Storage System Market Size, By End User, 2018-2023 (USD Billion)
Table 17 North America Energy Storage System Market Size, By End User, 2025-2030 (USD Billion)
Table 18 North America Energy Storage System Market Size, by Region, 2018-2023 (USD Billion)
Table 19 North America Energy Storage System Market Size, by Region, 2025-2030 (USD Billion)
Table 20 Europe Energy Storage System Market Size, By Technology, 2018-2023 (USD Billion)
Table 21 Europe Energy Storage System Market Size, By Technology, 2025-2030 (USD Billion)
Table 22 Europe Energy Storage System Market Size, By Application, 2018-2023 (USD Billion)
Table 23 Europe Energy Storage System Market Size, By Application, 2025-2030 (USD Billion)
Table 24 Europe Energy Storage System Market Size, By End User, 2018-2023 (USD Billion)
Table 25 Europe Energy Storage System Market Size, By End User, 2025-2030 (USD Billion)
Table 26 Europe Energy Storage System Market Size, by Region, 2018-2023 (USD Billion)
Table 27 Europe Energy Storage System Market Size, by Region, 2025-2030 (USD Billion)
Table 28 Asia-Pacific Energy Storage System Market Size, By Technology, 2018-2023 (USD Billion)
Table 29 Asia-Pacific Energy Storage System Market Size, By Technology, 2025-2030 (USD Billion)
Table 30 Asia-Pacific Energy Storage System Market Size, By Application, 2018-2023 (USD Billion)
Table 31 Asia-Pacific Energy Storage System Market Size, By Application, 2025-2030 (USD Billion)
Table 32 Asia-Pacific Energy Storage System Market Size, By End User, 2018-2023 (USD Billion)
Table 33 Asia-Pacific Energy Storage System Market Size, By End User, 2025-2030 (USD Billion)
Table 34 Asia-Pacific Energy Storage System Market Size, by Region, 2018-2023 (USD Billion)
Table 35 Asia-Pacific Energy Storage System Market Size, by Region, 2025-2030 (USD Billion)
Table 36 RoW Energy Storage System Market Size, By Technology, 2018-2023 (USD Billion)
Table 37 RoW Energy Storage System Market Size, By Technology, 2025-2030 (USD Billion)
Table 38 RoW Energy Storage System Market Size, By Application, 2018-2023 (USD Billion)
Table 39 RoW Energy Storage System Market Size, By Application, 2025-2030 (USD Billion)
Table 40 RoW Energy Storage System Market Size, By End User, 2018-2023 (USD Billion)
Table 41 RoW Energy Storage System Market Size, By End User, 2025-2030 (USD Billion)
Table 42 RoW Energy Storage System Market Size, by Region, 2018-2023 (USD Billion)
Table 43 RoW Energy Storage System Market Size, by Region, 2025-2030 (USD Billion)
Table 44 Snapshot – ABB
Table 45 Snapshot – BYD Co. Ltd
Table 46 Snapshot – LG Energy Solution
Table 47 Snapshot – Wartsila
Table 48 Snapshot – Beacon Power
Table 49 Snapshot – LLC
Table 50 Snapshot – Schneider Electric
Table 51 Snapshot – General Electric
Table 52 Snapshot – S&C Electric Company
Table 53 Snapshot – SMA Solar Technology AG
Table 54 Snapshot – Eos Energy Enterprises, Inc.
List of Figures
Figure 1 Market Coverage
Figure 2 Research Phases
Figure 3 Secondary Sources for Different Parameters
Figure 4 Methodology
Figure 5 Data Mining & Exploration
Figure 6 Data Triangulation
Figure 7 Assumptions for Market Estimation and Forecast
Figure 8 Market Synopsis
Figure 9 Global Energy Storage System Market - Growth Drivers and Restraints
Figure 10 Competitive Benchmark
Figure 11 Global Energy Storage System Market Highlight
Figure 12 Global Energy Storage System Market Size, By Technology,2018 - 2030 (USD Billion)
Figure 13 Global Energy Storage System Market Size, By Application,2018 - 2030 (USD Billion)
Figure 14 Global Energy Storage System Market Size, By End User,2018 - 2030 (USD Billion)
Figure 15 Global Energy Storage System Market Size, by Region,2018 - 2030 (USD Billion)
Figure 16 North America Energy Storage System Market Highlight
Figure 17 North America Energy Storage System Market Size, By Technology,2018 - 2030 (USD Billion)
Figure 18 North America Energy Storage System Market Size, By Application,2018 - 2030 (USD Billion)
Figure 19 North America Energy Storage System Market Size, By End User,2018 - 2030 (USD Billion)
Figure 20 North America Energy Storage System Market Size, by Region,2018 - 2030 (USD Billion)
Figure 21 Europe Energy Storage System Market Highlight
Figure 22 Europe Energy Storage System Market Size, By Technology,2018 - 2030 (USD Billion)
Figure 23 Europe Energy Storage System Market Size, By Application,2018 - 2030 (USD Billion)
Figure 24 Europe Energy Storage System Market Size, By End User,2018 - 2030 (USD Billion)
Figure 25 Europe Energy Storage System Market Size, by Region,2018 - 2030 (USD Billion)
Figure 26 Asia-Pacific Energy Storage System Market Highlight
Figure 27 Asia-Pacific Energy Storage System Market Size, By Technology,2018 - 2030 (USD Billion)
Figure 28 Asia-Pacific Energy Storage System Market Size, By Application,2018 - 2030 (USD Billion)
Figure 29 Asia-Pacific Energy Storage System Market Size, By End User,2018 - 2030 (USD Billion)
Figure 30 Asia-Pacific Energy Storage System Market Size, by Region,2018 - 2030 (USD Billion)
Figure 31 RoW Energy Storage System Market Highlight
Figure 32 RoW Energy Storage System Market Size, By Technology,2018 - 2030 (USD Billion)
Figure 33 RoW Energy Storage System Market Size, By Application,2018 - 2030 (USD Billion)
Figure 34 RoW Energy Storage System Market Size, By End User,2018 - 2030 (USD Billion)
Figure 35 RoW Energy Storage System Market Size, by Region,2018 - 2030 (USD Billion)
Global Energy Storage System Market Coverage
Technology Insight and Forecast 2025-2030
Application Insight and Forecast 2025-2030
End User Insight and Forecast 2025-2030
Geographical Segmentation
Energy Storage System Market by Region
North America
Europe
Asia-Pacific (APAC)
Rest of the World (RoW)
Vynz Research know in your business needs, you required specific answers pertaining to the market, Hence, our experts and analyst can provide you the customized research support on your specific needs.
After the purchase of current report, you can claim certain degree of free customization within the scope of the research.
Please let us know, how we can serve you better with your specific requirements to your research needs. Vynz research promises for quick reversal for your current business requirements.
Purchase Options
Latest Report
Research Methodology
Connect With Our Sales Team
Energy Storage System Market