Status : Published | Published On : Apr, 2024 | Report Code : VREP3037 | Industry : Energy & Power | Available Format :
![]() |
Page : 204 |
The Global Gas Turbines Market is anticipated to grow from USD 20.2 billion in 2023 to USD 27.5 billion in 2030 at a CAGR of 3.9% during the forecast period from 2025 to 2030.
The gas turbine is the internal - combustion engine at the core of Gas Turbine Combined Cycle (GTCC) power plants. Increasing energy demand is the major driver for the growth of the gas turbines market. Efficient and reliable power generation solutions are necessary which is fueled by rapid industrialization and urbanization. Due to the quick startup capabilities and remarkable fuel efficiency, turbines emerged as a preferred choice. The energy demand continues to rise, due to the expansion of cities and industries making the turbines as a crucial player in meeting the evolving energy requirements around the world. Furthermore, the growing electrification of various sectors are contributing factors to the rising demand for robust energy solutions.
The market is segregated by design type such as heavy duty and aeroderivative segment, where heavy duty dominates the market, and by technology like open and combined cycle which shall grow due to its efficiency. It is also divided by rated capacity where above 300 segment shall grow more than the others. Power generation, oil and gas and mobility are the segments divided based on the applications, where power generation dominates the market.
Based on design type, the Gas Turbines Market is segmented into heavy duty and aero-derivative. The heavy duty type emerged as the largest segment as these gas turbines are robust, large-scale machines designed for high-power applications, such as utility and industrial power plants. They are durable, have extended operational life and ability to handle continuous, base-load power generation.
The gas turbines market is bifurcated into open cycle and combined cycle on the basis of technology. Combined cycle gas turbine accounts for the majority of the market share as it integrates both gas and steam turbines which helps in optimizing energy efficiency by utilizing the waste heat from the gas turbine to produce additional electricity through the steam turbine.
The gas turbine market segmentation based on rated capacity includes 1-40 MW, 40-120 MW, 120-300 MW and above 300 MW. Among these segments, above 300 MW leads the market as these turbines are substantial powerhouses used in large-scale, utility-grade power plants. These turbines are of high output and efficiency
Based on end-user, the gas turbines market is segmented into power generation, oil and gas, mobility and others. Power generation represents the leading market segment as it plays an important role in the applications, from large utility-scale power plants to distributed energy systems. The "Mobility" segment also represents a diverse range of applications where gas turbines contribute to propulsion systems.
Report Metric |
Details |
Historical Period |
2020 - 2024 |
Base Year Considered |
2025 |
Forecast Period |
2026 - 2035 |
Market Size in 2025 |
U.S.D. 20.2 Billion |
Revenue Forecast in 2035 |
U.S.D. 27.5 Billion |
Growth Rate |
3.9% |
Segments Covered in the Report |
By Design Type, By Technology, By Rated Capacity, By End-User |
Report Scope |
Market Trends, Drivers, and Restraints; Revenue Estimation and Forecast; Segmentation Analysis; Impact of COVID-19; Companies’ Strategic Developments; Market Share Analysis of Key Players; Company Profiling |
Regions Covered in the Report |
North America, Europe, Asia-Pacific, Latin America, Middle East And Africa |
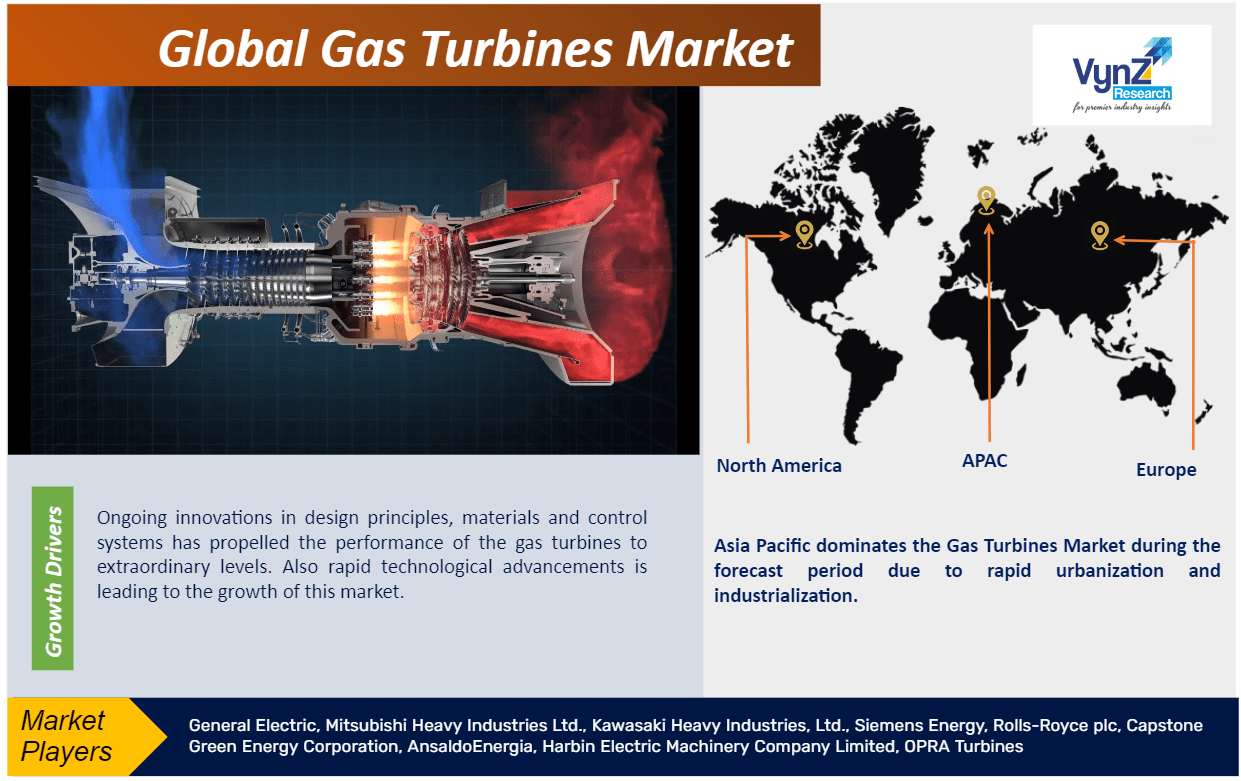
Ongoing innovations in design principles, materials and control systems has propelled the performance of the gas turbines to extraordinary levels. Also rapid technological advancements is leading to the growth of this market. The integration of cutting-edge digital technologies, like predictive maintenance and advanced monitoring systems, enhances reliability and minimizes downtime, solidifying these turbines as a forefront technology in power generation. Broad research and development (R&D) initiatives are ensuring these turbines to remain at the forefront of technological innovation. Rising environmental sustainability is one of the major factors steering the growth of the gas turbine market. These turbines produce significantly lower emissions compared to conventional power generation methods and stand out as environmentally responsible alternatives. The global market is experiencing vigorous growth which is driven by the need for cleaner energy sources, increasing energy demands and infrastructure development.
Environmental concerns and regulatory pressures are driving the need for cleaner technologies. However, these challenges can be addressed through advancements in turbine efficiency, emissions reduction and embracing digital solutions for predictive maintenance .
Asia Pacific dominates the Gas Turbines Market during the forecast period due to rapid urbanization and industrialization whereas other regions, including North America and Europe, focus on sustainable energy transitions. The Middle East and Africa influence gas turbines for infrastructure development and oil and gas operations
The major players actively investing in partnerships, research and development and acquisitions. Companies are striving to enhance their technological capabilities, offer innovative solutions to meet evolving customer demands and expand market reach.
Mitsubishi Heavy Industries Group has extensive experience in developing gas turbines and has integrated the latest technologies in aerodynamics, cooling design and materials to create a variety of highly efficient and reliable products. The state-of-the-art J-series gas turbines have consistently led the world, achieving the world’s largest capacity and highest efficiency. Group offer a wide range of gas turbines from 30MW to 560MW class, that meets diverse needs around the world. It is the only company in Japan that can handle the entire production process from development, design, manufacturing, construction, and test run to after-sales service for large capacity thermal power plants and their core equipment using its proprietary technologies.
GE offers a wide array of equipment options and models to meet your most challenging energy requirements as the world’s largest manufacturer and supplier of gas turbine technology.
Some of the key players in this market are General Electric, Mitsubishi Heavy Industries Ltd., Kawasaki Heavy Industries, Ltd., Siemens Energy, Rolls-Royce plc, Capstone Green Energy Corporation, AnsaldoEnergia, Harbin Electric Machinery Company Limited, OPRA Turbines
GE Vernova successfully completes modernization of 4 gas turbines at Kuwait’s Sabiya power plant that shall boost efficiency and increase the overall output. This will allow more power to be produced without increasing fuel consumption and the resulting carbon dioxide emissions, which would amount to the equivalent of approximately another 16,000 cars being put on Kuwait's roads.
NTPC Ltd., signed a Memorandum of Understanding (MoU) with Mitsubishi Heavy Industries, Ltd. Japan and its subsidiary Mitsubishi Power India Private Limited to demonstrate the feasibility for Hydrogen co-firing blended with natural gas in MHI 701D gas turbines installed at NTPC Auraiya Gas Power Plant in Uttar Pradesh.
Segments Covered in the Report
Region Covered in the Report
Source: VynZ Research
1. Research Overview
1.1. The Report Offers
1.2. Market Coverage
1.2.1. By Design Type
1.2.2. By Technology
1.2.3. By Rated Capacity
1.2.4. By End-User
1.2.6. By Region
1.3. Research Phases
1.4. Limitations
1.5. Market Methodology
1.5.1. Data Sources
1.5.1.1. Primary Research
1.5.1.2. Secondary Research
1.5.2. Methodology
1.5.2.1. Data Exploration
1.5.2.2. Forecast Parameters
1.5.2.3. Data Validation
1.5.2.4. Assumptions
1.5.3. Study Period & Data Reporting Unit
2. Executive Summary
3. End-user Type Overview
3.1. End-user Type Dynamics
3.1.1. Market Growth Drivers
3.1.2. Market Restraints
3.1.3. Key Market Trends
3.1.4. Major Opportunities
3.2. End-user Type Ecosystem
3.2.1. Porter’s Five Forces Analysis
3.2.2. Recent Development Analysis
3.2.3. Value Chain Analysis
3.3. Competitive Insight
3.3.1. Competitive Position of End-user Type Players
3.3.2. Market Attractive Analysis
3.3.3. Market Share Analysis
4. Global Market Estimate and Forecast
4.1. Global Market Overview
4.2. Global Market Estimate and Forecast to 2030
5. Market Segmentation Estimate and Forecast
5.1. By Design Type
5.1.1. Heavy Duty
5.1.1.1. Market Definition
5.1.1.2. Market Estimation and Forecast to 2030
5.1.2 Aeroderivative
5.1.2.1. Market Definition
5.1.2.2. Market Estimation and Forecast to 2030
5.2. By Technology
5.2.1. Open Cycle
5.2.1.1. Market Definition
5.2.1.2. Market Estimation and Forecast to 2030
5.2.2. Combined Cycle
5.2.2.1. Market Definition
5.2.2.2. Market Estimation and Forecast to 2030
5.3 By Rated Capacity
5.3.1. 1-40 MW
5.3.1.1. Market Definition
5.3.1.2. Market Estimation and Forecast to 2030
5.3.2. 40-120 MW
5.3.2.1. Market Definition
5.3.2.2. Market Estimation and Forecast to 2030
5.3.3. 120-300 MW
5.3.3.1. Market Definition
5.3.3.2. Market Estimation and Forecast to 2030
5.3.4. Above 300 MW
5.3.4.1. Market Definition
5.3.4.2. Market Estimation and Forecast to 2030
5.4. By End-User
5.4.1. Power Generation
5.4.1.1. Market Definition
5.4.1.2. Market Estimation and Forecast to 2030
5.4.2. Oil and Gas
5.4.2.1. Market Definition
5.4.2.2. Market Estimation and Forecast to 2030
5.4.3. Mobility
5.4.3.1. Market Definition
5.4.3.2. Market Estimation and Forecast to 2030
5.4.4. Others
5.4.4.1. Market Definition
5.4.4.2. Market Estimation and Forecast to 2030
6. North America Market Estimate and Forecast
6.1. By Design Type
6.2. By Technology
6.3. By Rated Capacity
6.4. By End-User
6.5. By Country – China, Japan, India, South Korea, and Rest of Asia-Pacific
6.5.1. U.S. Market Estimate and Forecast
6.5.2. Canada Market Estimate and Forecast
6.5.3. Mexico Market Estimate and Forecast
7. Europe Market Estimate and Forecast
7.1. By Design Type
7.2. By Technology
7.3. By Rated Capacity
7.4. By End-User
7.5. By Country – China, Japan, India, South Korea, and Rest of Asia-Pacific
7.5.1. Germany Market Estimate and Forecast
7.5.2. France Market Estimate and Forecast
7.5.3. U.K. Market Estimate and Forecast
7.5.4. Italy Market Estimate and Forecast
7.5.5. Spain Market Estimate and Forecast
7.5.6. Rest of Europe Market Estimate and Forecast
8. Asia-Pacific Market Estimate and Forecast
8.1. By Design Type
8.2. By Technology
8.3. By Rated Capacity
8.4. By End-User
8.5. By Country – China, Japan, India, South Korea, and Rest of Asia-Pacific
8.5.1. China Market Estimate and Forecast
8.5.2. Japan Market Estimate and Forecast
8.5.3. India Market Estimate and Forecast
8.5.4. South Korea Market Estimate and Forecast
8.5.5. Singapore Market Estimate and Forecast
8.5.6. Rest of Asia-Pacific Market Estimate and Forecast
9. Rest of the World (RoW) Market Estimate and Forecast
9.1. By Design Type
9.2. By Technology
9.3. By Rated Capacity
9.4. By End-User
9.5. By Country – Brazil, Saudi Arabia, South Africa, U.A.E., and Other Countries
9.5.1. Brazil Market Estimate and Forecast
9.5.2. Saudi Arabia Market Estimate and Forecast
9.5.3. South Africa Market Estimate and Forecast
9.5.4. Other Countries Market Estimate and Forecast
10. Company Profiles
10.1. General Electric
10.1.1. Snapshot
10.1.2. Overview
10.1.3. Offerings
10.1.4. Financial Insight
10.1.5. Recent Developments
10.2. Mitsubishi Heavy Industries Ltd.
10.2.1. Snapshot
10.2.2. Overview
10.2.3. Offerings
10.2.4. Financial Insight
10.2.5. Recent Developments
10.3. Kawasaki Heavy Industries, Ltd.
10.3.1. Snapshot
10.3.2. Overview
10.3.3. Offerings
10.3.4. Financial Insight
10.3.5. Recent Developments
10.4. Siemens Energy
10.4.1. Snapshot
10.4.2. Overview
10.4.3. Offerings
10.4.4. Financial Insight
10.4.5. Recent Developments
10.5. Rolls-Royce plc
10.5.1. Snapshot
10.5.2. Overview
10.5.3. Offerings
10.5.4. Financial Insight
10.5.5. Recent Developments
10.6. Capstone Green Energy Corporation
10.6.1. Snapshot
10.6.2. Overview
10.6.3. Offerings
10.6.4. Financial Insight
10.6.5. Recent Developments
10.7. AnsaldoEnergia
10.7.1. Snapshot
10.7.2. Overview
10.7.3. Offerings
10.7.4. Financial Insight
10.7.5. Recent Developments
10.8. Harbin Electric Machinery Company Limited
10.8.1. Snapshot
10.8.2. Overview
10.8.3. Offerings
10.8.4. Financial Insight
10.8.5. Recent Developments
10.9. OPRA Turbines
10.9.1. Snapshot
10.9.2. Overview
10.9.3. Offerings
10.9.4. Financial Insight
10.9.5. Recent Developments
11. Appendix
11.1. Exchange Rates
11.2. Abbreviations
Note: Financial insight and recent developments of different companies are subject to the availability of information in the secondary domain.
List of Tables
Table 1 Design Type
Table 2 Study Periods
Table 3 Data Reporting Unit
Table 4 Global Gas Turbines Market Size, by Design Type, 2018-2023 (USD Billion)
Table 5 Global Gas Turbines Market Size, by Design Type, 2025-2030 (USD Billion)
Table 6 Global Gas Turbines Market Size, by Technology, 2018-2023 (USD Billion)
Table 7 Global Gas Turbines Market Size, by Technology, 2025-2030 (USD Billion)
Table 8 Global Gas Turbines Market Size, by Rated Capacity , 2018-2023 (USD Billion)
Table 9 Global Gas Turbines Market Size, by Rated Capacity , 2025-2030 (USD Billion)
Table 10 Global Gas Turbines Market Size, by End-User , 2018-2023 (USD Billion)
Table 11 Global Gas Turbines Market Size, by End-User , 2025-2030 (USD Billion)
Table 12 Global Gas Turbines Market Size, by Region, 2018-2023 (USD Billion)
Table 13 Global Gas Turbines Market Size, by Region, 2025-2030 (USD Billion)
Table 14 North America Gas Turbines Market Size, by Design Type, 2018-2023 (USD Billion)
Table 15 North America Gas Turbines Market Size, by Design Type, 2025-2030 (USD Billion)
Table 16 North America Gas Turbines Market Size, by Technology, 2018-2023 (USD Billion)
Table 17 North America Gas Turbines Market Size, by Technology, 2025-2030 (USD Billion)
Table 18 North America Gas Turbines Market Size, by Rated Capacity , 2018-2023 (USD Billion)
Table 19 North America Gas Turbines Market Size, by Rated Capacity , 2025-2030 (USD Billion)
Table 20 North America Gas Turbines Market Size, by End-User , 2018-2023 (USD Billion)
Table 21 North America Gas Turbines Market Size, by End-User, 2025-2030 (USD Billion)
Table 22 North America Gas Turbines Market Size, by Country, 2018-2023 (USD Billion)
Table 23 North America Gas Turbines Market Size, by Country, 2025-2030 (USD Billion)
Table 24 Europe Gas Turbines Market Size, by Design Type, 2018-2023 (USD Billion)
Table 25 Europe Gas Turbines Market Size, by Design Type, 2025-2030 (USD Billion)
Table 26 Europe Gas Turbines Market Size, by Technology, 2018-2023 (USD Billion)
Table 27 Europe Gas Turbines Market Size, by Technology, 2025-2030 (USD Billion)
Table 28 Europe Gas Turbines Market Size, by Rated Capacity , 2018-2023 (USD Billion)
Table 29 Europe Gas Turbines Market Size, by Rated Capacity , 2025-2030 (USD Billion)
Table 30 Europe Gas Turbines Market Size, by End-User , 2018-2023 (USD Billion)
Table 31 Europe Gas Turbines Market Size, by End-User, 2025-2030 (USD Billion)
Table 32 Europe Gas Turbines Market Size, by Country, 2018-2023 (USD Billion)
Table 33 Europe Gas Turbines Market Size, by Country, 2025-2030 (USD Billion)
Table 34 Asia-Pacific Gas Turbines Market Size, by Design Type, 2018-2023 (USD Billion)
Table 35 Asia-Pacific Gas Turbines Market Size, by Design Type, 2025-2030 (USD Billion)
Table 36 Asia-Pacific Gas Turbines Market Size, by Technology, 2018-2023 (USD Billion)
Table 37 Asia-Pacific Gas Turbines Market Size, by Technology, 2025-2030 (USD Billion)
Table 38 Asia-Pacific Gas Turbines Market Size, by Rated Capacity , 2018-2023 (USD Billion)
Table 39 Asia-Pacific Gas Turbines Market Size, by Rated Capacity , 2025-2030 (USD Billion)
Table 40 Asia-Pacific Gas Turbines Market Size, by End-User , 2018-2023 (USD Billion)
Table 41 Asia-Pacific Gas Turbines Market Size, by End-User, 2025-2030 (USD Billion)
Table 42 Asia-Pacific Gas Turbines Market Size, by Country, 2018-2023 (USD Billion)
Table 43 Asia-Pacific Gas Turbines Market Size, by Country, 2025-2030 (USD Billion)
Table 44 RoW Gas Turbines Market Size, by Design Type, 2018-2023 (USD Billion)
Table 45 RoW Gas Turbines Market Size, by Design Type, 2025-2030 (USD Billion)
Table 46 RoW Gas Turbines Market Size, by Technology, 2018-2023 (USD Billion)
Table 47 RoW Gas Turbines Market Size, by Technology, 2025-2030 (USD Billion)
Table 48 RoW Gas Turbines Market Size, by Rated Capacity , 2018-2023 (USD Billion)
Table 49 RoW Gas Turbines Market Size, by Rated Capacity , 2025-2030 (USD Billion)
Table 50 RoW Gas Turbines Market Size, by End-User , 2018-2023 (USD Billion)
Table 51 RoW Gas Turbines Market Size, by End-User, 2025-2030 (USD Billion)
Table 52 RoW Gas Turbines Market Size, by Country, 2018-2023 (USD Billion)
Table 53 RoW Gas Turbines Market Size, by Country, 2025-2030 (USD Billion)
Table 54 Snapshot – General Electric
Table 55 Snapshot – Mitsubishi Heavy Industries Ltd.
Table 56 Snapshot – Kawasaki Heavy Industries, Ltd.
Table 57 Snapshot – Siemens Energy
Table 58 Snapshot – Rolls-Royce plc
Table 59 Snapshot – Capstone Green Energy Corporation
Table 60 Snapshot – AnsaldoEnergia
Table 61 Snapshot – Harbin Electric Machinery Company Limited
Table 62 Snapshot – OPRA Turbines
List of Figures
Figure 1 Market Coverage
Figure 2 Research Phases
Figure 3 Secondary Design Types for Different Parameters
Figure 4 Methodology
Figure 5 Data Mining & Exploration
Figure 6 Data Triangulation
Figure 7 Assumptions for Market Estimation and Forecast
Figure 8 Market Synopsis
Figure 9 Global Gas Turbines Market - Growth Drivers and Restraints
Figure 10 Competitive Benchmark
Figure 11 Global Gas Turbines Market Highlight
Figure 12 Global Gas Turbines Market Size, by Design Type, 2018 – 2030 (USD Billion)
Figure 13 Global Gas Turbines Market Size, by Technology 2018 – 2030 (USD Billion)
Figure 14 Global Gas Turbines Market Size, by Rated Capacity 2018 – 2030 (USD Billion)
Figure 15 Global Gas Turbines Market Size, by End-User 2018 – 2030 (USD Billion)
Figure 16 Global Gas Turbines Market Size, by Region, 2018 – 2030 (USD Billion)
Figure 17 North America Gas Turbines Market Highlight
Figure 18 North America Gas Turbines Market Size, by Design Type, 2018 – 2030 (USD Billion)
Figure 19 North America Gas Turbines Market Size, by Technology 2018–2030 (USD Billion)
Figure 20 North America Gas Turbines Market Size, by Rated Capacity 2018–2030 (USD Billion)
Figure 21 North America Gas Turbines Market Size, by End-User 2018–2030 (USD Billion)
Figure 22 North America Gas Turbines Market Size, by Country, 2018 – 2030 (USD Billion)
Figure 23Europe Gas Turbines Market Highlight
Figure 24 Europe Gas Turbines Market Size, by Design Type, 2018 – 2030 (USD Billion)
Figure 25 Europe Gas Turbines Market Size, by Technology 2018 – 2030 (USD Billion)
Figure 26 Europe Gas Turbines Market Size, by Rated Capacity 2018 – 2030 (USD Billion)
Figure 27 Europe Gas Turbines Market Size, by End-User 2018 – 2030 (USD Billion)
Figure 28 Europe Gas Turbines Market Size, by Country, 2018 – 2030 (USD Billion)
Figure 29 Asia-Pacific Gas Turbines Market Highlight
Figure 30 Asia-Pacific Gas Turbines Market Size, by Design Type, 2018 – 2030 (USD Billion)
Figure 31 Asia-Pacific Gas Turbines Market Size, by Technology 2018 – 2030 (USD Billion)
Figure 32 Asia-Pacific Gas Turbines Market Size, by Rated Capacity 2018 – 2030 (USD Billion)
Figure 33 Asia-Pacific Gas Turbines Market Size, by End-User 2018 – 2030 (USD Billion)
Figure 34 Asia-Pacific Gas Turbines Market Size, by Country, 2018 – 2030 (USD Billion)
Figure 35 RoW Gas Turbines Market Highlight
Figure 36 RoW Gas Turbines Market Size, by Design Type, 2018 – 2030 (USD Billion)
Figure 37 RoW Gas Turbines Market Size, by Technology 2018 – 2030 (USD Billion)
Figure 38 RoW Gas Turbines Market Size, by Rated Capacity 2018 – 2030 (USD Billion)
Figure 39 RoW Gas Turbines Market Size, by End-User 2018 – 2030 (USD Billion)
Figure 40 RoW Gas Turbines Market Size, by Country, 2018 – 2030 (USD Billion)
Gas Turbines Market Coverage
By Design Type Insight and Forecast 2025-2030
By Technology Insight and Forecast 2025-2030
By Rated Capacity Insight and Forecast 2025-2030
End-User Insight and Forecast 2025-2030
Global Gas Turbines Market by Region
North America
Europe
Asia-Pacific (APAC)
Rest of the World (RoW)
Vynz Research know in your business needs, you required specific answers pertaining to the market, Hence, our experts and analyst can provide you the customized research support on your specific needs.
After the purchase of current report, you can claim certain degree of free customization within the scope of the research.
Please let us know, how we can serve you better with your specific requirements to your research needs. Vynz research promises for quick reversal for your current business requirements.
Purchase Options
Latest Report
Research Methodology
Connect With Our Sales Team