Sustainable Aviation Fuel Market Overview
The Global Sustainable Aviation Fuel Market was worth USD 1.2 billion in 2023 and is expected to reach USD 17.10 billion by 2030 with a CAGR of 47.8% during the forecast period.
Sustainable Aviation Fuel (SAF) is an eco-friendly alternative to traditional aviation fuels. It is a derivative of renewable resources like biomass, waste oils, or hydrogen. It aims to decrease the aviation industry's carbon footprint by offering a cleaner-burning choice with lower greenhouse gas emissions, flawlessly integrating into current aircraft and infrastructure. It contributes to mitigating climate change and aligns with worldwide efforts towards carbon neutrality, playing a vital role in endorsing greener air travel and a sustainable future.
The global sustainable aviation fuel market is segmented by platform, with commercial aviation taking the lead due to its substantial carbon footprint and commitment to sustainability. Airlines, under regulatory pressure and corporate responsibility, heavily invest in SAF. Among fuel types, biofuel dominates as it's renewable and compatible with existing infrastructure.
Further categorizing by biofuel blending capacity, the 30-50% segment prevails for its sustainability and compatibility with current aircraft. In terms of technology, HEFA-SPK leads due to its versatility and infrastructure compatibility, exemplified by Chevron and Delta Air Lines' collaboration driving sustainability initiatives.
Sustainable Aviation Fuel Market Segmentation
Insight by Platform
The global sustainable aviation fuel market is divided by platform into commercial aviation, military aviation, business & general aviation, and unmanned aerial vehicles (UAVs). Out of these, the commercial aviation led the market due to its significant carbon footprint and commitment to sustainability. Airlines, pressured by regulations and corporate responsibility, are heavily investing in SAF.
Insight by Fuel Type
The global sustainable aviation fuel market categorizes fuel into biofuel, hydrogen fuel, power-to-liquid fuel, and gas-to-liquid fuel. Among these segments, the biofuel segment dominated due to its renewable nature and compatibility with existing infrastructure. A collaboration between Boeing and Embraer emphasized biofuel's significance, showcasing industry commitment to immediate emission reduction solutions.
Insight by Biofuel Blending Capacity
The global sustainable aviation fuel market segments by biofuel blending capacity as below 30%, between 30-50%, and above 50%. Among these subsections, the 30-50% segment dominated due to its sustainability and compatibility with current aircraft. Airbus partnered with Air France-KLM to promote 30% SAF usage, highlighting the industry's commitment to this blending ratio for sustainable aviation.
Insight by Technology
The global sustainable aviation fuel market is divided by technology into HEFA-SPK, FT-SPK, HFS-SIP, and ATJ-SPK. The HEFA-SPK segment led due to its versatility and compatibility with existing infrastructure compared to the other segments. Chevron and Delta Air Lines' collaboration showcased HEFA-SPK's viability, driving the aviation industry towards sustainability.
Global Sustainable Aviation Fuel Market Report Coverage
|
Report Metric
|
Details
|
|
Historical Period
|
2020 - 2024
|
|
Base Year Considered
|
2025
|
|
Forecast Period
|
2026 - 2035
|
|
Market Size in 2025
|
U.S.D. 1.2 Billion
|
|
Revenue Forecast in 2035
|
U.S.D. 17.10 Billion
|
|
Growth Rate
|
47.8%%
|
|
Segments Covered in the Report
|
By Platform, By Fuel Type, By Biofuel Blending Capacity and By Technology
|
|
Report Scope
|
Market Trends, Drivers, and Restraints; Revenue Estimation and Forecast; Segmentation Analysis; Companies’ Strategic Developments; Market Share Analysis of Key Players; Company Profiling
|
|
Regions Covered in the Report
|
North America, Europe, Asia-Pacific, Middle East, and Rest of the World
|
Industry Dynamics
Sustainable Aviation Fuel Industry Trends
These following trends are collectively influencing the growing momentum of the global sustainable aviation fuel market towards a more sustainable aviation industry with reduced carbon emissions to mitigate climate change.
Airlines, manufacturers of fuel, and governments are increasingly investing in SAF production facilities and forming partnerships to scale up production and distribution networks.
Governments worldwide are implementing regulations and offering incentives to promote the use of SAF.
Continuous research and development efforts are underway to improve SAF production processes, increase feedstock diversity, and enhance fuel efficiency.
Airlines are facing increasing pressure to reduce carbon emissions, leading to a rising demand for SAF.
Environmentally conscious consumers are showing a preference for airlines offering sustainable travel options.
Airlines are exploring higher blending ratios of SAF in traditional jet fuel, such as 30-50% blends, to further reduce carbon emissions while ensuring compatibility with existing aircraft and infrastructure.
Efforts are being made to diversify feedstock sources for SAF production, including biomass, waste oils, algae, and synthetic pathways like power-to-liquid and gas-to-liquid processes, enhancing sustainability and supply chain resilience.
Collaboration among airlines, fuel producers, governments, and research institutions is increasing to address technological challenges, improve supply chain efficiency, and promote sustainable aviation practices.
Sustainable Aviation Fuel Market Growth Drivers
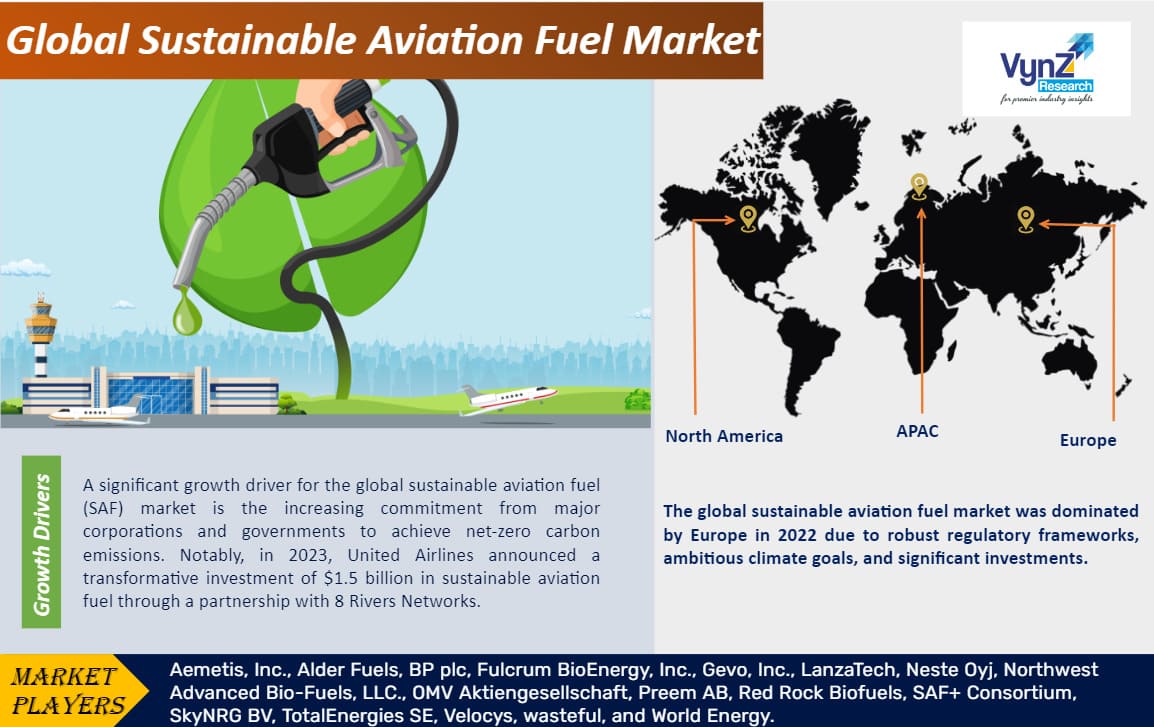
A significant driver for the global sustainable aviation fuel (SAF) market is the growing commitment from key corporations and governments to achieve net-zero carbon emissions.
The rising emphasis on sustainable biofuels, such as waste-to-jet fuel initiatives drive the adoption of SAF.
Government regulations and incentives aimed at reducing carbon emissions in the aviation industry encourages airlines and fuel manufacturers to invest in SAF production and adoption, driving market growth.
Major corporations, including airlines and aircraft manufacturers, are setting ambitious sustainability goals, driving demand for SAF and inspiring investments in sustainable aviation practices.
Continuous advancements in SAF production technologies, such as alternative feedstocks and production processes, contribute to the market's growth by improving efficiency and reducing costs.
Sustainable Aviation Fuel Market Challenges
Scaling up production poses a significant challenge for the global sustainable aviation fuel (SAF) market growth. This is exacerbated by limited capacity and delays in major production facilities, high production costs, uncertain regulatory frameworks, feedstock availability, and technological limitations.
Sustainable Aviation Fuel Market Opportunities
The drive to reduce carbon emissions in aviation creates a growth opportunity for the global sustainable aviation fuel (SAF) market facilitating investments and expansion. Technological innovations reduce cost and improve efficiency, which also creates growth opportunities. Also, strategic partnerships among industry stakeholders, supportive regulatory frameworks and incentives, increasing consumer demand for eco-friendly travel options further bolster opportunities for growth.
Sustainable Aviation Fuel Market Geographic Overview
The global sustainable aviation fuel market spans North America, Europe, Asia-Pacific, South America, and the Middle East and Africa. Europe dominates the market due to robust regulations, ambitious climate goals, and significant investments and partnerships.
North America and the Asia-Pacific regions are also significant markets, with growing regulatory support and investments driving SAF adoption. As governments and aviation stakeholders prioritize sustainability, these regions are poised for growth, nurturing innovation and promoting eco-friendly aviation practices.
Sustainable Aviation Fuel Market Competitive Insight
Neste, a Finnish company, is a leading player in the global sustainable aviation fuel (SAF) market. Renowned for its advanced refining capabilities, Nestle has secured a strong market position. In October 2023, Nestle announced a collaboration with Shell Aviation to increase the availability of SAF at key airports, underscoring its commitment to industry partnerships. This move aligns with Nestle's strategy to expand SAF production and distribution networks, solidifying its role in driving the aviation sector toward greener alternatives and meeting the increasing demand for sustainable solutions.
Gevo, a U.S.-based renewable chemicals and advanced biofuels company, holds a significant position in the global SAF market. Leveraging its innovative technology, Gevo focuses on producing low-carbon, sustainable biofuels. In a recent development in September 2023, Gevo entered into a collaboration with Delta Air Lines and Air BP to supply SAF for flights departing from Los Angeles. This partnership demonstrates Gevo's commitment to expanding its market presence by working closely with major industry players, contributing to the growth and adoption of sustainable aviation fuel in the competitive global market.
Recent Development by Key Players
Boeing and Zero Petroleum announced a collaboration at the Dubai Airshow to test and analyze next-gen sustainable aviation fuel (SAF) technologies. The partnership entails Boeing establishing a testing program for Zero's SAF at the University of Sheffield's Energy Innovation Centre, where Boeing is a founding member, showcasing a commitment to advancing eco-friendly aviation solutions.
Advanced Refining Technologies LLC, a joint venture between Chevron and specialty chemicals leader W. R. Grace & Co., introduced ENDEAVOR – a hydroprocessing catalyst solution designed to produce renewable diesel (RD) and sustainable aviation fuel (SAF) using 10% renewable sources like vegetable oils, refined oils, animal fats, and greases. The launch aligns with the surging demand for renewable transportation fuels, emphasizing the industry's commitment to innovative solutions for cleaner energy production.
Key Players Covered in the Report
Aemetis, Inc., Alder Fuels, BP plc, Fulcrum BioEnergy, Inc., Gevo, Inc., LanzaTech, Neste Oyj, Northwest Advanced Bio-Fuels, LLC., OMV Aktiengesellschaft, Preem AB, Red Rock Biofuels, SAF+ Consortium, SkyNRG BV, TotalEnergies SE, Velocys, wasteful, and World Energy.
The sustainable aviation fuel market report offers a comprehensive market segmentation analysis along with an estimation for the forecast period 2025–2030.
Segments Covered in the Report
By Platform
- Commercial Aviation
- Military Aviation
- Business & General Aviation
- Unmanned Aerial Vehicle
By Fuel Type
- Bio-Fuel
- Hydrogen Fuel
- Power-to-Liquid Fuel
- Gas-to-Liquid Fuel
By Biofuel Blending Capacity
- Below 30%
- Between 30-50%
- Above 50%
By Technology
- HEFA-SPK
- FT-SPK
- HFS-SIP
- ATJ-SPK
Region Covered in the Report
North America
Europe
- Germany
- U.K.
- France
- Italy
- Spain
- Russia
- Rest of Europe
Asia-Pacific (APAC)
- China
- Japan
- India
- South Korea
- Rest of Asia-Pacific
Middle East and Africa (MEA)
- Saudi Arabia
- U.A.E
- South Africa
- Rest of MEA
South America
- Argentina
- Brazil
- Chile
- Rest of South America
.png "Power Rental Market Size")
Source: VynZ Research
.png "Sustainable Aviation Fuel Market Analysis")
Source: VynZ Research
