Water Electrolyzer Market Overview
The Global Water Electrolyzer Market was worth USD 0.62 billion in 2023 and is expected to reach USD 58.5 billion by 2030 with a CAGR of 88.4% during the forecast period.
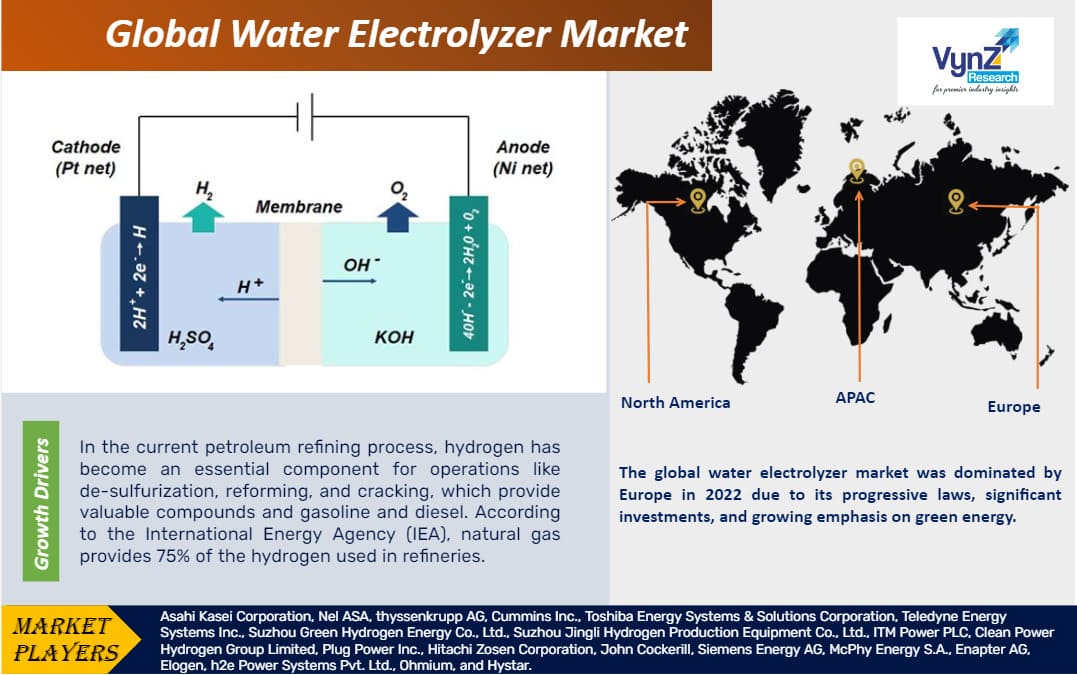
A water electrolyzer splits H2O into H2 and O2 using electricity. It has two electrodes in water, where an electric current triggers a reaction. At the cathode, H2 ions form, while at the anode, O2 is generated. This process, electrolysis, produces hydrogen and oxygen gases for clean energy.
The market is divided by its type into alkaline, PEM, solid oxide, and anion exchange membrane electrolysis where alkaline electrolyzers dominate. It is also divided into transportation, refining, power storage, ammonia and methanol production, and other sectors by its application, where ammonia production leads the market.
Water Electrolyzer Market Insight by Electrolyzer Type
The global water electrolyzer market is divided into alkaline electrolysis, proton exchange membrane (PEM) electrolysis, solid oxide electrolysis, and anion exchange membrane electrolysis. Out of these segments, the alkaline electrolyzers dominates the market due to their established technology, affordability, and efficient hydrogen production. They use potassium hydroxide as an electrolyte solution, making them popular for large-scale production.
Insight by End-use Application
The global water electrolyzer market is divided into transportation/mobility, refining, power and energy storage, ammonia production, methanol production, and other industries. Among these segments, ammonia production leads the market due to its role in green energy and fertilizer industries. Electrolysis of hydrogen is integral to green ammonia production which uses renewable-driven electrolyzers to lower emissions.
Global Water Electrolyzer Market Report Coverage
|
Report Metric
|
Details
|
|
Historical Period
|
2020 - 2024
|
|
Base Year Considered
|
2025
|
|
Forecast Period
|
2026 - 2035
|
|
Market Size in 2025
|
U.S.D. 0.62 Billion
|
|
Revenue Forecast in 2035
|
U.S.D. 58.5 Billion
|
|
Growth Rate
|
88.4%%
|
|
Segments Covered in the Report
|
By Electrolyzer, and By End-use Application
|
|
Report Scope
|
Market Trends, Drivers, and Restraints; Revenue Estimation and Forecast; Segmentation Analysis; Companies’ Strategic Developments; Market Share Analysis of Key Players; Company Profiling
|
|
Regions Covered in the Report
|
North America, Europe, Asia-Pacific, Middle East, and Rest of the World
|
Industry Dynamics
Water Electrolyzer Industry Trends
Growing awareness of climate change and the necessity for sustainable energy sources is driving the demand for green hydrogen.
Continuous research and development efforts are leading to technological advancements in water electrolyzers, ensuing better efficiency, reliability, and cost-effectiveness.
With the worldwide push towards renewable energy sources, water electrolyzers are being integrated more and more into renewable energy systems to produce hydrogen, supporting grid stability and energy storage.
The rising demand for water electrolyzers is leading to the establishment of new manufacturing facilities across regions, catering to the increasing market demands and improving production capacities.
Governments worldwide are employing supportive policies, incentives, and funding programs to promote the adoption of water electrolyzers and expedite the transition towards a hydrogen economy.
Water electrolyzers are finding applications across various industries beyond energy, including transportation, refining, chemicals, and manufacturing.
Market players are concentrating on developing scalable and commercially workable electrolyzer solutions to meet the increasing demand for large-scale hydrogen manufacture in industrial applications.
Green ammonia production, facilitated by water electrolyzers, is gaining attention as a capable solution for decarbonizing the fertilizer industry and empowering sustainable energy storage and transportation.
Collaboration between industry players, research institutions, and governments is becoming progressively prevalent to drive revolution and address technological encounters.
Environmental concerns are motivating market players to prioritize sustainability in electrolyzer manufacturing procedures, materials obtaining, and end-of-life supervision, aligning with worldwide efforts towards a circular economy and lower carbon emissions.
Water Electrolyzer Market Growth Drivers
One of the most significant growth drivers of the global water electrolyzer market is the rising demand from the refining industry.
The rise in demand for green fertilizers is also propelling the growth of the market due to lower greenhouse gas emissions.
Rapid adoption in energy storage sector is also facilitating the growth of the market due to higher efficiency in balancing irregular renewable energy sources.
Expansion in industrial applications beyond traditional sectors like refining and fertilizer production such as metallurgy, electronics, and food processing are also driving its growth.
Favorable government policies and incentives, and funding programs are promoting the adoption of water electrolyzers to transition towards a hydrogen economy.
Higher investment in research and development activities by key market players and government institutions is driving innovation in electrolyzer technology to improve efficiency, reduce costs, and enhance scalability is also fueling market growth.
Water Electrolyzer Market Challenges
High energy loss, limited scalability, and dependence on intermittent renewable energy pose challenges to water electrolyzer market growth. Additionally, cost barriers, infrastructure constraints, and technological complexity hinder widespread adoption.
Water Electrolyzer Market Opportunities
Renewable energy integration and growing demand for green hydrogen offer opportunities for water electrolyzer market expansion. Technological innovation, government support, and industrial diversification further propel growth opportunities worldwide.
Water Electrolyzer Market Geographic Overview
The global water electrolyzer market spans North America, Europe, Asia-Pacific, Latin America, and the Middle East/Africa. Europe leads the market due to progressive laws and investments, highlighted by initiatives like the EU's Green Deal and national hydrogen strategies in Germany and France.
North America is also expected to witness a significant growth in the projected period due to increasing investments in renewable energy and government initiatives to promote clean energy solutions.
The Asia-Pacific region, on the other hand, is undergoing rapid industrialization and urbanization, resulting in a surge in demand for hydrogen in several sectors like transportation, manufacturing, and energy production. Moreover, helpful government policies and rising awareness of environmental sustainability are further driving market expansion in this region.
Water Electrolyzer Market Competitive Insight
NEL ASA is a market leader for water electrolyzers worldwide and being a top player in the market, they have built a strong reputation for providing electrolysis systems of the highest caliber. Because of their efficiency and versatility, their Proton Exchange Membrane (PEM) electrolyzers are well-suited for a wide range of applications, including as industrial operations and the storage of renewable energy. Projects like the "Green Hydrogen for Scotland" initiative, which aims to use NEL ASA's electrolyzer technology for large-scale hydrogen production, are prime examples of the company's crucial role in expanding the green hydrogen sector. Furthermore, partnerships with significant industry participants highlight NEL ASA's impact on the global landscape of sustainable hydrogen production going forward.
Thyssenkrupp has made a significant impact on the global water electrolyzers market with their manufacturing and technical expertise including electrolysis equipment, which allows them to provide state-of-the-art green hydrogen production solutions. Their cutting-edge alkaline electrolyzers stand out in particular for their effectiveness and robustness. Thyssenkrupp's critical role is demonstrated by their participation in the "Haru Oni" project in Chile, which attempts to use renewable energy sources to produce green hydrogen. Furthermore, collaborations with companies such as Ørsted in Denmark and E.ON in Germany highlight Thyssenkrupp's significant contribution to advancing the global uptake of sustainable hydrogen technologies.
Recent Development by Key Players
ThyssenKrupp Nuclear and Neste signed an agreement to reserve production capacities for a 120 MW water electrolyzer at Neste’s refinery in Finland. The new electrolyzers will allow Neste to start producing green hydrogen at its refinery in Porvoo, Finland. There is a growing demand for thyssenkrupp Nucera’s water electrolysis technology with their third reservation agreement for production capacities within the last few months.
Veradagy, an industry pioneer specializing in advanced water electrolysis electrolyzer technologies for large-scale industrial applications, opened a new cutting-edge manufacturing facility in Newark, California, marking a significant milestone in the United States’ green hydrogen industry. Operations in the new facility are expected to start in Q1 2024 with the company aiming to double its employee count by next summer to accommodate the facility’s operation and expansion.
Key Players Covered in the Report
Asahi Kasei Corporation, Nel ASA, thyssenkrupp AG, Cummins Inc., Toshiba Energy Systems & Solutions Corporation, Teledyne Energy Systems Inc., Suzhou Green Hydrogen Energy Co., Ltd., Suzhou Jingli Hydrogen Production Equipment Co., Ltd., ITM Power PLC, Clean Power Hydrogen Group Limited, Plug Power Inc., Hitachi Zosen Corporation, John Cockerill, Siemens Energy AG, McPhy Energy S.A., Enapter AG, Elogen, h2e Power Systems Pvt. Ltd., Ohmium, and Hystar.
The Water Electrolyzer Market Report offers a comprehensive market segmentation analysis along with an estimation for the forecast period 2025–2030.
Segments Covered in the Report
By Electrolyzer Type
- Alkaline Electrolyzer
- Proton Exchange Membrane (PEM) Electrolyzer
- Solid Oxide Electrolyzer Cell (SOEC)
- Anion Exchange Membrane (AEM) Electrolyzers
End-Use Application
- Transportation/Mobility Industry
- Refining Industry
- Power and Energy Storage
- Ammonia Production
- Methanol Production
- Other End-Use Applications
Region Covered in the Report
North America
Europe
- Germany
- U.K.
- France
- Italy
- Spain
- Russia
- Rest of Europe
Asia-Pacific (APAC)
- China
- Japan
- India
- South Korea
- Rest of Asia-Pacific
Middle East and Africa (MEA)
- Saudi Arabia
- U.A.E
- South Africa
- Rest of MEA
Latin America
- Argentina
- Brazil
- Chile
- Rest of Latin America
Primary Research Interviews Breakdown
%20System%20Market.png "France Skincare Devices Market Size")
