Contrast Media Market Overview
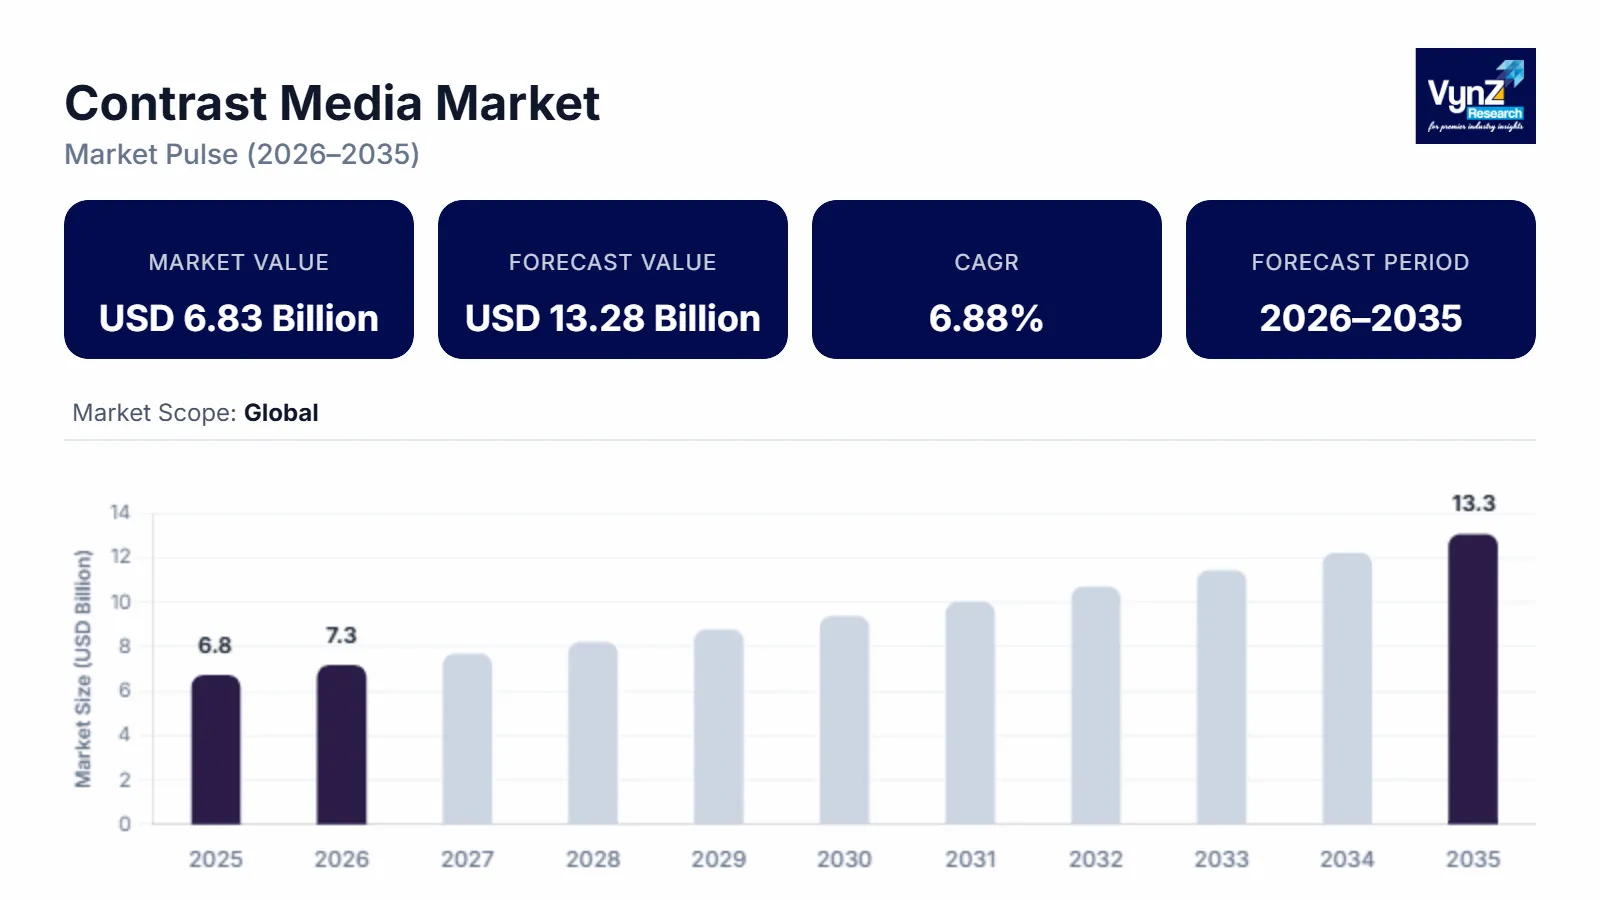
The global Contrast Media Market size was valued at USD 6.83 billion in 2025 and is estimated to reach around USD 7.29 billion in 2026. It is projected to reach around USD 13.28 billion by 2035, expanding at a CAGR of about 6.88 % during the forecast period from 2026 to 2035.
Contrast media or contrast agent alters the way medical imaging equipment interacts with the body and allow certain parts of the body to be distinguished from surrounding tissue. It aids in the visibility of blood arteries, specific tissues, and organs. Contrast media/contrast agents improve internal body images obtained during ultrasound, X-ray, MRI, and CT scans. It assists radiologists in distinguishing between abnormal and normal tissues.
Advanced wound care uses specific products to treat acute or chronic wounds. It is an expensive form of wound care but is extremely useful to expedite the healing process of wounds that usually take a longer time to recover. The products are specially designed to keep the surrounding area of the wound moist and allow easy flow of oxygen. It also helps in preventing the wound from getting infected. Apart from that, these products maintain a consistent temperature and also reduce the painful experience while dressing the wound.
The global advanced wound care market will grow significantly during the forecast period due to the growing prevalence of specific medical conditions such as pressure ulcers, venous ulcers in the legs, and diabetes-related ulcers. It is also attributed to the growing obesity among people and the rise in the need for innovative wound treatment and dressings.
Contrast Media Market Segmentation
Insight by Media Type
- Iodinated Contrast Media
- Gadolinium-Based Contrast Media
- Microbubble Contrast Media
- Barium-Based Contrast Media
- other
The global contrast media market is divided by media type into Iodinated Contrast Media, Gadolinium-Based Contrast Media, Microbubble Contrast Media, Barium-Based Contrast Media, and other segments. Out of these segments, the Iodinated Contrast Media segment is expected to grow more during the forecast period due to higher use of X-ray and CT procedures, availability of non-ionically stable iodinated agents for advanced diagnosis, use of iodinated contrast medium that improves visibility of vascular systems and organs, higher radio-opacity, and lower toxicity. The Gadolinium-Based Contrast Media segment is also expected to grow significantly during the forecast period due to widespread use in MRI procedures, ongoing developments in gadolinium-based agents to improve diagnostic accuracy and patient safety, and superior imaging capabilities.
Insight by Indication
- Cardiovascular Disorders
- Cancer
- Gastrointestinal Disorders
- Musculoskeletal Disorders
- Neurological Disorders
- and Nephrological Disorders
The global contrast media market is divided by media type into Iodinated Contrast Media, Gadolinium-Based Contrast Media, Microbubble Contrast Media, Barium-Based Contrast Media, and other segments. Out of these segments, the Iodinated Contrast Media segment is expected to grow more during the forecast period due to higher use of X-ray and CT procedures, availability of non-ionically stable iodinated agents for advanced diagnosis, use of iodinated contrast medium that improves visibility of vascular systems and organs, higher radio-opacity, and lower toxicity. The Gadolinium-Based Contrast Media segment is also expected to grow significantly during the forecast period due to widespread use in MRI procedures, ongoing developments in gadolinium-based agents to improve diagnostic accuracy and patient safety, and superior imaging capabilities.
Insight by Modality
- X-ray
- Computed Tomography (CT)
- Magnetic Resonance Imaging (MRI)
- Catheterization Laboratory
- Ultrasound
- Other
The global contrast media market is divided by modality into X-ray, Computed Tomography (CT), Magnetic Resonance Imaging (MRI), Catheterization Laboratory, Ultrasound, and other categories. Out of all these segments, the X-ray and CT contrast segment will grow more than the others due to higher usage in diagnosing a large number of diseases and its higher efficiency in generating high-resolution 3D images. The MRI contrast segment will also grow due to superior soft tissue imaging capabilities, ongoing developments, and growing adoption in neurological and musculoskeletal diagnostics.
Insight by Route of Administration
- Intravascular Route
- Oral Route
- Rectal Route
- other
According to the route of administration, the global contrast media market is split into Intravascular Route, Oral Route, Rectal Route, and other segments. Out of these, the oral route will contribute a larger share of the market due to its ease of use and its efficiency in abdominal and pelvic CT scanning processes. The intravascular route will also grow due to its widespread adoption in angiography and vascular imaging, its critical role in diagnosing cardiovascular diseases, and its ability to provide rapid and detailed visualization of blood vessels.
Insight by Application
- Radiology
- Interventional Radiology
- Interventional Cardiology
The global contrast media market is also divided by applications into Radiology, Interventional Radiology, and Interventional Cardiology categories. Out of these segments, Interventional Cardiology is expected to contribute the largest share due to the rise in several people suffering from heart disorders and the growth in the worldwide geriatric population. The Radiology segment will also grow due to the growing demand across several medical fields, developments in radiology technologies, and the rising need for early and precise disease detection and monitoring, especially for oncology and neurology.
Global Contrast Media Market Report Coverage
|
Report Metric
|
Details
|
|
Historical Period
|
2020 - 2024
|
|
Base Year Considered
|
2025
|
|
Forecast Period
|
2026 - 2035
|
|
Market Size in 2025
|
U.S.D. 6.83 Billion
|
|
Revenue Forecast in 2035
|
U.S.D. 13.28 Billion
|
|
Growth Rate
|
6.88%
|
|
Segments Covered in the Report
|
By Media Type, By Indication, By Modality, By Route of Administration and By Application
|
|
Report Scope
|
Market Trends, Drivers, and Restraints; Revenue Estimation and Forecast; Segmentation Analysis; Companies’ Strategic Developments; Market Share Analysis of Key Players; Company Profiling
|
|
Regions Covered in the Report
|
North America, Europe, Asia-Pacific, Middle East, and Rest of the World
|
Industry Dynamics
Industry Trends
There is significant growth in the use of medical imaging. This is pushing the demand for contrast media and propelling revenue growth in the global contrast media market. Also, in the past few years, the use of contrast media has been widespread in the healthcare sector. Competition in the market is also expected to grow due to the anticipated expiration of patents of branded contrast media products during the forecast period. This will pave the way for generic counterparts to step into the market. These will be much less costly than the commercially available branded contrast agents.
Contrast Media Market Growth Drivers
One significant factor that influences the growth of the global contrast media market is the heart attacks, and strokes, growing sanctions of contrast agents, and accessibility are also promoting the market growth. In addition, the higher efficiency in contrast agent injection management and the advent of more accurate digital solutions also bolsters market growth. Also, the growing prevalence of complex comorbidities and long-term diseases due to chronic conditions fuels the market growth.
Contrast Media Market Challenges
The growth hindrance of the global contrast media market is attributed to the chances of mild side effects such as vomiting, stomach cramps, bluish skin color, and others, along with the lack of skilled professionals to operate the latest imaging technology and advanced diagnostic techniques, especially in several developing countries.
Contrast Media Market Opportunities
One of the significant factors that promise novel growth opportunities is the development of new and more innovative applications. In addition, the growing investments by the government and private sectors and their higher emphasis on developing affordable contrast media are offering further growth promises.
Contrast Media Market Geographic Overview
North America is expected to dominate the market due to the growing demand for early diagnosis, higher-tech development, higher volume of CT and MRI scans, a growing elderly population suffering from chronic diseases, and higher government initiatives in the field of medical imaging.
Asia-Pacific market will also grow at a higher CAGR during the forecast period due to an increase in the number of MRI and CT scans, the existence of developed cath labs, and the growing importance of cardiac disorders.
Contrast Media Market Competitive Insight
The industry players use strategies such as M&A, product launches, contractual agreements, collaborations, and indication expansion. Acquisitions help businesses expand their geographic reach and strengthen their portfolios. Disease indication extension is popular in this market because it allows firms to gain the trust of specific population subsets. Companies target niche patient cohorts and increase product adoption with approvals for specific indications. Also, the key players should adopt cost-effective techniques to diversify and survive in the competitive market environment.
GE Healthcare is committed to offering a comprehensive portfolio of Contrast Media products that assist in meeting patient and procedural needs across a wide range of modalities. The company has a long history of developing contrast media. Their diverse portfolio includes X-ray/CT, MRI, and Ultrasound modalities. GE Healthcare already has the world's largest X-ray API manufacturing facility, supplying one-third of the global market supply for contrast media. They collaborate with multiple suppliers to help ensure the security of the iodine supply, allowing them to schedule procedures confidently. Working with GE Healthcare as a contrast media supplier across multiple modalities may enable simplification and the potential for time savings in administration.
Bayer offers an exhaustive portfolio of contrast media for CT scan, X-ray, and magnetic resonance imaging (MRI) devices, as well as informatics solutions and a medical imaging platform that provides access to applications, including those powered by AI. Bayer's radiology portfolio includes everything from contrast media to devices that help radiologists in their mission to help patients suffering from cardiovascular disease with early diagnosis and targeted treatment.
Recent Development by Key Players
GE Healthcare (US-based healthcare technology and diagnostics company) has expanded its active pharmaceutical ingredient (API) manufacturing facility in Lindesnes, Norway, to increase the production capacity of contrast media by 30% at its site.
Samsung Medison and Bracco Imaging collaborated to pioneer a new area for diagnostic ultrasound device and contrast agent. This partnership is to create synergy in research and development and market exploration by combining the techniques and marketing capabilities of Samsung Medison
Key Players Covered in the Report
Some of the major players operating in the contrast media market include GE HealthCare, Bracco, Bayer AG, Guerbet, DAIICHI SANKYO COMPANY, LIMITED, Lantheus, TAEJOON PHARM, Magnus Health, Nano THERAPEUTICS PVT.LTD., and Trivitron Healthcare.
The Contrast Media Market report offers a comprehensive market segmentation analysis along with an estimation for the forecast period 2025–2030.
Segments Covered in the Report
- By Media Type
- Iodinated Contrast Media
- Gadolinium-Based Contrast Media
- Microbubble Contrast Media
- Barium-Based Contrast Media
- Others
- By Indication
- Cardiovascular Disorders
- Cancer
- Gastrointestinal Disorders
- Musculoskeletal Disorders
- Neurological Disorders
- Nephrological Disorders
- By Modality
- X-Ray
- Computed Tomography (CT)
- Magnetic Resonance Imaging (MRI)
- Catheterization Laboratory
- Ultrasound
- Others
- By Route of Administration
- Intravascular Route
- Oral Route
- Rectal Route
- Others
- By Application
- Radiology
- Interventional Radiology
- Interventional Cardiology
Region Covered in the Report
- North America
- Europe
- Germany
- U.K.
- France
- Italy
- Spain
- Russia
- Rest of Europe
- Asia-Pacific (APAC)
- China
- Japan
- India
- South Korea
- Rest of Asia-Pacific
- Rest of the World (RoW)
- Brazil
- Saudi Arabia
- South Africa
- U.A.E.
- Other Countries
.png)
To explore more about this report - Request a free sample copy
