Status : Published | Published On : Jan, 2021 | Report Code : VRICT5011 | Industry : ICT & Media | Available Format :
![]() |
Page : 171 |
Industry Overview
The global geographic information system (GIS) market was valued at USD 8.3 billion in 2020 and is further expected to become USD 15.7 billion by 2027. This market is further expected to witness CAGR of 11.5% during the forecast period 2021 – 2027. The increasing popularity of this market is attributed towards extensive utilization of GIS by several business organizations to develop maps that help in efficiently performing analysis, solving complex problems, sharing information and communicating across the globe. This system is further enabling the organization to perform this task in an effective manner.
Market Segmentation
Insight by Components
The GIS market on the basis of the component is segmented into hardware, software, and services. Among all these components, the software segment holds the largest share is expected to witness a CAGR of 9.2% during the forecast period. Software-based GIS is extensively being used in spatial data analysis, spatial data processing, spatial database management systems, and digital mapping. Moreover, the services segment is expected to observe increasing demand pertaining to excessive utilization for spatial data analytics in several applications such as taxi aggregators, urban planning and food delivery.
Insight by Project Size
On the basis of project size, the GIS market is categorized into small medium and large projects. Among these, medium size projects are the most commonly executed due to the involvement of governments in developing as well as developed countries.
Insight by Application
On the basis of application, the global GIS market is segmented into water & wastewater, government, aerospace & defense, oil & gas exploration, engineering & business services, oil & gas refining, healthcare, transportation & logistics, telecommunications, and others. Engineering and business services segment is expected to witness the highest CAGR of 11.9% during the forecast period. Due to rapid growth in urbanization, it is expected to further enhance the developmental activities in the construction and infrastructure sector. The massive usage of GIS technique in the analysis of urban planning such as use value of the land is further enhancing the growth of the market.
Moreover, extensive implementation of positioning technique in transport and logistics is expected to further increase the demand for GIS in the global market. Furthermore, in agriculture, the technology is adopted in order to ensure and enhance the effectiveness and efficiency of farming methods.
Industry Dynamics
Growth Drivers
The increasing amalgamation of GIS system with traditional technology has upgraded the business intelligence systems of the organization. Furthermore, the combination of IoT devices and GIS system helps the users in accessing accurate data along with using geospatial data analysis. Moreover, the increasing demand for location-based services such as control of a valve and real-time status is driving the growth of the GIS market across the globe. Additionally, the increasing usage of GIS systems in the construction sector is expected to further exaggerate the growth of this market during the forecast period.
Due to the exponential increase in geospatial information has further resulted in the extensive adoption of these systems in several business organizations across various application areas such as advertisement and marketing division. It has been observed that the GIS application is the major beneficiary of the easily accessible geospatial data. Moreover, expanding the number of mobile device users and other technologies and SaaS-based cloud-computing are the major factors that are the growth of GIS market across the globe.
Challenges
The initial high set up cost of the GIS system and non-existence of authentic spatial data is the major factor hindering the growth of this market across the globe. Moreover, it has been observed that an ample amount of capital is required for developing a database and managing the overall GIS system. As a result, small and medium enterprises and government of emerging economies are not implementing GIS technique which is further restraining the growth of the GIS market.
Industry Ecosystem
Globally industry players are leveraging market growth through extensive application of GIS in various fields. Several key industry players are providing state-of-the-art software applications to its users that are further bolstering the growth of the GIS market.
Geographic Overview
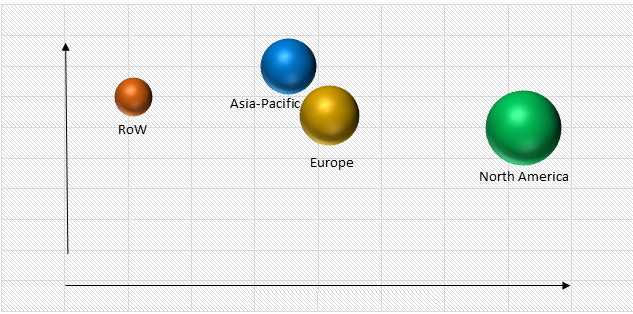
Geographically, Asia-Pacific is expected to witness the fastest growth of 11.9% during the forecast period. The growth of this market in this region is attributed towards increasing implementation of the geospatial system by the business organizations in several sectors such as agriculture, mining and manufacturing, construction and insurance sectors that are enabling them to undertake informed decisions and identify potential strengths of their organization.
GLOBAL GIS MARKET, BY REGION (2020)
Moreover, it has been observed that geospatial technologies are extensively being used for agricultural and rural development in this region. Furthermore, excessive usage of mapping and surveying technologies are driving the growth of the GIS market in this region. Moreover, the implementation of the GIS system in various countries such as India and China are expected to further drive the growth of this market during the forecast period.
Competitive Insight
Some of the major players operating in the global GIS industry include Environmental Systems Research Institute Inc. (Esri), Macdonald & Company, Pitney Bowes Inc., Dettwiler and Associates Ltd., PASCO CORPORATION, SuperMap Software Co. Ltd., Ubisense Group Plc., Bentley Systems Incorporated, Schneider Electric SE and Autodesk Inc.
1. Research Overview
1.1. The Report Offers
1.2. Market Coverage
1.2.1. By Component
1.2.2. By Project Size
1.2.3. By Application
1.2.4. By Region
1.3. Research Phases
1.4. Limitations
1.5. Market Size Estimations and Forecast
1.5.1. Data Sources
1.5.1.1. Primary Research
1.5.1.2. Secondary Research
1.5.2. Methodology
1.5.2.1. Data Exploration
1.5.2.2. Forecast Parameters
1.5.2.3. Data Validation
1.5.2.4. Assumptions
1.5.3. Study Period & Data Reporting Unit
2. Executive Summary
3. Market Definition
3.1. By Component
3.1.1. Hardware
3.1.2. Software
3.1.3. Services
3.2. By Project Size
3.2.1. Small
3.2.2. Medium
3.2.3. Large
3.3. By Application
3.3.1. Water & Wastewater
3.3.2. Government
3.3.3. Aerospace & Defense
3.3.4. Oil & Gas Exploration
3.3.5. Engineering & Business Services
3.3.6. Oil & Gas Refining
3.3.7. Healthcare
3.3.8. Transportation & Logistics
3.3.9. Telecommunications
3.3.10. Others
4. Industry Overview
4.1. Industry Dynamics
4.1.1. Major Drivers
4.1.2. Major Restraints
4.1.3. Key Trends
4.1.4. Key Opportunities
4.2. Industry Ecosystem
4.2.1. Porter’s Five Forces Analysis
4.2.2. Value Chain Analysis
4.2.3. Pricing Analysis
4.3. Competitive Insight
4.3.1. Competitive Scenario
4.3.2. Market Rank of Key Players
5. Global Market Estimate and Forecast
5.1. By Component
5.2. By Project Size
5.3. By Application
5.4. By Region
6. North America Market Estimate and Forecast
6.1. By Component
6.2. By Project Size
6.3. By Application
6.4. By Country
6.4.1. U.S. Market Estimate and Forecast
6.4.1.1. By Component
6.4.1.2. By Project Size
6.4.1.3. By Application
6.4.2. Canada Market Estimate and Forecast
6.4.2.1. By Component
6.4.2.2. By Project Size
6.4.2.3. By Application
6.4.3. Mexico Market Estimate and Forecast
6.4.3.1. By Component
6.4.3.2. By Project Size
6.4.3.3. By Application
7. Europe Market Estimate and Forecast
7.1. By Component
7.2. By Project Size
7.3. By Application
7.4. By Country
7.4.1. Germany Market Estimate and Forecast
7.4.1.1. By Component
7.4.1.2. By Project Size
7.4.1.3. By Application
7.4.2. U.K. Market Estimate and Forecast
7.4.2.1. By Component
7.4.2.2. By Project Size
7.4.2.3. By Application
7.4.3. France Market Estimate and Forecast
7.4.3.1. By Component
7.4.3.2. By Project Size
7.4.3.3. By Application
7.4.4. Russia Market Estimate and Forecast
7.4.4.1. By Component
7.4.4.2. By Project Size
7.4.4.3. By Application
7.4.5. Rest of Europe Market Estimate and Forecast
7.4.5.1. By Component
7.4.5.2. By Project Size
7.4.5.3. By Application
8. Asia-Pacific Market Estimate and Forecast
8.1. By Component
8.2. By Project Size
8.3. By Application
8.4. By Country
8.4.1. China Market Estimate and Forecast
8.4.1.1. By Component
8.4.1.2. By Project Size
8.4.1.3. By Application
8.4.2. Japan Market Estimate and Forecast
8.4.2.1. By Component
8.4.2.2. By Project Size
8.4.2.3. By Application
8.4.3. India Market Estimate and Forecast
8.4.3.1. By Component
8.4.3.2. By Project Size
8.4.3.3. By Application
8.4.4. Rest of Asia-Pacific Market Estimate and Forecast
8.4.4.1. By Component
8.4.4.2. By Project Size
8.4.4.3. By Application
9. RoW Market Estimate and Forecast
9.1. By Component
9.2. By Project Size
9.3. By Application
9.4. By Country
9.4.1. Brazil Market Estimate and Forecast
9.4.1.1. By Component
9.4.1.2. By Project Size
9.4.1.3. By Application
9.4.2. Saudi Arabia Market Estimate and Forecast
9.4.2.1. By Component
9.4.2.2. By Project Size
9.4.2.3. By Application
9.4.3. Other Countries Market Estimate and Forecast
9.4.3.1. By Component
9.4.3.2. By Project Size
9.4.3.3. By Application
10. Company Profiles
10.1. Environmental Systems Research Institute Inc.
10.1.1. Snapshot
10.1.2. Overview
10.1.3. Offerings
10.1.4. Financial Insight
10.1.5. Recent Developments
10.2. Macdonald & Company
10.2.1. Snapshot
10.2.2. Overview
10.2.3. Offerings
10.2.4. Financial Insight
10.2.5. Recent Developments
10.3. Pitney Bowes Inc.
10.3.1. Snapshot
10.3.2. Overview
10.3.3. Offerings
10.3.4. Financial Insight
10.3.5. Recent Developments
10.4. Dettwiler and Associates Ltd.
10.4.1. Snapshot
10.4.2. Overview
10.4.3. Offerings
10.4.4. Financial Insight
10.4.5. Recent Developments
10.5. PASCO CORPORATION
10.5.1. Snapshot
10.5.2. Overview
10.5.3. Offerings
10.5.4. Financial Insight
10.5.5. Recent Developments
10.6. Ubisense Group Plc.
10.6.1. Snapshot
10.6.2. Overview
10.6.3. Offerings
10.6.4. Financial Insight
10.6.5. Recent Developments
10.7. Bentley Systems Incorporated
10.7.1. Snapshot
10.7.2. Overview
10.7.3. Offerings
10.7.4. Financial Insight
10.7.5. Recent Developments
10.8. Schneider Electric SE
10.8.1. Snapshot
10.8.2. Overview
10.8.3. Offerings
10.8.4. Financial Insight
10.8.5. Recent Developments
10.9. Autodesk Inc.
10.9.1. Snapshot
10.9.2. Overview
10.9.3. Offerings
10.9.4. Financial Insight
10.9.5. Recent Developments
11. Appendix
11.1. Abbreviations
11.2. Exchange Rates
List of Tables
Table 1 Sources
Table 2 Study Periods
Table 3 Data Reporting Unit
Table 4 Global GIS Market Size, by Component, 2015 – 2020 (USD Million)
Table 5 Global GIS Market Size, by Component, 2021 – 2027 (USD Million)
Table 6 Global GIS Market Size, by Project Size, 2015 – 2020 (USD Million)
Table 7 Global GIS Market Size, by Project Size, 2021 – 2027 (USD Million)
Table 8 Global GIS Market Size, by Application, 2015 – 2020 (USD Million)
Table 9 Global GIS Market Size, by Application, 2021 – 2027 (USD Million)
Table 10 Global GIS Market Size, by Region, 2015 – 2020 (USD Million)
Table 11 Global GIS Market Size, by Region, 2021 – 2027 (USD Million)
Table 12 North America GIS Market Size, by Component, 2015 – 2020 (USD Million)
Table 13 North America GIS Market Size, by Component, 2021 – 2027 (USD Million)
Table 14 North America GIS Market Size, by Project Size, 2015 – 2020 (USD Million)
Table 15 North America GIS Market Size, by Project Size, 2021 – 2027 (USD Million)
Table 16 North America GIS Market Size, by Application, 2015 – 2020 (USD Million)
Table 17 North America GIS Market Size, by Application, 2021 – 2027 (USD Million)
Table 18 North America GIS Market Size, by Country, 2015 – 2020 (USD Million)
Table 19 North America GIS Market Size, by Country, 2021 – 2027 (USD Million)
Table 20 U.S. GIS Market Size, by Component, 2015 – 2020 (USD Million)
Table 21 U.S. GIS Market Size, by Component, 2021 – 2027 (USD Million)
Table 22 U.S. GIS Market Size, by Project Size, 2015 – 2020 (USD Million)
Table 23 U.S. GIS Market Size, by Project Size, 2021 – 2027 (USD Million)
Table 24 U.S. GIS Market Size, by Application, 2015 – 2020 (USD Million)
Table 25 U.S. GIS Market Size, by Application, 2021 – 2027 (USD Million)
Table 26 Canada GIS Market Size, by Component, 2015 – 2020 (USD Million)
Table 27 Canada GIS Market Size, by Component, 2021 – 2027 (USD Million)
Table 28 Canada GIS Market Size, by Project Size, 2015 – 2020 (USD Million)
Table 29 Canada GIS Market Size, by Project Size, 2021 – 2027 (USD Million)
Table 30 Canada GIS Market Size, by Application, 2015 – 2020 (USD Million)
Table 31 Canada GIS Market Size, by Application, 2021 – 2027 (USD Million)
Table 32 Mexico GIS Market Size, by Component, 2015 – 2020 (USD Million)
Table 33 Mexico GIS Market Size, by Component, 2021 – 2027 (USD Million)
Table 34 Mexico GIS Market Size, by Project Size, 2015 – 2020 (USD Million)
Table 35 Mexico GIS Market Size, by Project Size, 2021 – 2027 (USD Million)
Table 36 Mexico GIS Market Size, by Application, 2015 – 2020 (USD Million)
Table 37 Mexico GIS Market Size, by Application, 2021 – 2027 (USD Million)
Table 38 Europe GIS Market Size, by Component, 2015 – 2020 (USD Million)
Table 39 Europe GIS Market Size, by Component, 2021 – 2027 (USD Million)
Table 40 Europe GIS Market Size, by Project Size, 2015 – 2020 (USD Million)
Table 41 Europe GIS Market Size, by Project Size, 2021 – 2027 (USD Million)
Table 42 Europe GIS Market Size, by Application, 2015 – 2020 (USD Million)
Table 43 Europe GIS Market Size, by Application, 2021 – 2027 (USD Million)
Table 44 Europe GIS Market Size, by Country, 2015 – 2020 (USD Million)
Table 45 Europe GIS Market Size, by Country, 2021 – 2027 (USD Million)
Table 46 Germany GIS Market Size, by Component, 2015 – 2020 (USD Million)
Table 47 Germany GIS Market Size, by Component, 2021 – 2027 (USD Million)
Table 48 Germany GIS Market Size, by Project Size, 2015 – 2020 (USD Million)
Table 49 Germany GIS Market Size, by Project Size, 2021 – 2027 (USD Million)
Table 50 Germany GIS Market Size, by Application, 2015 – 2020 (USD Million)
Table 51 Germany GIS Market Size, by Application, 2021 – 2027 (USD Million)
Table 52 France GIS Market Size, by Component, 2015 – 2020 (USD Million)
Table 53 France GIS Market Size, by Component, 2021 – 2027 (USD Million)
Table 54 France GIS Market Size, by Project Size, 2015 – 2020 (USD Million)
Table 55 France GIS Market Size, by Project Size, 2021 – 2027 (USD Million)
Table 56 France GIS Market Size, by Application, 2015 – 2020 (USD Million)
Table 57 France GIS Market Size, by Application, 2021 – 2027 (USD Million)
Table 58 U.K. GIS Market Size, by Component, 2015 – 2020 (USD Million)
Table 59 U.K. GIS Market Size, by Component, 2021 – 2027 (USD Million)
Table 60 U.K. GIS Market Size, by Project Size, 2015 – 2020 (USD Million)
Table 61 U.K. GIS Market Size, by Project Size, 2021 – 2027 (USD Million)
Table 62 U.K. GIS Market Size, by Application, 2015 – 2020 (USD Million)
Table 63 U.K. GIS Market Size, by Application, 2021 – 2027 (USD Million)
Table 64 Russia GIS Market Size, by Component, 2015 – 2020 (USD Million)
Table 65 Russia GIS Market Size, by Component, 2021 – 2027 (USD Million)
Table 66 Russia GIS Market Size, by Project Size, 2015 – 2020 (USD Million)
Table 67 Russia GIS Market Size, by Project Size, 2021 – 2027 (USD Million)
Table 68 Russia GIS Market Size, by Application, 2015 – 2020 (USD Million)
Table 69 Russia GIS Market Size, by Application, 2021 – 2027 (USD Million)
Table 70 Rest of Europe GIS Market Size, by Component, 2015 – 2020 (USD Million)
Table 71 Rest of Europe GIS Market Size, by Component, 2021 – 2027 (USD Million)
Table 72 Rest of Europe GIS Market Size, by Project Size, 2015 – 2020 (USD Million)
Table 73 Rest of Europe GIS Market Size, by Project Size, 2021 – 2027 (USD Million)
Table 74 Rest of Europe GIS Market Size, by Application, 2015 – 2020 (USD Million)
Table 75 Rest of Europe GIS Market Size, by Application, 2021 – 2027 (USD Million)
Table 76 Asia-Pacific GIS Market Size, by Component, 2015 – 2020 (USD Million)
Table 77 Asia-Pacific GIS Market Size, by Component, 2021 – 2027 (USD Million)
Table 78 Asia-Pacific GIS Market Size, by Project Size, 2015 – 2020 (USD Million)
Table 79 Asia-Pacific GIS Market Size, by Project Size, 2021 – 2027 (USD Million)
Table 80 Asia-Pacific GIS Market Size, by Application, 2015 – 2020 (USD Million)
Table 81 Asia-Pacific GIS Market Size, by Application, 2021 – 2027 (USD Million)
Table 82 Asia-Pacific GIS Market Size, by Country, 2015 – 2020 (USD Million)
Table 83 Asia-Pacific GIS Market Size, by Country, 2021 – 2027 (USD Million)
Table 84 Japan GIS Market Size, by Component, 2015 – 2020 (USD Million)
Table 85 Japan GIS Market Size, by Component, 2021 – 2027 (USD Million)
Table 86 Japan GIS Market Size, by Project Size, 2015 – 2020 (USD Million)
Table 87 Japan GIS Market Size, by Project Size, 2021 – 2027 (USD Million)
Table 88 Japan GIS Market Size, by Application, 2015 – 2020 (USD Million)
Table 89 Japan GIS Market Size, by Application, 2021 – 2027 (USD Million)
Table 90 China GIS Market Size, by Component, 2015 – 2020 (USD Million)
Table 91 China GIS Market Size, by Component, 2021 – 2027 (USD Million)
Table 92 China GIS Market Size, by Project Size, 2015 – 2020 (USD Million)
Table 93 China GIS Market Size, by Project Size, 2021 – 2027 (USD Million)
Table 94 China GIS Market Size, by Application, 2015 – 2020 (USD Million)
Table 95 China GIS Market Size, by Application, 2021 – 2027 (USD Million)
Table 96 India GIS Market Size, by Component, 2015 – 2020 (USD Million)
Table 97 India GIS Market Size, by Component, 2021 – 2027 (USD Million)
Table 98 India GIS Market Size, by Project Size, 2015 – 2020 (USD Million)
Table 99 India GIS Market Size, by Project Size, 2021 – 2027 (USD Million)
Table 100 India GIS Market Size, by Application, 2015 – 2020 (USD Million)
Table 101 India GIS Market Size, by Application, 2021 – 2027 (USD Million)
Table 102 Rest of Asia-Pacific GIS Market Size, by Component, 2015 – 2020 (USD Million)
Table 103 Rest of Asia-Pacific GIS Market Size, by Component, 2021 – 2027 (USD Million)
Table 104 Rest of Asia-Pacific GIS Market Size, by Project Size, 2015 – 2020 (USD Million)
Table 105 Rest of Asia-Pacific GIS Market Size, by Project Size, 2021 – 2027 (USD Million)
Table 106 Rest of Asia-Pacific GIS Market Size, by Application, 2015 – 2020 (USD Million)
Table 107 Rest of Asia-Pacific GIS Market Size, by Application, 2021 – 2027 (USD Million)
Table 108 RoW GIS Market Size, by Component, 2015 – 2020 (USD Million)
Table 109 RoW GIS Market Size, by Component, 2021 – 2027 (USD Million)
Table 110 RoW GIS Market Size, by Project Size, 2015 – 2020 (USD Million)
Table 111 RoW GIS Market Size, by Project Size, 2021 – 2027 (USD Million)
Table 112 RoW GIS Market Size, by Application, 2015 – 2020 (USD Million)
Table 113 RoW GIS Market Size, by Application, 2021 – 2027 (USD Million)
Table 114 RoW GIS Market Size, by Country, 2015 – 2020 (USD Million)
Table 115 RoW GIS Market Size, by Country, 2021 – 2027 (USD Million)
Table 116 Brazil GIS Market Size, by Component, 2015 – 2020 (USD Million)
Table 117 Brazil GIS Market Size, by Component, 2021 – 2027 (USD Million)
Table 118 Brazil GIS Market Size, by Project Size, 2015 – 2020 (USD Million)
Table 119 Brazil GIS Market Size, by Project Size, 2021 – 2027 (USD Million)
Table 120 Brazil GIS Market Size, by Application, 2015 – 2020 (USD Million)
Table 121 Brazil GIS Market Size, by Application, 2021 – 2027 (USD Million)
Table 122 Saudi Arabia GIS Market Size, by Component, 2015 – 2020 (USD Million)
Table 123 Saudi Arabia GIS Market Size, by Component, 2021 – 2027 (USD Million)
Table 124 Saudi Arabia GIS Market Size, by Project Size, 2015 – 2020 (USD Million)
Table 125 Saudi Arabia GIS Market Size, by Project Size, 2021 – 2027 (USD Million)
Table 126 Saudi Arabia GIS Market Size, by Application, 2015 – 2020 (USD Million)
Table 127 Saudi Arabia GIS Market Size, by Application, 2021 – 2027 (USD Million)
Table 128 Other Countries GIS Market Size, by Component, 2015 – 2020 (USD Million)
Table 129 Other Countries GIS Market Size, by Component, 2021 – 2027 (USD Million)
Table 130 Other Countries GIS Market Size, by Project Size, 2015 – 2020 (USD Million)
Table 131 Other Countries GIS Market Size, by Project Size, 2021 – 2027 (USD Million)
Table 132 Other Countries GIS Market Size, by Application, 2015 – 2020 (USD Million)
Table 133 Other Countries GIS Market Size, by Application, 2021 – 2027 (USD Million)
Table 134 Snapshot – Environmental Systems Research Institute Inc.
Table 135 Snapshot – Macdonald & Company
Table 136 Snapshot – Pitney Bowes Inc.
Table 137 Snapshot – Dettwiler and Associates Ltd.
Table 138 Snapshot – PASCO CORPORATION
Table 139 Snapshot – Ubisense Group Plc.
Table 140 Snapshot – Bentley Systems Incorporated
Table 141 Snapshot – Schneider Electric SE
Table 142 Snapshot – Autodesk Inc.
List of Figures
Figure 1 Market Coverage
Figure 2 Research Phases
Figure 3 Secondary Sources for Different Parameters
Figure 4 Methodology
Figure 5 Data Mining & Exploration
Figure 6 Data Triangulation
Figure 7 Assumptions for Market Estimation and Forecast
Figure 8 Executive Summary
Figure 9 Global GIS Market - Growth Drivers and Restraints
Figure 10 Competitive Benchmark
Figure 11 Global GIS Market Highlight
Figure 12 Global GIS Market Size, by Component, 2015 – 2027 (USD Million)
Figure 13 Global GIS Market Size, by Project Size, 2015 – 2027 (USD Million)
Figure 14 Global GIS Market Size, by Application, 2015 – 2027 (USD Million)
Figure 15 Global GIS Market Size, by Region, 2015 – 2027 (USD Million)
Figure 16 North America GIS Market Highlight
Figure 17 North America GIS Market Size, by Component, 2015 – 2027 (USD Million)
Figure 18 North America GIS Market Size, by Project Size, 2015 – 2027 (USD Million)
Figure 19 North America GIS Market Size, by Application, 2015 – 2027 (USD Million)
Figure 20 North America GIS Market Size, by Country, 2015 – 2027 (USD Million)
Figure 21 U.S. GIS Market Size, by Component, 2015 – 2027 (USD Million)
Figure 22 U.S. GIS Market Size, by Project Size, 2015 – 2027 (USD Million)
Figure 23 U.S. GIS Market Size, by Application, 2015 – 2027 (USD Million)
Figure 24 Canada GIS Market Size, by Component, 2015 – 2027 (USD Million)
Figure 25 Canada GIS Market Size, by Project Size, 2015 – 2027 (USD Million)
Figure 26 Canada GIS Market Size, by Application, 2015 – 2027 (USD Million)
Figure 27 Mexico GIS Market Size, by Component, 2015 – 2027 (USD Million)
Figure 28 Mexico GIS Market Size, by Project Size, 2015 – 2027 (USD Million)
Figure 29 Mexico GIS Market Size, by Application, 2015 – 2027 (USD Million)
Figure 30 Europe GIS Market Highlight
Figure 31 Europe GIS Market Size, by Component, 2015 – 2027 (USD Million)
Figure 32 Europe GIS Market Size, by Project Size, 2015 – 2027 (USD Million)
Figure 33 Europe GIS Market Size, by Application, 2015 – 2027 (USD Million)
Figure 34 Europe GIS Market Size, by Country, 2015 – 2027 (USD Million)
Figure 35 Germany GIS Market Size, by Component, 2015 – 2027 (USD Million)
Figure 36 Germany GIS Market Size, by Project Size, 2015 – 2027 (USD Million)
Figure 37 Germany GIS Market Size, by Application, 2015 – 2027 (USD Million)
Figure 38 France GIS Market Size, by Component, 2015 – 2027 (USD Million)
Figure 39 France GIS Market Size, by Project Size, 2015 – 2027 (USD Million)
Figure 40 France GIS Market Size, by Application, 2015 – 2027 (USD Million)
Figure 41 U.K. GIS Market Size, by Component, 2015 – 2027 (USD Million)
Figure 42 U.K. GIS Market Size, by Project Size, 2015 – 2027 (USD Million)
Figure 43 U.K. GIS Market Size, by Application, 2015 – 2027 (USD Million)
Figure 44 Russia GIS Market Size, by Component, 2015 – 2027 (USD Million)
Figure 45 Russia GIS Market Size, by Project Size, 2015 – 2027 (USD Million)
Figure 46 Russia GIS Market Size, by Application, 2015 – 2027 (USD Million)
Figure 47 Rest of Europe GIS Market Size, by Component, 2015 – 2027 (USD Million)
Figure 48 Rest of Europe GIS Market Size, by Project Size, 2015 – 2027 (USD Million)
Figure 49 Rest of Europe GIS Market Size, by Application, 2015 – 2027 (USD Million)
Figure 50 Asia-Pacific GIS Market Highlight
Figure 51 Asia-Pacific GIS Market Size, by Component, 2015 – 2027 (USD Million)
Figure 52 Asia-Pacific GIS Market Size, by Project Size, 2015 – 2027 (USD Million)
Figure 53 Asia-Pacific GIS Market Size, by Application, 2015 – 2027 (USD Million)
Figure 54 Asia-Pacific GIS Market Size, by Country, 2015 – 2027 (USD Million)
Figure 55 Japan GIS Market Size, by Component, 2015 – 2027 (USD Million)
Figure 56 Japan GIS Market Size, by Project Size, 2015 – 2027 (USD Million)
Figure 57 Japan GIS Market Size, by Application, 2015 – 2027 (USD Million)
Figure 58 China GIS Market Size, by Component, 2015 – 2027 (USD Million)
Figure 59 China GIS Market Size, by Project Size, 2015 – 2027 (USD Million)
Figure 60 China GIS Market Size, by Application, 2015 – 2027 (USD Million)
Figure 61 India GIS Market Size, by Component, 2015 – 2027 (USD Million)
Figure 62 India GIS Market Size, by Project Size, 2015 – 2027 (USD Million)
Figure 63 India GIS Market Size, by Application, 2015 – 2027 (USD Million)
Figure 64 Rest of Asia-Pacific GIS Market Size, by Component, 2015 – 2027 (USD Million)
Figure 65 Rest of Asia-Pacific GIS Market Size, by Project Size, 2015 – 2027 (USD Million)
Figure 66 Rest of Asia-Pacific GIS Market Size, by Application, 2015 – 2027 (USD Million)
Figure 67 RoW GIS Market Highlight
Figure 68 RoW GIS Market Size, by Component, 2015 – 2027 (USD Million)
Figure 69 RoW GIS Market Size, by Project Size, 2015 – 2027 (USD Million)
Figure 70 RoW GIS Market Size, by Application, 2015 – 2027 (USD Million)
Figure 71 RoW GIS Market Size, by Country, 2015 – 2027 (USD Million)
Figure 72 Brazil GIS Market Size, by Component, 2015 – 2027 (USD Million)
Figure 73 Brazil GIS Market Size, by Project Size, 2015 – 2027 (USD Million)
Figure 74 Brazil GIS Market Size, by Application, 2015 – 2027 (USD Million)
Figure 75 Saudi Arabia GIS Market Size, by Component, 2015 – 2027 (USD Million)
Figure 76 Saudi Arabia GIS Market Size, by Project Size, 2015 – 2027 (USD Million)
Figure 77 Saudi Arabia GIS Market Size, by Application, 2015 – 2027 (USD Million)
Figure 78 Other Countries GIS Market Size, by Component, 2015 – 2027 (USD Million)
Figure 79 Other Countries GIS Market Size, by Project Size, 2015 – 2027 (USD Million)
Figure 80 Other Countries GIS Market Size, by Application, 2015 – 2027 (USD Million)
Global GIS Market Coverage
Component Insight and Forecast 2015 - 2027
Project Size Insight and Forecast 2015 - 2027
Application Insight and Forecast 2015 - 2027
Geographical Segmentation
GIS Market by Region
North America
Europe
Asia-Pacific
Rest of the World (RoW)
Vynz Research know in your business needs, you required specific answers pertaining to the market, Hence, our experts and analyst can provide you the customized research support on your specific needs.
After the purchase of current report, you can claim certain degree of free customization within the scope of the research.
Please let us know, how we can serve you better with your specific requirements to your research needs. Vynz research promises for quick reversal for your current business requirements.
Geographic Information System (GIS) Market