3D Scanner Market Overview
The global 3D scanner market is expected to grow from USD 1.2 billion in 2023 to USD 3.12 billion by the end of 2030 at a compound annual growth rate (CAGR) of 7.5% during the forecast period ranging from 2025 to 2030.
A 3D scanner is an advanced machine that captures accurate measurements of any physical object along with its visual representations over and above its appearance and weight. This data is then converted into specific digital models depending on different applications. Typically, 3D scanners improve prototyping and also enhance quality control. It is widely used across a wide range of industry verticals such as automobile, healthcare, aerospace and defense, architecture, construction, energy and power, helping them to link the digital and physical worlds and driving innovations across a wide range of sectors.
Furthermore, the rising usage of high-performance Complementary Metal-Oxide Semiconductor (CMOS) sensors in place of Charge-Coupled Device (CCD) imagers is predicted to boost market growth.
3D Scanner Market Segmentation
Insight by Type
The global 3D scanner market is divided by its types into tripod-mounted, fixed CMM-based, portable CMM-based, and desktop segments. Out of these segments, the fixed CMM-based segment holds the larger share. It will contribute a larger share of the revenue during the forecast period due to higher efficiency and ability to capture the entire object from different angles. The portable CMM-based segment, on the other hand, will also grow quite significantly due to the additional convenience of its use.
Insight by Range
According to the range of the scanners, the global 3D scanner market is divided into short-range, medium-range, and long-range segments. Out of them, the short-range segment will dominate the market in terms of revenue share during the forecast period due to the availability of low-cost and portable devices and growing awareness of the varied applications.
Insight by Offering
The global 3D scanner market is also divided by offering into hardware, software, and services segments. Out of these three segments, the hardware segment is expected to dominate during the forecast period in terms of revenue due to the rise in demand for gears for the 3D scanner's technological enhancements in printing and imaging applications.
Insight by Application
The global 3D scanner market is split by applications into quality control & inspection, reverse engineering, rapid prototyping, and face/body scanning segments. Among all these segments, the quality control and inspection segment is expected to grow more and dominate the market during the forecast period in terms of revenue share due to its ability to respond quickly to quality issues.
Insight by End User
Different end users also divide the global 3D scanner market into automotive, healthcare, aerospace & defense, architecture & construction, energy & power, petrochemicals, tunnel & mining, artifacts & heritage preservation, and other segments. Out of all these segmentations, the automotive segment is expected to dominate the market in terms of revenue share during the forecast period due to the benefits offered in automobile designing, material processing, manufacturing, and even plant inspecting.
Insight by Services
Based on services, the global 3D scanner market is divided into reverse engineering, rapid prototyping and face-body scanning segment. Out of these segments, the reverse engineering segment is expected to dominate the market due to higher precision in the digitization of the physical objects by capturing the surface details, shape, and size of and creating an accurate digital point cloud or mesh.
Global 3D Scanner Market Report Coverage
|
Report Metric
|
Details
|
|
Historical Period
|
2020 - 2024
|
|
Base Year Considered
|
2025
|
|
Forecast Period
|
2026 - 2035
|
|
Market Size in 2025
|
U.S.D. 1.2 Billion
|
|
Revenue Forecast in 2035
|
U.S.D. 3.12 Billion
|
|
Growth Rate
|
7.5%
|
|
Segments Covered in the Report
|
By Type Outlook, By Range Outlook and By Offering Outlook, By Application Outlook, By End User Outlook.
|
|
Report Scope
|
Market Trends, Drivers, and Restraints; Revenue Estimation and Forecast; Segmentation Analysis; Companies’ Strategic Developments; Market Share Analysis of Key Players; Company Profiling
|
|
Regions Covered in the Report
|
North America, Europe, Asia-Pacific, Middle East, and Rest of the World
|
Industry Dynamics
3D Scanner Industry Trends
The most notable trends include the Internet of Things (IoT), mixed authenticity, and the rising concurrence of wearable devices in automotive production as well as in aerospace designing applications. Furthermore, coupling phones and tablets with top-class systems to simplify ease of use, as well as the notable shift for handiness and portability, are significant trends that have resulted in smaller and handier device development.
3D Scanner Market Growth Drivers
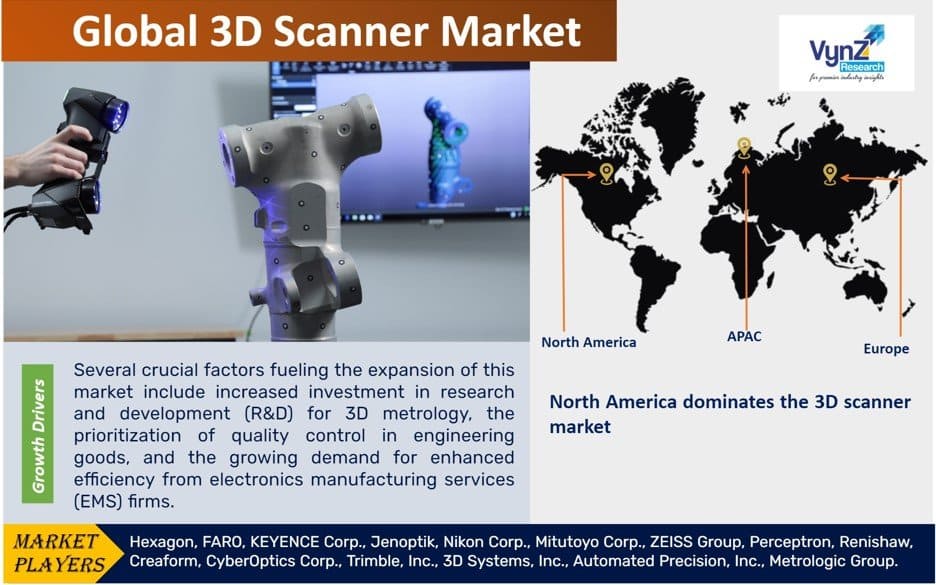
One of the most significant growth drivers of the global 3D scanner market is the rising investment in research and development for 3D metrology. In addition, there is an additional focus on quality control in the produced goods as well as the rise in demand for higher efficiency from the electronics manufacturing services (EMS) companies. Moreover, most engineering companies are now outsourcing 3D metrology measurement and inspection tasks to service providers for faster processing, lower measurement uncertainty, and enhanced process consistency, thereby fueling market growth.
3D Scanner Market Challenges
The need for accurate lighting is the most significant challenge because little or excess light can be a limitation in accurate scanning. This, along with the lack of proper technical knowledge, hinders the growth of the global 3D scanner market.
3D Scanner Market Opportunities
The rising adoption of cloud computing services and Industry 4.0 practices offers growth prospects to the global 3D scanner market. Moreover, the extensive use of 3D scanners in historical site conservation and the higher use of HD content recording for movies also offer new growth opportunities.
3D Scanner Market Geographic Overview
North America is expected to lead the market during the forecast period due to higher demand for handheld devices and growing integration in automated equipment by different industries.
Asia-Pacific market is expected to grow at a fast rate as well during the same period due to the extensive deployment of 3D scanning devices in aerospace and defense sectors. It is also used in automotive component design to cater to the large number of equipment and model varieties in vehicle design.
3D Scanner Market Competitive Insight
The global 3D scanner market is moderately competitive and involves of some major players. In terms of market share, few of the key players presently dominate the market. Nonetheless, with technological advancement and quality facility provision, mid-size to smaller firms are increasing their market presence by presenting new services with fewer prices. Companies, like Nikon Metrology NV, Autodesk, Inc. Hexagon AB hold a substantial market share in the 3D scanner market.
Hexagon AB is a multinational industrial technology company. Headquartered in Stockholm, Sweden. It is the global leader in digital reality solutions, combining sensor, software and autonomous technologies. Company's solutions harness the rapidly-increasing amounts of data, putting it to work to boost efficiency, productivity, quality and safety across industrial, manufacturing, infrastructure, public sector and mobility applications.
FARO provides the most precise 3D measurement, imaging and realization technologies for manufacturing, construction and public safety analytics industries.
Some of the major players in 3D scanner market are Hexagon, FARO, KEYENCE Corp., Jenoptik, Nikon Corp., Mitutoyo Corp., ZEISS Group, Perceptron, Renishaw, Creaform, CyberOptics Corp., Trimble, Inc., 3D Systems, Inc., Automated Precision, Inc., Metrologic Group.
Recent Developments by Key Players
Hexagon’s Manufacturing Intelligence division has launched a new type of high-productivity structured light scanner. Built on a completely reengineered platform, the SmartScan VR800 is the first optical 3D scanner on the market with a motorised zoom lens that enables users to adjust data resolution and measurement volume entirely through software settings.
KEYENCE has launched a new smart camera vision system line, the VS Series. The new system, designed for easy setup, does not require a control panel, nor does it require software to check IP addresses and connections. Rated at IP67, it comes with a built-in laser pointer, four mounting holes for various installation.
The 3D Scanner Market report offers a comprehensive market segmentation analysis along with an estimation for the forecast period 2025–2030.
Segments Covered in the Report
- By Type
- Tripod Mounted
- Fixed CMM Based
- Portable CMM Based
- Desktop
- By Range
- Short Range
- Medium Range
- Long Range
- By Offering Size
- Hardware
- Software
- Services
- By Application
- Quality Control & Inspection
- Reverse Engineering
- Rapid Prototyping
- Face/Body Scanning
- By End-User
- Automotive
- Healthcare
- Dental
- Orthopedics
- Neurosurgery
- Others
- Aerospace & Defense
- Commercial Aircraft
- Space Exploration
- Architecture & Construction
- Plant Scanning
- Outdoor & Indoor Scanning
- Energy & Power
- Petrochemicals
- Tunnel & Mining
- Artifacts & Heritage Preservation
- Others
Region Covered in the Report
- North America
- Europe
- Germany
- U.K.
- France
- Italy
- Spain
- Russia
- Rest of Europe
- Asia-Pacific (APAC)
- China
- Japan
- India
- South Korea
- Rest of Asia-Pacific
- Rest of the World (RoW)
- Brazil
- Saudi Arabia
- South Africa
- U.A.E.
- Other Countries
.png "3D Scanner Market Size")
Source: VynZ Research
.png "3D Scanner Market Analysis")
Source: VynZ Research
