Digital Signage Market Overview
The global digital signage market is expected to grow from USD 21.5 billion in 2023 to USD 34.4 billion by 2030 during the forecast period at a steady CAGR of approximately 6.7%.
Digital signage is usually found in restaurants, retail outlets, hospitals, and other public places and corporate settings. The main purpose of them is to provide relevant information or grab the attention of the passersby. Typically, these are advertisements that depend mainly on specific hardware for marketing messages with high-quality and vibrant content. The other key components of digital signage include a high-resolution display, Content Management System software, media players, and strong network connectivity, where each contributes to the overall operation of the signage.
They are mainly found in public places such as retail outlets, restaurants, hospitals, corporate environments, etc. for providing important information, seeking attention, and for advertisement purposes. Digital signage is mainly dependent on hardware components to provide high-quality content to attract customers with maximum effectiveness from the marketing message.
Digital Signage Market Segmentation
Insight by Component
The global digital signage market is divided according to the different components into hardware, software, and services. The hardware segment is further divided into displays, projectors, and media players. The services segment is further divided into installation and maintenance & support services. Out of all these segments, the hardware segment is expected to grow more during the forecast period and contribute the largest share of the market due to the growing adoption and use of digital signage across several commercial places. It is also attributed to technological advancements in displays and higher resolutions such as 1080p, 4K, and 8K displays as well as the significant development in the infrastructure of developing economies. On the other hand, the software segment will grow more quickly in the same period due to the increasing demand for better content management and data analysis.
Insight by Product
Based on the product, the digital signage market is divided into standalone display and video wall categories. The former has other subsections such as menu boards, kiosks, and billboards and is expected to grow more during the projected period due to increasing transport networks, developed public infrastructure and commercial buildings in developing economies, and integration of interactive displays.
Insight by Display Size
The different sizes of the display boards divide the global digital signage market into less than 32 inches, 32 to 52 inches, and more than 52 inches. Out of these segments, the more than 52 inches segment will grow at a higher CAGR during the forecast period due to developments in OLED technology, video wall, growing preference of businesses for large-size displays both for indoor and outdoor applications.
Insight by Installation Location
The global digital signage market is also divided by installation location into indoor and outdoor segments. Out of these two segments, the outdoor segment is poised for higher growth during the forecast period due to tech developments and businesses opting for more efficient and attractive displays of different sizes.
Insight by Content
According to the content, the global digital signage market is split into broadcast and non-broadcast segments, where the latter is expected to grow more than the former during the forecast period due to higher adoption in several sectors especially in stadia and sports grounds, a rise in demand for better communication, and weather forecast.
Insight by Application
The global digital signage market is also divided by application into commercial, industrial, institutional, and infrastructure segments. Out of these segments, the infrastructure segment is expected to grow at a higher CAGR during the forecast period due to growing demand by travelers for real-time information, an increase in use in several public places to entertain passengers, enhance traveling experience, and lower perceived time for transportation.
Global Digital Signage Market Report Coverage
|
Report Metric
|
Details
|
|
Historical Period
|
2020 - 2024
|
|
Base Year Considered
|
2025
|
|
Forecast Period
|
2026 - 2035
|
|
Market Size in 2025
|
U.S.D. 21.5 Billion
|
|
Revenue Forecast in 2035
|
U.S.D. 34.4 Billion
|
|
Growth Rate
|
7.6%
|
|
Segments Covered in the Report
|
By Component, By Display Size, and By Product, By Installation Location, By Content, By Application.
|
|
Report Scope
|
Market Trends, Drivers, and Restraints; Revenue Estimation and Forecast; Segmentation Analysis; Companies’ Strategic Developments; Market Share Analysis of Key Players; Company Profiling
|
|
Regions Covered in the Report
|
North America, Europe, Asia-Pacific, Middle East, and Rest of the World
|
Industry Dynamics
Digital Signage Industry Trends
There is a significant change in consumer behavior pushing the demand further. In addition, the higher internet and technology penetration has also encouraged retailers to use digital signage more. It allows providing real-time insights and information based on precise data. There is also a significant increase in the research and development of digital signage to improve its efficiency.
Digital Signage Market Growth Drivers
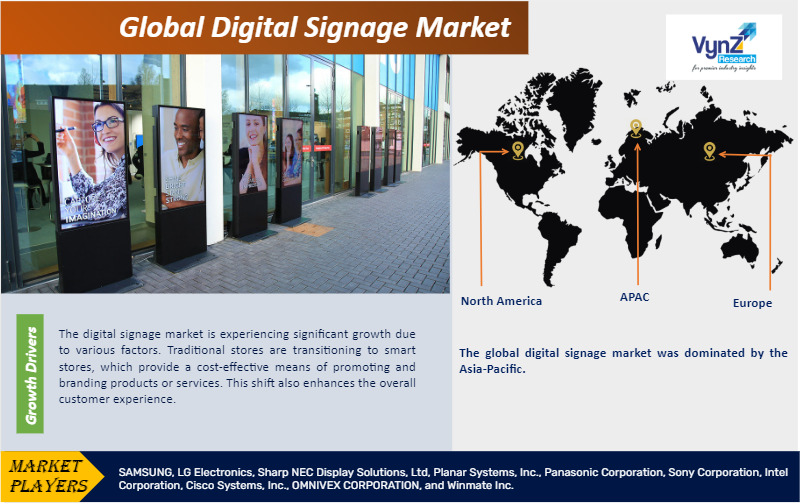
The global digital signage market is driven by the growing transition of conventional stores to smart advertising modes. The cost-effectiveness of digital signage in the long run due to durability and higher mileage also drives its market expansion. The change in customer preference and the ability of digital signage to offer a higher consumer experience lifts the demand for such a vibrant and energy-efficient advertising format, pushing its market further.
Digital Signage Market Challenges
The complexities in the installation of the components of digital signage, power supply issues, absence of standard policy, and higher maintenance requirements of the display boards hinder the market growth.
Digital Signage Market Opportunities
The development in display technology, technological progress in communication, and innovative screens offer new avenues for the growth of the global digital signage market.
Digital Signage Market Geographic Overview
North America is expected to lead the market during the forecast period due to the presence of a large number of manufacturers, higher investment in R&D initiatives, growing demand in specific sectors such as retail, and supportive government initiatives to promote the installation of digital signage.
The Asia Pacific market will also grow at a higher CAGR during the projected period due to growing adoption in developing countries like India and China, higher disposable income, lower labor costs in installation, and higher penetration of digital technologies.
Digital Signage Market Competitive Insight
Key players are adopting strategies such as product launches, expansion, and partnerships to have a competitive edge in the market. The companies are adopting innovation and investing in R&D activities to provide premium-quality and high-value products at optimum cost.
Samsung discovers a wide range of home electronics with cutting-edge technology including smartphones, tablets, TVs, home appliances and more.
LG Corporation is a South Korean multinational conglomerate that is committed to provide electronic products that help customers live a better life.
Key players operating in the global digital signage market are SAMSUNG, LG Electronics, Sharp NEC Display Solutions, Ltd, Planar Systems, Inc., Panasonic Corporation, Sony Corporation, Intel Corporation, Cisco Systems, Inc., OMNIVEX CORPORATION, and Winmate Inc.
Recent Developments by Key Players
LG Electronics (LG) acquired an 80 percent stake in Athom, an industry-leading smart home platform company based in Enschede, Netherlands. This strategic move aims to enhance LG’s connectivity within open smart home ecosystems. By integrating Athom’s capabilities with LG’s Affectionate Intelligence technology, LG aspires to lead the AI-driven home innovation era.
Panasonic Corporation has announced that its Electric Works Company will launch a new pure hydrogen fuel cell generator that generates power through a chemical reaction between high-purity hydrogen and oxygen in the air in in Europe, Australia and China.
The Digital Signage Market report offers a comprehensive market segmentation analysis along with an estimation for the forecast period 2025–2030.
Segments Covered in the Report
- By Component
- Hardware
- Software
- Services
- By Product
- Standalone Displays
- Video Walls
- By Display Size
- Below 32 Inches
- 32 to 52 Inches
- Above 52 Inches
- By Installation Location
- By Content
- By Application
- Commercial
- Institutional
- Infrastructure
- Industrial
Region Covered in the Report
- North America
- Europe
- Germany
- U.K.
- France
- Italy
- Spain
- Russia
- Rest of Europe
- Asia-Pacific (APAC)
- China
- Japan
- India
- South Korea
- Rest of Asia-Pacific
- Rest of the World (RoW)
- Brazil
- Saudi Arabia
- South Africa
- U.A.E.
- Other Countries
.png "Digital Signage Market Size")
Source: VynZ Research
.png "Digital Signage Market Analysis")
Source: VynZ Research
