Status : Published | Published On : Jan, 2024 | Report Code : VRSME9085 | Industry : Semiconductor & Electronics | Available Format :
![]() |
Page : 250 |
The Global Level Sensor Market is expected to witness significant growth on a global scale, with a projected increase from USD 4.8 billion in 2023 to USD 8.6 billion by 2030. This growth is estimated to occur at a Compound Annual Growth Rate (CAGR) of 7.6% during the forecast period spanning from 2025 to 2030.
The level sensor is a device that is used in monitoring, managing, and measuring liquids and determines the level of fluids or other substances that flow in an open or closed system. The increased digitalization and adoption of different intelligent devices have hiked the level sensor market and the increase is steady. The mounting industrial automation and development of miniaturization technology in electronic devices will lead to the adoption of level sensors in different industry verticals, resulting in the growth of the market. Some industries using the device are food and beverages, oil and gas, consumer goods, industrial manufacturing, etc. The level sensors detect precise and accurate leakage and their application is critical in the automobile industry. Level sensors are widely applied to measure water level, tank level, distance range, and object revelation, as well as wireless level monitoring in hydraulic places and as cooling circuits in nuclear power plants.
The COVID-19 outbreak has affected the global economy and has reduced operations, temporary factory closures, and import-export ban. Thus, there is a disruption in the global supply chain that has reduced production and decreased spending for new measurement systems and sensors.
The global level sensor market is divided by technology into contact-level sensors and non-contact-level sensor segments. The former is further sectioned into the guided wave, magnetostrictive, hydrostatic, magnetic & mechanical float, pneumatic, and other segments. The non-contact level sensors segment, on the other hand, is subdivided into ultrasonic, microwave, or radar, and other segments and is expected to grow higher.
According to the monitoring type, the global level sensors market is also divided into continuous level monitoring and point level monitoring segments. The point level monitoring is subdivided into capacitance, optical, conductivity, vibrating, and float switch segments. The continuous level monitoring segment is, however, expected to grow at a higher rate during the forecast period due to higher adoption in measuring and monitoring levels of liquids.
According to the industry vertical, the global level sensor market is divided into food & beverage, power generation, mining and metal processing, automobile, aerospace & defense, energy & power, healthcare, industrial manufacturing, oil & gas, water and wastewater, chemical, consumer, and other segments. Out of all these segments, the oil & gas segment is expected to grow at a higher rate during the forecast period due to the growing demand for level sensors for monitoring storage and downstream processing plants. Moreover, the growing production of crude oil in different countries also increases its growth prospects. In the automobile segment, there is a growing adoption of these sensors to measure the volume of fuel in the tank, windshield cleaning liquid, power steering liquid, cooling water, and engine oil.
Report Metric |
Details |
Historical Period |
2020 - 2024 |
Base Year Considered |
2025 |
Forecast Period |
2026 - 2035 |
Market Size in 2025 |
U.S.D. 4.8 Billion |
Revenue Forecast in 2035 |
U.S.D. 8.6 Billion |
Growth Rate |
7.6% |
Segments Covered in the Report |
By Technology, By Monitoring Tye and By Industry Vertical. |
Report Scope |
Market Trends, Drivers, and Restraints; Revenue Estimation and Forecast; Segmentation Analysis; Impact of COVID-19; Companies’ Strategic Developments; Market Share Analysis of Key Players; Company Profiling |
Regions Covered in the Report |
North America, Europe, Asia-Pacific, Middle East, and Rest of the World |
A growing adoption of Industry 4.0 practices has been noticed, which paves the way for higher usage of level sensors. The growing investment in smart city development is also a notable trend that has pushed the use of these sensors to detect the flow of water bodies and sewage. In addition, increased R&D activities to design innovative digital sensors and the growing adoption of contactless technologies due to strict government regulations and rising environmental concerns are also a few significant trends prevailing in the level sensor market.
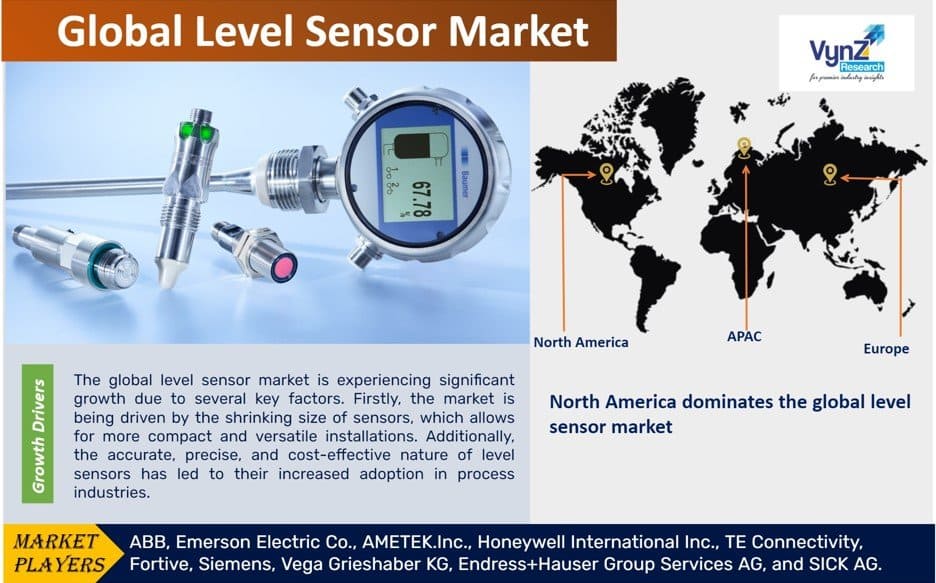
The global level sensor market is primarily growing due to the compact size and higher efficiency of the sensors. The compact size adds to its versatility in application, and the tech integration offers more precision, both driving the market growth significantly. The cost-effectiveness of these sensors has also resulted in higher adoption and growth, just as the rising popularity of IIoT and the production of vehicles have. The rising demand for home automation and consumer convenience will also propel the market growth.
The major players competing with each other to produce high-quality products is hampering the market growth. In addition, the growing adoption of thin-film technology also hinders market growth, just as the growing concerns over privacy and security. Furthermore, the cost of integration is also quite high thereby affecting the market growth apart from the fact that deploying these sensors in the system-on-chip (SoC) does not offer the desired reliability and scalability.
The growth opportunities for the global level sensor market are presented by the advent of nano-enabled sensors and the technological advancement in accessing digital-level sensors.
North America leads the market due to the presence of a large number of manufacturers. It is also attributed to the significant rise in drilling activities within the oil & gas reserves in the region.
The APAC region is also expected to grow at a higher rate during the forecast period due to the large number of mining, petrochemical processing, refineries, automotive, and pharmaceutical industries that need to use these level sensors. The steady supply from countries like China, Korea, and Japan helps cater to the high demand for these sensors, which fuels the market growth further.
The industry players in the level sensor market are adopting strategies like M&A, product launch, and expansion, to expand their product portfolio. Prominent players like ABB, Siemens, Endress +Hauser, Emerson, and Honeywell, have captured a large share of the global market. These players obtain crucial level sensor technology. The small-scale level sensor producers have expertise in a specific technology, have a distinct geographical presence, and good marketing network.
ABB is one of the market leaders in level measurement. The range of level sensors and level transmitters offers solutions for the most complex level applications. It has one of the largest agency-approved level switch technologies such as the K-TEK level products line provides solutions in difficult liquid and solid level applications.
Emerson is focused on two business platforms i.e., automation solutions and commercial & residential solutions, and includes developed technologies to create sustainable solutions for customers. Emerson's extensive range of devices for liquids and solids measurement include point level detection to stimulate continuous level, interface, and volume measurement, even in extreme conditions For instance, Emerson's Rosemount level measurement technologies will optimize processes, plan for maintenance, predict, and correct issues before they become problems. Their product portfolio includes continuous level measurement, point level detection, solids measurement, hygienic and sanitary level measurement, and accessories and spare parts.
Some of the key players operating in the level sensor market are ABB, Emerson Electric Co., AMETEK.Inc., Honeywell International Inc., TE Connectivity, Fortive, Siemens, Vega Grieshaber KG, Endress+Hauser Group Services AG, and SICK AG.
Mahindra & Mahindra has selected ABB's innovative PixelPaint technology for its new electric vehicle paint facility. The technology, which uses an award-winning paint head similar to an inkjet printer, shall begin serial production by 2025.
Connectivity is expanding its line of VITA 66 optical backplane interconnects with the new VITA 66.5 Style D optical modules, which it describes as high-density modules that enable a rugged, blind-mate optical interconnect solution for defense, marine, and aerospace applications including avionics, secure communications, radar, and imaging systems.
The Level Sensor Market report offers a comprehensive market segmentation analysis along with an estimation for the forecast period 2025–2030.
Segments Covered in the Report
Region Covered in the Report
Source: VynZ Research
1. Research Overview
1.1. The Report Offers
1.2. Market Coverage
1.2.1. By Technology
1.2.2. By Monitoring Type
1.2.3. By Industry Vertical
1.2.4. By Region
1.3. Research Phases
1.4. Limitations
1.5. Market Methodology
1.5.1. Data Sources
1.5.1.1. Primary Research
1.5.1.2. Secondary Research
1.5.2. Methodology
1.5.2.1. Data Exploration
1.5.2.2. Forecast Parameters
1.5.2.3. Data Validation
1.5.2.4. Assumptions
1.5.3. Study Period & Data Reporting Unit
2. Executive Summary
3. Industry Overview
3.1. Industry Dynamics
3.1.1. Market Growth Drivers
3.1.2. Market Restraints
3.1.3. Key Market Trends
3.1.4. Major Opportunities
3.2. Industry Ecosystem
3.2.1. Porter’s Five Forces Analysis
3.2.2. Recent Development Analysis
3.2.3. Value Chain Analysis
3.3. Competitive Insight
3.3.1. Competitive Position of Industry Players
3.3.2. Market Attractive Analysis
3.3.3. Market Share Analysis
4. Global Market Estimate and Forecast
4.1. Global Market Overview
4.2. Global Market Estimate and Forecast to 2030
5. Market Segmentation Estimate and Forecast
5.1. By Technology
5.1.1. Contact Level Sensors
5.1.1.1. Market Definition
5.1.1.2. Market Estimation and Forecast to 2030
5.1.2. Non-Contact Level Sensors
5.1.2.1. Market Definition
5.1.2.2. Market Estimation and Forecast to 2030
5.2. By Monitoring Type
5.2.1. Continuous Level Monitoring
5.2.1.1. Market Definition
5.2.1.2. Market Estimation and Forecast to 2030
5.2.2. Point Level Monitoring
5.2.2.1. Market Definition
5.2.2.2. Market Estimation and Forecast to 2030
5.3. By Industry Vertical
5.3.3. Food & Beverage
5.3.1.1. Market Definition
5.3.1.2. Market Estimation and Forecast to 2030
5.3.4. Power Generation
5.3.2.1. Market Definition
5.3.2.2. Market Estimation and Forecast to 2030
5.3.5. Mining and Metal Processing
5.3.1.1. Market Definition
5.3.1.2. Market Estimation and Forecast to 2030
5.3.6. Automobile
5.3.2.1. Market Definition
5.3.2.2. Market Estimation and Forecast to 2030
5.3.7. Aerospace & Defense
5.3.1.1. Market Definition
5.3.1.2. Market Estimation and Forecast to 2030
5.3.8. Energy & Power
5.3.2.1. Market Definition
5.3.2.2. Market Estimation and Forecast to 2030
5.3.9. Healthcare
5.3.1.1. Market Definition
5.3.1.2. Market Estimation and Forecast to 2030
5.3.10. Industrial Manufacturing
5.3.2.1. Market Definition
5.3.2.2. Market Estimation and Forecast to 2030
5.3.11. Oil & Gas
5.3.1.1. Market Definition
5.3.1.2. Market Estimation and Forecast to 2030
5.3.12. Water and Wastewater
5.3.2.1. Market Definition
5.3.2.2. Market Estimation and Forecast to 2030
5.3.13. Chemical
5.3.1.1. Market Definition
5.3.1.2. Market Estimation and Forecast to 2030
5.3.14. Consumer
5.3.2.1. Market Definition
5.3.2.2. Market Estimation and Forecast to 2030
5.3.15. Others
5.3.1.1. Market Definition
5.3.1.2. Market Estimation and Forecast to 2030
6. North America Market Estimate and Forecast
6.1. By Technology
6.2. By Monitoring Type
6.3. By Industry Vertical
6.4 By Country – U.S., Canada, and Mexico
6.5.1. U.S. Market Estimate and Forecast
6.5.2. Canada Market Estimate and Forecast
6.5.3. Mexico Market Estimate and Forecast
7. Europe Market Estimate and Forecast
7.1. By Technology
7.2. By Monitoring Type
7.3. By Industry Vertical
7.6 By Country – Germany, U.K., France, Italy, Spain, Russia, and Rest of Europe
7.5.1. Germany Market Estimate and Forecast
7.5.2. France Market Estimate and Forecast
7.5.3. U.K. Market Estimate and Forecast
7.5.4. Italy Market Estimate and Forecast
7.5.5. Spain Market Estimate and Forecast
7.5.6. Rest of Europe Market Estimate and Forecast
8. Asia-Pacific Market Estimate and Forecast
8.1. By Technology
8.2. By Monitoring Type
8.3. By Industry Vertical
8.6 By Country – China, Japan, India, South Korea, and Rest of Asia-Pacific
8.5.1. China Market Estimate and Forecast
8.5.2. Japan Market Estimate and Forecast
8.5.3. India Market Estimate and Forecast
8.5.4. South Korea Market Estimate and Forecast
8.5.5. Singapore Market Estimate and Forecast
8.5.6. Rest of Asia-Pacific Market Estimate and Forecast
9. Rest of the World (RoW) Market Estimate and Forecast
9.1. By Technology
9.2. By Monitoring Type
9.3. By Industry Vertical
9.6 By Country – Brazil, Saudi Arabia, South Africa, U.A.E., and Other Countries
9.5.1. Brazil Market Estimate and Forecast
9.5.2. Saudi Arabia Market Estimate and Forecast
9.5.3. South Africa Market Estimate and Forecast
9.5.4. Other Countries Market Estimate and Forecast
10. Company Profiles
10.1. ABB
10.1.1. Snapshot
10.1.2. Overview
10.1.3. Offerings
10.1.4. Financial Insight
10.1.5. Recent Developments
10.2. Emerson Electric Co.
10.2.1. Snapshot
10.2.2. Overview
10.2.3. Offerings
10.2.4. Financial Insight
10.2.5. Recent Developments
10.3. AMETEK.Inc.
10.3.1. Snapshot
10.3.2. Overview
10.3.3. Offerings
10.3.4. Financial Insight
10.3.5. Recent Developments
10.4. Honeywell International Inc.
10.4.1. Snapshot
10.4.2. Overview
10.4.3. Offerings
10.4.4. Financial Insight
10.4.5. Recent Developments
10.5. TE Connectivity
10.5.1. Snapshot
10.5.2. Overview
10.5.3. Offerings
10.5.4. Financial Insight
10.5.5. Recent Developments
10.6. Fortive
10.6.1. Snapshot
10.6.2. Overview
10.6.3. Offerings
10.6.4. Financial Insight
10.6.5. Recent Developments
10.7. Siemens
10.7.1. Snapshot
10.7.2. Overview
10.7.3. Offerings
10.7.4. Financial Insight
10.7.5. Recent Developments
10.8. Vega Grieshaber KG
10.7.1. Snapshot
10.7.2. Overview
10.7.3. Offerings
10.7.4. Financial Insight
10.7.5. Recent Developments
10.9. Endress+Hauser Group Services AG
10.7.1. Snapshot
10.7.2. Overview
10.7.3. Offerings
10.7.4. Financial Insight
10.7.5. Recent Developments
10.10. SICK AG
10.7.1. Snapshot
10.7.2. Overview
10.7.3. Offerings
10.7.4. Financial Insight
10.7.5. Recent Developments
11. Appendix
11.1. Exchange Rates
11.2. Abbreviations
Note: Financial insight and recent developments of different companies are subject to the availability of information in the secondary domain.
List of Tables
Table 1 Sources
Table 2 Study Periods
Table 3 Data Reporting Unit
Table 4 Global Level Sensor Market, By Technology, 2018 - 2023 (USD Billion)
Table 5 Global Level Sensor Market, By Technology, 2025 - 2030 (USD Billion)
Table 6 Global Level Sensor Market, By Monitoring Type, 2018 - 2023 (USD Billion)
Table 7 Global Level Sensor Market, By Monitoring Type, 2025 - 2030 (USD Billion)
Table 10 Global Level Sensor Market, By Industry Vertical, 2018 - 2023 (USD Billion)
Table 11 Global Level Sensor Market, By Industry Vertical, 2025 - 2030 (USD Billion)
Table 12 Global Level Sensor Market, By Region, 2018 - 2023 (USD Billion)
Table 13 Global Level Sensor Market, By Region, 2025 - 2030 (USD Billion)
Table 14 North America Level Sensor Market, By Technology, 2018 - 2023 (USD Billion)
Table 15 North America Level Sensor Market, By Technology, 2025 - 2030 (USD Billion)
Table 16 North America Level Sensor Market, By Monitoring Type, 2018 - 2023 (USD Billion)
Table 17 North America Level Sensor Market, By Monitoring Type, 2025 - 2030 (USD Billion)
Table 18 North America Level Sensor Market, By Industry Vertical, 2018 - 2023 (USD Billion)
Table 19 North America Level Sensor Market, By Industry Vertical, 2025 - 2030 (USD Billion)
Table 20 North America Level Sensor Market, By Region, 2018 - 2023 (USD Billion)
Table 21 North America Level Sensor Market, By Region, 2025 - 2030 (USD Billion)
Table 22 Europe Level Sensor Market, By Technology, 2018 - 2023 (USD Billion)
Table 23 Europe Level Sensor Market, By Technology, 2025 - 2030 (USD Billion)
Table 24 Europe Level Sensor Market, By Monitoring Type, 2018 - 2023 (USD Billion)
Table 25 Europe Level Sensor Market, By Monitoring Type, 2025 - 2030 (USD Billion)
Table 26 Europe Level Sensor Market, By Industry Vertical, 2018 - 2023 (USD Billion)
Table 27 Europe Level Sensor Market, By Industry Vertical, 2025 - 2030 (USD Billion)
Table 28 Europe Level Sensor Market, By Region, 2018 - 2023 (USD Billion)
Table 29 Europe Level Sensor Market, By Region, 2025 - 2030 (USD Billion)
Table 30 Asia-Pacific Level Sensor Market, By Technology, 2018 - 2023 (USD Billion)
Table 31 Asia-Pacific Level Sensor Market, By Technology, 2025 - 2030 (USD Billion)
Table 32 Asia-Pacific Level Sensor Market, By Monitoring Type, 2018 - 2023 (USD Billion)
Table 33 Asia-Pacific Level Sensor Market, By Monitoring Type, 2025 - 2030 (USD Billion)
Table 34 Asia-Pacific Level Sensor Market, By Industry Vertical, 2018 - 2023 (USD Billion)
Table 35 Asia-Pacific Level Sensor Market, By Industry Vertical, 2025 - 2030 (USD Billion)
Table 36 Asia-Pacific Level Sensor Market, By Region, 2018 - 2023 (USD Billion)
Table 37 Asia-Pacific Level Sensor Market, By Region, 2025 - 2030 (USD Billion)
Table 38 RoW Level Sensor Market, By Technology, 2018 - 2023 (USD Billion)
Table 39 RoW Level Sensor Market, By Technology, 2025 - 2030 (USD Billion)
Table 40 RoW Level Sensor Market, By Monitoring Type, 2018 - 2023 (USD Billion)
Table 41 RoW Level Sensor Market, By Monitoring Type, 2025 - 2030 (USD Billion)
Table 42 RoW Level Sensor Market, By Industry Vertical, 2018 - 2023 (USD Billion)
Table 43 RoW Level Sensor Market, By Industry Vertical, 2025 - 2030 (USD Billion)
Table 44 RoW Level Sensor Market, By Region, 2018 - 2023 (USD Billion)
Table 45 RoW Level Sensor Market, By Region, 2025 - 2030 (USD Billion)
Table 46 Snapshot – ABB
Table 47 Snapshot – Emerson Electric Co.
Table 48 Snapshot – AMETEK.Inc.
Table 49 Snapshot – Honeywell International Inc.
Table 50 Snapshot – TE Connectivity
Table 51 Snapshot – Fortive
Table 52 Snapshot – Siemens
Table 53 Snapshot – Vega Grieshaber KG
Table 54 Snapshot – Endress+Hauser Group Services AG
Table 55 Snapshot – SICK AG
List of Figures
Figure 1 Market Coverage
Figure 2 Research Phases
Figure 3 Secondary Sources for Different Parameters
Figure 4 Methodology
Figure 5 Data Mining & Exploration
Figure 6 Data Triangulation
Figure 7 Assumptions for Market Estimation and Forecast
Figure 8 Market Synopsis
Figure 9 Global Level Sensor Market- Growth Drivers and Restraints
Figure 10 Competitive Benchmark
Figure 11 Global Level Sensor Market Highlight
Figure 12 Global Level Sensor Market, By Technology, 2018 - 2030 (USD Billion)
Figure 13 Global Level Sensor Market, By Monitoring Type, 2018 - 2030 (USD Billion)
Figure 14 Global Level Sensor Market, By Industry Vertical, 2018 - 2030 (USD Billion)
Figure 15 Global Level Sensor Market, By Region, 2018 - 2030 (USD Billion)
Figure 16 North America Level Sensor Market Highlight
Figure 17 North America Level Sensor Market, By Technology, 2018 - 2030 (USD Billion)
Figure 18 North America Level Sensor Market, By Monitoring Type, 2018 - 2030 (USD Billion)
Figure 19 North America Level Sensor Market, By Industry Vertical, 2018 - 2030 (USD Billion)
Figure 20 North America Level Sensor Market, by Region, 2018 - 2030 (USD Billion)
Figure 21 Europe Level Sensor Market Highlight
Figure 22 Europe Level Sensor Market, By By Technology, 2018 - 2030 (USD Billion)
Figure 23 Europe Level Sensor Market, By Monitoring Type, 2018 - 2030 (USD Billion)
Figure 24 Europe Level Sensor Market, By Industry Vertical, 2018 - 2030 (USD Billion)
Figure 25 Europe Level Sensor Market, by Region, 2018 - 2030 (USD Billion)
Figure 26 Asia-Pacific Level Sensor Market Highlight
Figure 27 Asia-Pacific Level Sensor Market, By Technology, 2018 - 2030 (USD Billion)
Figure 28 Asia-Pacific Level Sensor Market, By Monitoring Type, 2018 - 2030 (USD Billion)
Figure 29 Asia-Pacific Level Sensor Market, By Industry Vertical, 2018 - 2030 (USD Billion)
Figure 30 Asia-Pacific Level Sensor Market, by Region, 2018 - 2030 (USD Billion)
Figure 31 RoW Level Sensor Market Highlight
Figure 32 RoW Level Sensor Market, By Technology, 2018 - 2030 (USD Billion)
Figure 33 RoW Level Sensor Market, By Monitoring Type, 2018 - 2030 (USD Billion)
Figure 34 RoW Level Sensor Market, By Industry Vertical, 2018 - 2030 (USD Billion)
Figure 35 RoW Level Sensor Market, By Region, 2018 - 2030 (USD Billion)
Global Level Sensor Market Coverage
Technology Insight and Forecast 2025-2030
Monitoring Type Insight and Forecast 2025-2030
Industry Vertical Insight and Forecast 2025-2030
Geographical Segmentation
Level Sensor Market by Region
North America
Europe
Asia-Pacific (APAC)
Rest of the World (RoW)
Vynz Research know in your business needs, you required specific answers pertaining to the market, Hence, our experts and analyst can provide you the customized research support on your specific needs.
After the purchase of current report, you can claim certain degree of free customization within the scope of the research.
Please let us know, how we can serve you better with your specific requirements to your research needs. Vynz research promises for quick reversal for your current business requirements.
Purchase Options
Latest Report
Research Methodology
Connect With Our Sales Team