Microgrid Market Overview
The Global Microgrid Market is expected to experience substantial growth over the forecast period of 2025-2030, with a projected CAGR of 11.6%. Starting at USD 24.2 billion in 2023, the market is anticipated to reach USD 46.2 billion by 2030. Microgrids are smaller versions of power grids that transport electricity from source to consumer. They help to lower overall costs and provide grid backup in the event of an outage.
Microgrids are more efficient than traditional electrical grids and can be integrated with a variety of renewable energy sources such as solar, wind, small hydro, geothermal, waste-to-energy, and combined heat and power (CHP) systems. Batteries, distributed generators, and solar panels can also be used to power them.
Microgrids are also a reliable source of electricity because they operate continuously during power outages. Thus, the rising demand for reliable and secured power supply in industrial and commercial sectors globally along with initiatives by the government to reduce carbon footprint will propel the growth of the microgrid market.
The COVID-19 outbreak has impacted the businesses of several microgrid hardware manufacturing companies, distributors, and suppliers owing to delays in shipments, and delays in projects and installation of microgrids, reduced domestic demand, thereby impacting the growth of the microgrid market.
Microgrid Market Segmentation
Insight by Offering
The global microgrid market is divided by offering into hardware, software, and services, where the hardware segment is expected to grow more due to higher microgrid projects, lower energy storage costs, low cost of renewable sources of energy, and favorable government initiatives to reduce greenhouse gas by using clean energy.
Insight by Type
The global microgrid market is also divided by type into AC, DC, and hybrid microgrid segments where the AC microgrid segment is expected to grow more due to less loss in transmission, lower heat generation, higher voltage levels, higher deployment, and large renewable energy farms connected to AC transmission lines.
Insight by Connectivity
Connectivity also divides the global microgrid market into grid-connected and off-grid-connected segments. Out of these two segments, the former is expected to grow more during the forecast period due to the growing adoption of utility-based grid networks, harnessing renewable sources of energy on a large scale, and advantages offered such as higher resilience, power quality, and lower environmental impact.
Insight by Storage Device
According to the storage devices, the global microgrid market is divided into lithium-ion, lead acid, flow batteries, and flywheels segments. Out of these segments, the lithium-ion segment will grow at a higher CAGR due to sustainable technology deployment, technological advancements, higher R&D activities, and a growing preference for battery-powered systems.
Insight by Power
The global microgrid market is split by power into combined heat & power, solar photovoltaic, natural gas, fuel cell, and diesel categories. Out of these, the combined heat & power segment will dominate the market due to the growing adoption of sustainable power generation sources like solar and wind, the advantages offered, lower emission levels, higher efficiency, and lower cost. The fuel cell segment is also expected to grow at a higher CAGR due to enhanced energy storage abilities, zero-emission nature, and ability to function at high temperatures.
Insight by End Use
Based on end use, the global microgrid market is split into utilities, commercial & industrial, institutes & campuses, military, remote, government, and healthcare segments. Out of these segments, the commercial & industrial segment is expected to grow at a higher CAGR during the forecast period due to the need for uninterrupted electrical supply for industrial operations, which will boost productivity, lower downtime, and chances of equipment damage. Growing government initiatives to reduce greenhouse gas emissions and promote the use of renewable energy also propels market growth.
Global Microgrid Market Report Coverage
|
Report Metric
|
Details
|
|
Historical Period
|
2020 - 2024
|
|
Base Year Considered
|
2025
|
|
Forecast Period
|
2026 - 2035
|
|
Market Size in 2025
|
U.S.D. 24.2 Billion
|
|
Revenue Forecast in 2035
|
U.S.D. 46.2 Billion
|
|
Growth Rate
|
11.6%
|
|
Segments Covered in the Report
|
By Offering, By Type, By Connectivity, By Storage Device, By Power,
|
|
Report Scope
|
Market Trends, Drivers, and Restraints; Revenue Estimation and Forecast; Segmentation Analysis; Companies’ Strategic Developments; Market Share Analysis of Key Players; Company Profiling
|
|
Regions Covered in the Report
|
North America, Europe, Asia-Pacific, Middle East, and Rest of the World
|
Industry Dynamics
Microgrid Industry Trends
There is a growing investment in solar energy projects worldwide as well as in AEC (Architecture, Engineering, and Construction) machinery. In addition, there has also been a growing adoption of Industry 4.0 practices among industries.
Microgrid Market Growth Drivers
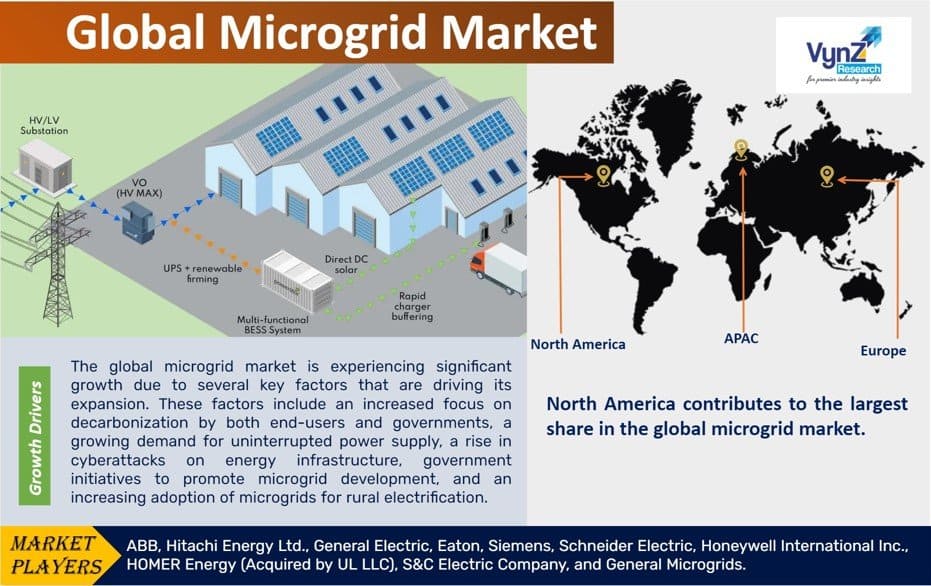
The most significant growth driver of the microgrid market is the growing emphasis on decarbonization by governments as well as the end users. It is also attributed to the rising demand for uninterrupted power supply, government initiatives to endorse the development of microgrids, growth in the number of cyberattacks on energy infrastructure, higher adoption of microgrids in rural electrification projects, and rapid urbanization and development of smart cities. Furthermore, rise in demand for grid modernization, IoT, distributed energy production sources integration, and implementation of different smart grid technologies.
Microgrid Market Challenges
High cost, lack of proper regulatory policy, and technical design issues hinder market growth. Typically, it needs to maintain a reciprocal relationship between the microgrid and the main grid when these are connected. Vulnerability of the grids to instabilities in electricity supply also hinders extensive adoption and growth of the market because oversupply may result in power loss in the microgrid due to the tripping of the generator, and undersupply of electricity may result in malfunctioning of the equipment.
Microgrid Market Opportunities
Developments in microgrid controllers, smart microgrids, and renewable energy storage systems offer the market's growth opportunities. Also, innovations in microgrid hardware and software, a growing focus on technology and data management integration, higher investments in feasibility studies, and a growing demand for reliable electrical equipment for the aerospace and military sectors offer promising growth opportunities.
Microgrid Market Geographic Overview
North America leads the market as it is the early adopter of these systems. It is also expected to continue to do so due to higher investments in R&D activities.
The Asia-Pacific market is expected to grow at a higher CAGR due to rapid electrification in rural and semi-rural areas, supportive government regulations and tempting incentives to promote the usage of renewable energy, easy availability of raw materials, and growing adoption of standalone sources.
Microgrid Market Competitive Insight
The market for microgrids is moderated and consolidated. The increased strategic partnerships, contractual agreements, and inorganic ventures will allow the industry players to have a competitive edge in the market.
ABB is a trusted partner in the evolving global energy ecosystem and acts as a pioneer in energy management and optimization. ABB has become a pioneer in Microgrid technology by successfully powering research stations from Antarctica, Alaska, and Flores Island to distant mines and villages in Australia's deserts utilizing integrated energy sources. ABB's Microgrid Solutions group specializes in providing modular and scalable technology packages that provide power, improve power quality, and integrate renewable energy into fossil-fuel Microgrids. The PowerStore grid-stabilizing generator and the MGC600TM controller platform are the cornerstones of the Microgrid PlusTM System. Microgrid solutions from ABB are best suited for systems with peak demand between 300 kW and 50 MW.
Microgrid Energy Systems from Eaton assist businesses in achieving electrical energy savings, resiliency, and independence from a utility. Users obtain a dependable, scalable, and efficient solution to unexpected power outages while also improving cybersecurity by combining generation sources on a common grid structure. Eaton collaborates with customers to provide turnkey services for the full system's concept, design, pricing, implementation, and maintenance. System optimization software, automation, and product services, LV load control, smart inverter suite, supporting electrics, smart MV grid-tie connection, and utility automation products are all part of Eaton's Microgrid Energy System concept.
Some of the major players in the global microgrids market include ABB, Hitachi Energy Ltd., General Electric, Eaton, Siemens, Schneider Electric, Honeywell International Inc., HOMER Energy (Acquired by UL LLC), S&C Electric Company, and General Microgrids.
Recent Developments by Key Players
Hitachi Energy investmented over USD 1.5 billion to ramp up its global transformer manufacturing capacity to keep pace with the growing demand and support the long-term plans and electrification efforts.
Jebel Ali Free Zone (Jafza) (DP World's flagship free zone and the largest customs bonded zone in the Middle East) and Eaton (a global intelligent power management company) collaborated to build a new sustainable campus, bringing together Eaton’s Dubai-based commercial, manufacturing and support functions while providing capacity for growth in the future. This project shall extend Eaton’s research, engineering and manufacturing capacity, and aims to significantly boost Dubai’s capabilities in the advanced manufacturing of electrical and electronic components that are required to deliver safe and efficient power for several industries including data centres, buildings and solar energy.
The Microgrid Market report offers a comprehensive market segmentation analysis along with an estimation for the forecast period 2025–2030.
Segments Covered in the Report
- By Offering
- Hardware
- Software
- Services
- By Type
- AC Microgrids
- DC Microgrids
- Hybrid
- By Connectivity
- Grid Connected
- Off-Grid Connected
- By Storage Device
- Lithium-Ion
- Lead Acid
- Flow Batteries
- Flywheel
- By Power
- Combined Heat & Power (CHP)
- Solar Photovoltaic
- Natural Gas
- Fuel Cell
- Diesel
- By End Use
- Utilities
- Commercial & Industrial
- Institutes & Campuses
- Military
- Remote
- Government
- Healthcare
Region Covered in the Report
- North America
- Europe
- Germany
- U.K.
- France
- Italy
- Spain
- Russia
- Rest of Europe
- Asia-Pacific (APAC)
- China
- Japan
- India
- South Korea
- Rest of Asia-Pacific
- Rest of the World (RoW)
- Brazil
- Saudi Arabia
- South Africa
- U.A.E.
- Other Countries
.png "Microgrid Market Size and Market Analysis")
Source: VynZ Reserach
