Near Field Communication Market Overview
During the forecasted period from 2025 to 2030, the Global Near Field Communication (NFC) Market is projected to witness a remarkable CAGR of 14.5%, reaching a value of USD 37.8 billion by 2030, compared to USD 18.6 billion in 2023. NFC, a short-range wireless networking technology, plays a pivotal role in facilitating the seamless transfer of digital content, transactions, and connections between diverse electronic devices worldwide. Predominantly employed for short-range data sharing (within 10 cm or less) among smartphones, laptops, and tablets, NFC finds extensive usage in marketing and payment applications. Moreover, it is increasingly being embraced in chip-enabled mobile marketing, ticketing, identity and access management, and gaming domains. Furthermore, the advent of NFC technology has transformed mobile devices into crucial tools for data transfer, particularly in Point of Sale (PoS) systems. Collaborative efforts between financial institutions and mobile app developers to create apps enabling customers to engage in business transactions are poised to drive the NFC market's growth. Consequently, the escalating focus on enhancing customer experience will serve as a catalyst for the expansion of the NFC market.
The COVID-19 outbreak has accelerated the development of the near-field communication industry due to a surge increasing demand for contactless solutions. Furthermore, as a result of the COVID-19 epidemic, the NFC market will see increased usage of NFC technology in smart packaging for healthcare, as well as increased demand for NFC in expanding medical applications.
Near Field Communication Market Segmentation
Insight by Device Operating Mode
Based on device operating mode, the global near-field communication market is segmented into reader emulation, peer-to-peer, and card emulation. The reader emulation is anticipated to have a high CAGR during the projected period as the NFC chip is widely used in reader emulation mode by mobile phones and retail applications. There is an increased demand for payments, resulting in the adoption of NFC-based mobile wallets such as Google Pay, Samsung Pay, Apple Pay, and Android Pay are predicted to grow significantly during the forecast period.
Insight by Offering
Based on offering, the global near-field communication market is divided into non-auxiliary products, auxiliary products, and software. The non-auxiliary products are further sub-divided into NFC ICs & antennas, NFC tags, NFC readers. NFC micro-SD cards, NFC SIM/UICC cards, and NFC covers are some of the auxiliary products. Non-auxiliary offering dominates the NFC market. Internal NFC-enabled accessories, such as NFC IC/Chips developed for smartphones to make contactless payments, access control, and secure data sharing with other NFC devices, are known as non-auxiliary NFC items. The expansion of non-auxiliary items in the NFC market has been spurred by the increased acceptance of NFC in smartphones.
Insight by Application
Retail, transportation, automotive, residential & commercial, medical & healthcare, consumer electronics, banking & finance, hospitality, and others (education and government) are the application segments of the near-field communication market. The retail segment is sub-divided into access control, product identification, and transaction. The transportation segment is sub-divided into ticketing and access control. The automotive segment is sub-divided into low-end, mid-range, and high-end. The residential & commercial segment is sub-divided into physical access, time & attendance, automated locking system, and smart lighting. Medical & healthcare is sub-divided into medical devices and access control. Consumer electronics is sub-divided into wearable devices, mobile phones/tablets, laptops/ PCs, cameras, printers, gaming devices, and others. Banking & finance is sub-divided into e-money services (POS machines) and multi forex cards. Hospitality is sub-divided into access control and transaction. Banking & finance is anticipated to have a high CAGR during the forecast period as NFC technology is revolutionizing the banking infrastructure via using mobile technologies and cloud platform. The increased penetration of mobile wallets is a safer secured option than having physical cards because digital e-wallet apps like Apply Pay, Google Pay tokenize all financial details into something that intruders can't access or use. The healthcare industry is anticipated to have significant growth as patient monitoring methods like smart sensors and record of patients’ health status is done by NFC. "MiniME," a biometric gadget designed by Ergonomi design monitors, with features such as ECG, blood pressure, heart rate, body temperature, and many other characteristics that transfer data using NFC cloud, is one of NFC's advances in patient monitoring.
Global Near Field Communication Market Report Coverage
|
Report Metric
|
Details
|
|
Historical Period
|
2020 - 2024
|
|
Base Year Considered
|
2025
|
|
Forecast Period
|
2026 - 2035
|
|
Market Size in 2025
|
U.S.D. 18.6 Billion
|
|
Revenue Forecast in 2035
|
U.S.D. 37.8 Billion
|
|
Growth Rate
|
14.5%
|
|
Segments Covered in the Report
|
By Device Operating Mode, By Offering, and By Application
|
|
Report Scope
|
Market Trends, Drivers, and Restraints; Revenue Estimation and Forecast; Segmentation Analysis; Companies’ Strategic Developments; Market Share Analysis of Key Players; Company Profiling
|
|
Regions Covered in the Report
|
North America, Europe, Asia-Pacific, Middle East, and Rest of the World
|
Industry Dynamics
Near Field Communication Industry Trends
The increasing trend for mobile internet applications and the development of 3G and 4G networks will drive the growth of the market. The rising need to reduce the cost of ownership, the escalating pattern of portable business, and the growing convenience need are further accelerating the industry development.
Near Field Communication Market Growth Drivers
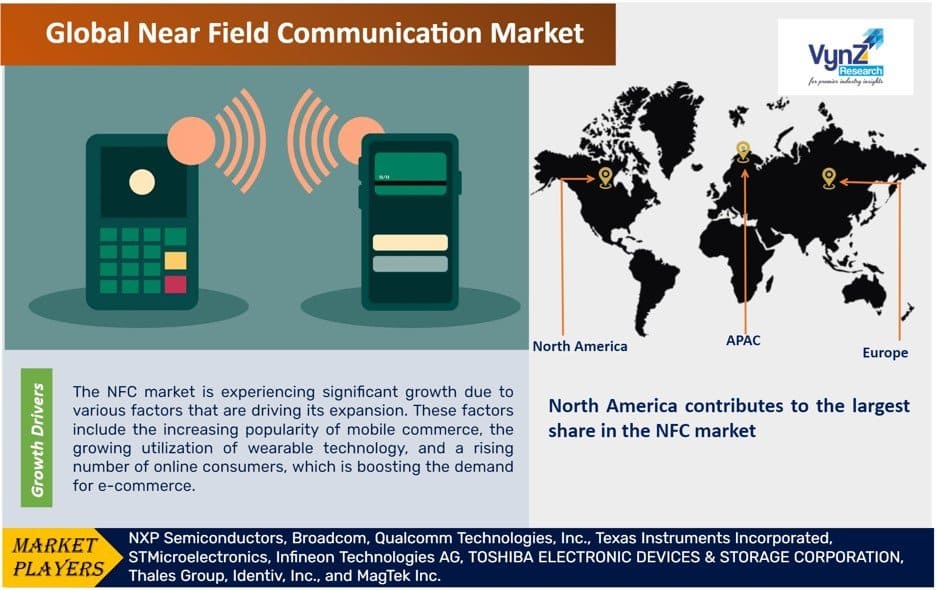
The NFC market is experiencing significant growth due to various factors that are driving its expansion. These factors include the increasing popularity of mobile commerce, the growing utilization of wearable technology, and a rising number of online consumers, which is boosting the demand for e-commerce. Additionally, the adoption of wireless technologies in industries such as medical, banking, and consumer retail is further contributing to the growth of the NFC market.
The increasing prevalence of smartphones for contactless payments and authentication, along with the widespread acceptance of NFC technology in consumer electronics and government sectors globally, will fuel the adoption of cashless transactions. Moreover, the seamless transfer and secure storage of data provided by NFC technology will also play a crucial role in driving market growth.
Beyond its applications in payments and device-to-device sharing, NFC technology is finding utility in the airline industry for boarding cards and security access, as well as in keyless entry systems for businesses, buildings, and cars. These applications create ample opportunities for the NFC sector to expand and flourish.
Near Field Communication Market Challenges
The problem related to short-term communication will hamper the growth of the NFC market. Furthermore, the increasing cost of installations and security concerns, supply chain uncertainties, competition from alternative payment methods like TouchBase which uses touchscreens, and complexity in integration are some of the challenges faced by NFC market. Furthermore, a lack of awareness among healthcare staff, as well as suspicion among industry specialists and leaders, may constrain the market in the near future.
Near Field Communication Market Opportunities
The rising mobile penetration with enhanced payment infrastructure and data connectivity will provide substantial growth opportunities in eth NFC-enabled mobile payment. The increasing demand for developed manufacturing hubs for consumer electronics and automobiles in countries like India and China will provide massive growth opportunities in the NFC market in the region. Furthermore, novel applications of NFC, like smart posters, NFC-enabled smart automobiles, and smart sensors, have acquired prominence among consumers, particularly among the young and technologically savvy, providing an opportunity for existing brands to access new markets.
Near Field Communication Market Geographic Overview
North America contributes to the largest share in the NFC market owing to the presence of developed technologies and global industry players. To ensure that payments are easy when connecting to NFC terminals, the SIM cards are equipped with the fastest and most stable internet connections available. Furthermore, mobile phone manufacturers in the United States and Canada are making mobile payments technology more accessible by integrating it in all new phones and making the applications operate with all available mPayment solutions.
APAC is anticipated to grow at a high CAGR during the projected period owing to countries like India, Japan, China, and South Korea are anticipated to have large-scale development due to the increasing adoption of contactless technology amid the COVID-19 crisis will fuel the growth in the region.
Near Field Communication Market Competitive Insight
The NFC market is moderately competitive, with several worldwide firms as well as local businesses competing. Strategic collaboration efforts are being used by businesses to manage market share and profitability. With the advent of innovation, it is projected that a number of small to mid-sized businesses will enter the market in the near future. The robust diversification of mobile payment services has augmented collaboration among the key player, thereby leading to advancement in technology.
NXP is a leading provider of RFID and NFC-integrated circuits (ICs). A diverse range of high-performance NFC frontend controller solutions includes NFC Readers, NFC Connected Tags, NFC Smart Tags and Labels, NFC Sensing, and NFC Charging.
ST offers a wide variety of HF RFID/NFC devices, addressing all NFC application needs and supported by a robust ecosystem, as STMicroelectronics are one of the pioneers of RFID and NFC technology.NFC / RFID tags, Dynamic NFC tags, NFC / RFID readers & NFC controllers, and Secure NFC applications are among their offerings.
In October 2021, Qualcomm and NXP have expanded their collaboration and integrated NXP’s eSIM into the Wearable Segment as per Qualcomm’s widely used Snapdragon Wear Platform.
In November 2021, STMicroelectronics has launched ST25TN512 and ST25TN01K, cost-effective NFC Type 2 Tag IC having features of privacy, balancing high-volume use cases such as consumer engagement, product information, and brand protection and augmented NDEF.
Some of the key players operating in the near field communication market: NXP Semiconductors, Broadcom, Qualcomm Technologies, Inc., Texas Instruments Incorporated, STMicroelectronics, Infineon Technologies AG, TOSHIBA ELECTRONIC DEVICES & STORAGE CORPORATION, Thales Group, Identiv, Inc., and MagTek Inc.
The Near Field Communication Market report offers a comprehensive market segmentation analysis along with an estimation for the forecast period 2025–2030.
Segments Covered in the Report
- By Device Operating Mode
- Reader Emulation
- Peer-To-Peer
- Card Emulation
- By Offering
- Non-Auxiliary Products
- NFC ICs & Antennas
- NFC Tags
- NFC Readers
- Auxiliary Products
- NFC Micro-SD Cards
- NFC SIM/UICC Cards
- NFC Covers
- Software
- By Application
- Retail
- Access Control
- Product Identification
- Transaction
- Transportation
- Automotive
- Low-End
- Mid-Range
- High-End
- Residential & Commercial
- Physical Access
- Time & Attendance
- Automated Locking System
- Smart Lighting
- Medical & Healthcare
- Medical Devices
- Access Control
- Consumer Electronics
- Wearable Devices
- Mobile Phones/Tablets
- Laptops/Personal Computers
- Cameras
- Printers
- Gaming Devices
- Others
- Banking & Finance
- E-Money Services (POS Machines)
- Multi forex Cards
- Hospitality
- Access Control
- Transaction
- Others
Region Covered in the Report
- North America
- Europe
- Germany
- U.K.
- France
- Italy
- Spain
- Russia
- Rest of Europe
- Asia-Pacific (APAC)
- China
- Japan
- India
- South Korea
- Rest of Asia-Pacific
- Rest of the World (RoW)
- Brazil
- Saudi Arabia
- South Africa
- U.A.E.
- Other Countries
.png "Near Field Communication Market Size and Market Analysis")
