Power Electronics Market Overview
The Global Power Electronics Market is expected to witness substantial growth in the coming years. According to market projections, it is predicted to expand from USD 30.6 billion in 2023 to USD 54.9 billion by 2030, reflecting a steady compound annual growth rate (CAGR) of 4.5% during the forecast period spanning from 2025 to 2030.
Power electronics is an application of a solid-state circuit device that transforms electrical power from one form to another using diodes, transistors, and thyristors for effective and efficient control. Power electronics regulate the unidirectional and bidirectional flow of energy which is dependent on usage and regenerated energy is sent back for utility. Power electronics manufacturers are concentrating on producing devices that can function at high power densities. The benefits provided by these devices include simplified circuits, less drive power, and optimal reverse and forward blocking capabilities, thereby improving efficiency in application areas. Automotive and transportation, industrial, renewable energy, consumer electronics, defense, and aerospace extensively use power electronics devices.
The COVID-19 outbreak has hurt the power electronics market owing to disruption in the supply chain and disruption in international trade. This has resulted in a shortage of semiconductors' raw materials and components in the initial phases of the coronavirus pandemic. However, the outbreak has driven the advancement and innovations in ADAS, self-driving cars, and the electric vehicles market and has boosted the demand for power electronics devices.
Power Electronics Market Segmentation
Insight by Device Type
The global power electronics market is divided by the device types into power discrete, power modules, and power IC segments. The power discrete segment is further divided into diode, transistors, and thyristor, the power modules segment into intelligent power modules and power integrated modules, and the power IC segment into power management integrated circuit (PMIC) and application-specific integrated circuit (ASIC). Out of all these segments and subsections, the power discrete segment is expected to contribute a larger share to the market during the forecast period due to the growing adoption of diodes, transistors, and thyristors and lower energy consumption by specific devices like BJTs, IGBTs, and MOSFETs, and others. Moreover, higher applicability in the industrial sector, low noise emission, and growing adoption of electrical power grids, industrial motor drives, power inverters, and converters bolsters the growth of this segment. On the other hand, the power IC segment will also grow during the forecast period due to increasing application in wireless and satellite communication, electronic warfare, and radio frequency.
Insight by Material
The global power electronics market is also divided by different materials into silicon, silicon carbide, sapphire, gallium nitride, and other segments. Out of these segments, the silicon power electronics segment will contribute a larger share of the market due to low power consumption and higher appropriateness in applications without needing a wide bandgap. Also, the widespread availability of silicon facilitates manufacturing on a large scale, further helping the segment to grow.
Insight by Voltage
According to the voltage, the global power electronics market is divided into low voltage, medium voltage, and high voltage segments. Out of these three segments, the high voltage segment will contribute a larger share of the market due to greater efficiency in executing operations at high current or voltage and faster switching rate.
Insight by Industry Vertical
Different industry verticals also divide the global power electronics market into consumer electronics, industrial, automotive, transportation, ICT, aerospace & defense, energy & power, and other segments. Out of these segments, the consumer electronics segment is expected to surpass others in terms of growth during the forecast period due to growing adoption in emerging economies of specific consumer electronics devices like smartphones, tablets, and smart wearables and higher usage in home appliances. The automotive sector is also expected to grow due to the notable impact on this industry during the forecast period due to the temporary shutdown of factories, supply chain disruption, and lower buyer confidence, all of which result in higher demand for energy-efficient hybrid EVs due to strict government policies.
Global Power Electronics Market Report Coverage
|
Report Metric
|
Details
|
|
Historical Period
|
2020 - 2024
|
|
Base Year Considered
|
2025
|
|
Forecast Period
|
2026 - 2035
|
|
Market Size in 2025
|
U.S.D. 30.6 Billion
|
|
Revenue Forecast in 2035
|
U.S.D. 54.9 Billion
|
|
Growth Rate
|
4.5%
|
|
Segments Covered in the Report
|
By Device Type, By Material, and By Voltage, By Industry Vertical
|
|
Report Scope
|
Market Trends, Drivers, and Restraints; Revenue Estimation and Forecast; Segmentation Analysis; Companies’ Strategic Developments; Market Share Analysis of Key Players; Company Profiling
|
|
Regions Covered in the Report
|
North America, Europe, Asia-Pacific, Middle East, and Rest of the World
|
Industry Dynamics
Power Electronics Industry Trends
There are notable changes and trends within the power electronics market, and one of the most notable trends is the growing adoption of automation and Industry 4.0 practices. Manufacturers also invest huge amounts in research and development practices. Add to that, governments now are also more supportive and designing policies to promote market growth. Another significant change in the application of this technology is the advent of microprocessors and semiconductor devices. Furthermore, innovations are facilitated due to the development and higher usage of wide bandgap (WBG) semiconductor devices, which is the result of the growing adoption of superior materials like SiC, GaN, and others.
Power Electronics Market Growth Drivers
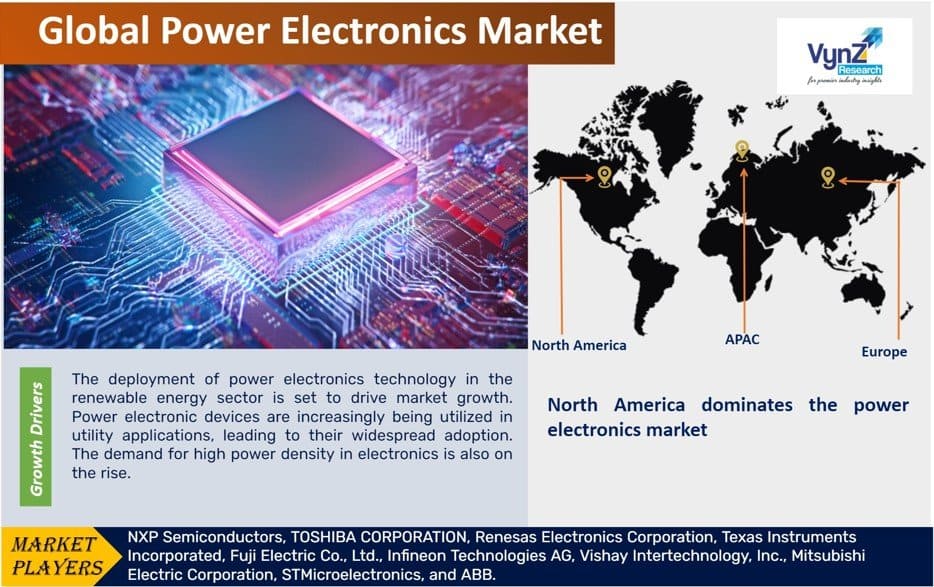
The most significant growth driver of the global power electronics market is the higher deployment of technology in the renewable energy sector and utility applications. The wide adoption of this technology due to the growing need for high power density in electronics, as well as the growing demand for SiC-based photovoltaic cells in developing economies such as India, China, and Brazil, are also promoting market growth. Furthermore, the rise in the number of hyper-scale data centers that need more efficient power solutions further boosts market expansion. Also, the significant benefits of using power electronic devices include high performance, higher electrical stability, and efficient energy consumption, as well as promoting market growth, allowing electrified vehicle applications and battery-powered portable devices to contribute to market growth.
Power Electronics Market Challenges
The primary factor hindering the market growth is the complexities involved in the integration process of advanced electronic devices, which raises the implementation costs significantly due to requirements of specific expertise, methodology, skills, and toolsets. Some other notable challenges include leakage of current, especially at high temperatures, the high cost of infrastructure deployment, and the frequent changes in demand for more efficient and compact devices at low cost, which the manufacturers find difficult to cope with.
Power Electronics Market Opportunities
The growth opportunities lie in the growing demand for plug-in electric vehicles (PEVs) and rapid industrialization drives in developing economies. Growth opportunities are also offered by usage of power devices by smart grids to promote energy conservation and the development of power MOSFET.
Power Electronics Market Geographic Overview
North America is expected to dominate the global power electronics market due to strong 5G infrastructure and its further development, growing industrial automation practices, and rising number of networks of charging stations in the region.
The APAC market, on the other hand, is expected to grow fast due to a large number of consumer electronics, automotive, ICT, and industrial sectors in developing countries like China, Japan, and South Korea. It is also attributed to the growing demand for power generation, rising population in developing countries like India and China, supportive government initiatives to promote renewable energy infrastructure, higher deployment of communication infrastructure, and presence of industry majors like BYD, Huawei, Mitsubishi Electric, Fuji Electric, Toshiba and others.
Power Electronics Market Competitive Insight
The industry players are focusing on novel product development and innovations in power electronics to have a competitive edge in the market. They are emphasizing enhancing device packaging, growing current density, enhancing energy efficiency, and accomplishing low noise operations. The industry players are focusing on strategies like acquisitions, market analysis, partnerships, collaborations, and new ventures to remain competitive in the market.
Toshiba provides a diverse range of semiconductor products and designs that are innovative, high-quality, and efficient. Toshiba manufactures an extensive range of single-phase and three-phase uninterruptible power supply (UPS) solutions and accessories that provide superior performance. For renewable energy applications, TIC Power Electronics is a home for SCiB Rechargeable Battery and the E1000 Energy Management System.
Infineon Technologies offers an extensive variety of products and includes microcontrollers, LED drivers, sensors, and Automotive & Power Management ICs. With the addition of gallium nitride, Infineon now has the sole full-spectrum portfolio of all power technologies – silicon (Si), silicon carbide (SiC), and gallium nitride (GaN). They provide highly reliable IGBTs, power MOSFETs, GaN e-mode HEMTs, power discrete, protected switches, Si drivers, GaN drivers, IGBT modules, intelligent power modules (IPMs), linear regulators, motor control solutions, LED drivers, and all forms of AC-DC, DC-DC, and digital power conversion from microamps to megawatts.
The prominent players in the power electronics market include NXP Semiconductors, TOSHIBA CORPORATION, Renesas Electronics Corporation, Texas Instruments Incorporated, Fuji Electric Co., Ltd., Infineon Technologies AG, Vishay Intertechnology, Inc., Mitsubishi Electric Corporation, STMicroelectronics, and ABB.
Recent Developments by Key Players
Renesas Electronics Corporation (a premier supplier of advanced semiconductor solutions) has acquired Transphorm, Inc. (a global leader in gallium nitride (GaN)) to offer GaN-based power products and related reference designs to meet the rising demand for wide bandgap (WBG) semiconductor products.
Mitsubishi Electric Corporation has partnered with Nexperia B.V. to develop silicon carbide (SiC) power semiconductors for the power electronics market. Industry sources added that Mitsubishi Electric will leverage its wide-bandgap semiconductor technologies to develop and supply SiC MOSFET chips that Nexperia will use to develop SiC discrete devices.
The Power Electronics Market report offers a comprehensive market segmentation analysis along with an estimation for the forecast period 2025–2030.
Segments Covered in the Report
- By Device Type
- Power Discrete
- Diode
- Transistors
- Thyristor
- Power Modules
- Intelligent Power Modules
- Power Integrated Modules
- Power IC
- Power Management Integrated Circuit (PMIC)
- Application-Specific Integrated Circuit (ASIC)
- By Material
- Silicon
- Silicon Carbide
- Sapphire
- Gallium Nitride
- Others
- By Voltage
- Low Voltage
- Medium Voltage
- High Voltage
- By Industry Vertical
- Consumer Electronics
- Industrial
- Automotive & Transportation
- ICT
- Aerospace & Defense
- Energy & Power
- Others
Region Covered in the Report
- North America
- Europe
- Germany
- U.K.
- France
- Italy
- Spain
- Russia
- Rest of Europe
- Asia-Pacific (APAC)
- China
- Japan
- India
- South Korea
- Rest of Asia-Pacific
- Rest of the World (RoW)
- Brazil
- Saudi Arabia
- South Africa
- U.A.E.
- Other Countries
.png "Power Electronics Market Size and Market Analysis")
Source: VynZ Research
