Status : Published | Published On : Dec, 2023 | Report Code : VRCH2088 | Industry : Chemicals & Materials | Available Format : | Page : 250 |
Industry Overview
The global polylactic acid (PLA) market is anticipated to grow from USD 2.1 billion in 2023 to USD 6.2 billion by 2030, registering a CAGR of 18.3% during the forecast period 2025-2030. PLA is an aliphatic, linear polyester made from lactic acid monomers. It's biodegradable and similar to polypropylene (PP), polyethylene (PE), and polystyrene (PS) (PS). It's the most common sort of biodegradable plastic, made from renewable resources like maize starch, tapioca roots, chips, starch, or sugarcane. PLA is non-toxic and environmentally friendly owing to these renewable raw materials. It is witnessing robust growth owing to PLA's extensive application in the textile, transport, medical, packaging, and electronics industries.
The COVID-19 pandemic has had a positive impact on the polylactic acid market owing to its increased adoption in the packaging industry. The packaged industry's demand has risen significantly as a result of increasing social distance and contactless activities. To ensure maximum hygiene and safety, people are increasingly resorting to packaged goods. Food and beverages have high demand when packed with all of the essential precautions.
Market Segmentation
Insight by Grade
Based on grade, the global polylactic acid market is segmented into thermoforming, extrusion, injection molding, and blow molding. The thermoforming grade category is anticipated to contribute to the largest share of the market as it has huge growth opportunities in several packaging applications like food & beverages, and other consumer products. PLA thermoformed parts have outstanding clarity, as compared to those formed by oriented polystyrene (OPS) and polyethylene terephthalate (PET). Owing to the need for proper temperature requirements for product storage along with thermoformed PL, thus suitable for food packaging trays for baked products, fruits, and vegetables.
Insight by Raw Material
Based on raw material, the global polylactic acid market is segregated into cassava, cornstarch, sugarcane sugar beet, and others. Cornstarch is anticipated to contribute the largest share during 2025-2030 as they are cost-effective and biodegradable.
Insight by Product Type
Based on product type, the global polylactic acid market is segmented into Racemic PPLA, Regular PLLA, PDLA, PDLLA. PDLLA is anticipated to grow at a faster pace as it is adopted in dentistry for regenerative procedures such as pins, screws, and membranes. Furthermore, it offers a high rate of absorption and is used in orthopedic implants.
Insight by End-Use Vertical
Based on end-use vertical, the global polylactic acid market is classified into packaging, textiles, agriculture, biomedical, electronics, and others. Packaging dominates the polylactic acid market owing to the rising demand for sustainable solutions in various industries like e-commerce, FMCG, and food & beverages. The increased demand for packaged foods, snacks, ready-to-eat meals, etc, will drive the growth in the packaging industry for polylactic acid. Furthermore, the increased demand for flexible packaging will also drive its growth. Microwaveable containers, such as disposable silverware and food containers, are mostly made of polylactic acid. The advantages of packaging containers, like aesthetic appeal, greater printability, and grease and oil resistance, are driving up demand for PLA in the formulation of food packaging solutions around the world.
Polylactic Acid Market Report Coverage
Report Metric |
Details |
Historical Period |
2018–2023 |
Base Year Considered |
2024 |
Forecast Period |
2025 - 2030 |
Market Size in 2023 |
$2.1 Billion |
Revenue Forecast in 2030 |
$6.2 Billion |
Growth Rate |
CAGR 18.3% |
Segments Covered in the Report |
By Grade By Raw Material By Product Type By End Use-Vertical |
Report Scope |
Market Trends, Drivers, and Restraints; Revenue Estimation and Forecast; Segmentation Analysis; Impact of COVID-19; Companies’ Strategic Developments; Market Share Analysis of Key Players; Company Profiling |
Regions Covered in the Report |
North America, Europe, Asia-Pacific, Middle East, and Rest of the World |
Industry Dynamics
Industry Trends
The companies and the key players in the industry are emphasizing the increased capacity addition of polylactic acid, thus this trend will proliferate the growth of the polylactic acid market during the forecast period 2025-2030.
Growth Drivers
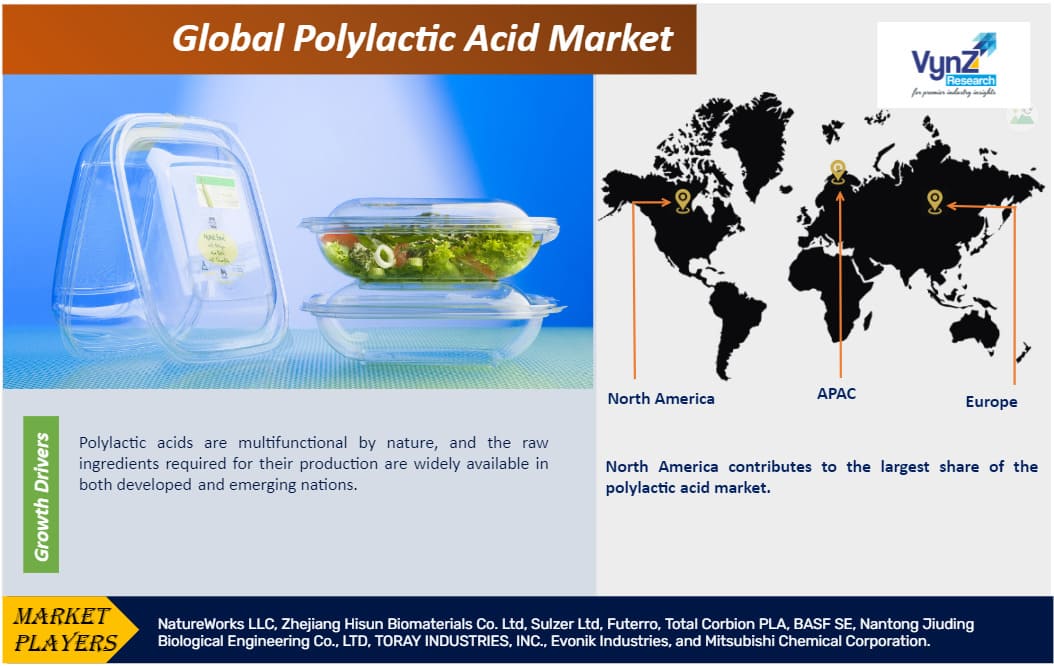
Polylactic acids are multifunctional by nature, and the raw ingredients required for their production are widely available in both developed and emerging nations. PLA has excellent processing qualities, high transparency, and good mechanical properties. Factors attributing to the growth of the polylactic acid market include rapid industrialization, rising adoption in the packaging industry, mounting demand for polylactic acid in additive manufacturing, initiatives by the government to support PLA, rising preference for biodegradable plastics, and rising investment in research and development activities will proliferate the growth of the market. Also, the increased environmental awareness, ease in availability, low cost of raw material, reduced carbon emissions produced by PLA than conventional plastics, rising demand from personal care and cosmetics, and technological development will further accelerate the growth of the market. Its large-scale deployment in rigid containers used to store yogurt, juice, water, and a variety of other food products is projected to drive demand in the future. PLA is also used clinically as a biomedical scaffold for implants, medication delivery systems, and theranostics. Thus, the innovative applications provided by polylactic acid will create promising growth aspects for the key players in the functioning of the polylactic acid market.
Challenges
The increased production cost, the requirement for industrial composting, and the prevalence of competitive renewable packaging options like Bio-PE, PHA, and Bio-PET will hamper the growth of the market.
Opportunities
The increased prominence of novel applications such as coated cellophane, non-woven fibers, active packaging, agricultural mulching, etc. are being adopted in several industry verticals like agriculture, electronics, food & beverage packaging, biomedical, textiles, etc. will create lucrative opportunities for growth in the polylactic acid market. Furthermore, the increased production of genetically modified corn and increased adoption of Bio-PLA in 3D printing will offer growth avenues in the PLA market.
Geographic Overview
North America contributes to the largest share of the polylactic acid market as most of the PLA production facilities are located in North America. Moreover, subsidies offered by the government to adopt environmentally friendly products, rising demand for bioplastics, and technological development will accelerate the growth in the region.
Europe is anticipated to have substantial growth in terms of consumption owing to support from the government and rising consumer awareness about sustainability.
Competitive Insight
The industry players are adopting various strategies to sustain themselves in the polylactic acid market by going for M&A, collaborations, joint ventures, partnerships, establishing new production processes, establishing new product lines, and making improvements to existing products in the polylactic acid market.
Sulzer offers up an entire plant solution for PLA manufacturing. Sulzer's unique SMRTM technology and equipment are used to polymerize lactide monomers in a continuous, fully integrated process. Sulzer is collaborating with Futerro and Technip Energies to develop sugar-to-PLA plants.
FUTERRO S.A. is a well-known Belgian company that was one of the first to work on the invention of lactic acid and polylactic acid (PLA) in 1992. Futerro has vast industrial experience in the synthesis of lactic acid and PLA on various substrates, and it is constantly improving its methods to produce high-quality PLA with better properties: RENEWTM.
In January 2022, NatureWorks' latest biopolymer manufacturing plant, which will be located in the Nakhon Sawan Biocomplex in Thailand, will receive bespoke state-of-the-art production technology from Sulzer. The fully integrated plant, which was designed to meet the growing global demand for polylactic acid (PLA) bioplastics, will use Sulzer Chemtech's advanced lactide purification and polymer production technology to produce 75'000 tonnes of Ingeo polylactic acid (PLA) per year, which is used in applications such as compostable food packaging acid (PLA) annually, which is used in applications like compostable food packaging.
In November 2021, Danimer Scientific, Inc. and Total Corbion PLA, two leading bioplastics firms focused on the discovery and production of biodegradable materials, announced a long-term collaboration for the supply of Luminy® PLA, a biobased polymer used to make compostable products.
In August 2021, NatureWorks, one of the world's leading manufacturers of low-carbon PLA biopolymers made from renewable resources, announced the completion of their global manufacturing expansion plan for a new fully integrated IngeoTM PLA production facility in Thailand, which is expected to open in 2024. When fully operational, the new factory will have a capacity of 75,000 tonnes of Ingeo biopolymer per year and will be capable of producing the whole Ingeo grade portfolio.
Some of the major industry players in the global polylactic acid market include NatureWorks LLC, Zhejiang Hisun Biomaterials Co. Ltd, Sulzer Ltd, Futerro, Total Corbion PLA, BASF SE, Nantong Jiuding Biological Engineering Co., LTD, TORAY INDUSTRIES, INC., Evonik Industries, and Mitsubishi Chemical Corporation.
Region Covered in the Report
• North America
- U.S.
- Canada
- Mexico
• Europe
- Germany
- U.K.
- France
- Italy
- Spain
- Russia
- Rest of Europe
• Asia-Pacific (APAC)
- China
- Japan
- India
- South Korea
- Rest of Asia-Pacific
• Rest of the World (RoW)
- Brazil
- Saudi Arabia
- South Africa
- U.A.E.
- Other Countries
1. Research Overview
1.1. The Report Offers
1.2. Market Coverage
1.2.1. By Grade
1.2.2. By Raw Material
1.2.3. By Product Type
1.2.4. By End Use-Vertical
1.2.5. By Region
1.3. Research Phases
1.4. Limitations
1.5. Market Methodology
1.5.1. Data Sources
1.5.1.1. Primary Research
1.5.1.2. Secondary Research
1.5.2. Methodology
1.5.2.1. Data Exploration
1.5.2.2. Forecast Parameters
1.5.2.3. Data Validation
1.5.2.4. Assumptions
1.5.3. Study Period & Data Reporting Unit
2. Executive Summary
3. Industry Overview
3.1. Industry Dynamics
3.1.1. Market Growth Drivers
3.1.2. Market Restraints
3.1.3. Key Market Trends
3.1.4. Major Opportunities
3.2. Industry Ecosystem
3.2.1. Porter’s Five Forces Analysis
3.2.2. Recent Development Analysis
3.2.3. Value Chain Analysis
3.3. Competitive Insight
3.3.1. Competitive Position of Industry Players
3.3.2. Market Attractive Analysis
3.3.3. Market Share Analysis
4. Global Market Estimate and Forecast
4.1. Global Market Overview
4.2. Global Market Estimate and Forecast to 2030
5. Market Segmentation Estimate and Forecast
5.1. By Grade
5.1.1. Thermoforming
5.1.1.1. Market Definition
5.1.1.2. Market Estimation and Forecast to 2030
5.1.2. Extrusion
5.1.2.1. Market Definition
5.1.2.2. Market Estimation and Forecast to 2030
5.1.3. Injection Molding
5.1.3.1. Market Definition
5.1.3.2. Market Estimation and Forecast to 2030
5.1.4. Blow Molding
5.1.4.1. Market Definition
5.1.4.2. Market Estimation and Forecast to 2030
5.2. By Raw Material
5.2.1. Cassava
5.2.1.1. Market Definition
5.2.1.2. Market Estimation and Forecast to 2030
5.2.2. Cornstarch
5.2.2.1. Market Definition
5.2.2.2. Market Estimation and Forecast to 2030
5.2.3. Sugarcane and Sugar Beet
5.2.3.1. Market Definition
5.2.3.2. Market Estimation and Forecast to 2030
5.2.4. Others
5.2.4.1. Market Definition
5.2.4.2. Market Estimation and Forecast to 2030
5.3. By Product Type
5.3.1. Racemic PPLA
5.3.1.1. Market Definition
5.3.1.2. Market Estimation and Forecast to 2030
5.3.2. Regular PLLA
5.3.2.1. Market Definition
5.3.2.2. Market Estimation and Forecast to 2030
5.3.3. PDLA
5.3.3.1. Market Definition
5.3.3.2. Market Estimation and Forecast to 2030
5.3.4. PDLLA
5.3.4.1. Market Definition
5.3.4.2. Market Estimation and Forecast to 2030
5.4. By End Use-Vertical
5.4.1. Packaging
5.4.1.1. Market Definition
5.4.1.2. Market Estimation and Forecast to 2030
5.4.2. Textiles
5.4.2.1. Market Definition
5.4.2.2. Market Estimation and Forecast to 2030
5.4.3. Agriculture
5.4.3.1. Market Definition
5.4.3.2. Market Estimation and Forecast to 2030
5.4.4. Biomedical
5.4.4.1. Market Definition
5.4.4.2. Market Estimation and Forecast to 2030
5.4.5. Electronics
5.4.5.1. Market Definition
5.4.5.2. Market Estimation and Forecast to 2030
5.4.6. Others
5.4.6.1. Market Definition
5.4.6.2. Market Estimation and Forecast to 2030
6. North America Market Estimate and Forecast
6.1. By Grade
6.2. By Raw Material
6.3. By Product Type
6.4. By End Use-Vertical
6.5. By Country – U.S., Canada, and Mexico
6.5.1. U.S. Market Estimate and Forecast
6.5.2. Canada Market Estimate and Forecast
6.5.3. Mexico Market Estimate and Forecast
7. Europe Market Estimate and Forecast
7.1. By Grade
7.2. By Raw Material
7.3. By Product Type
7.4. By End Use-Vertical
7.5. By Country – Germany, U.K., France, Italy, Spain, Russia, and Rest of Europe
7.5.1. Germany Market Estimate and Forecast
7.5.2. France Market Estimate and Forecast
7.5.3. U.K. Market Estimate and Forecast
7.5.4. Italy Market Estimate and Forecast
7.5.5. Spain Market Estimate and Forecast
7.5.6. Rest of Europe Market Estimate and Forecast
8. Asia-Pacific Market Estimate and Forecast
8.1. By Grade
8.2. By Raw Material
8.3. By Product Type
8.4. By End Use-Vertical
8.5. By Country – China, Japan, India, South Korea, and Rest of Asia-Pacific
8.5.1. China Market Estimate and Forecast
8.5.2. Japan Market Estimate and Forecast
8.5.3. India Market Estimate and Forecast
8.5.4. South Korea Market Estimate and Forecast
8.5.5. Singapore Market Estimate and Forecast
8.5.6. Rest of Asia-Pacific Market Estimate and Forecast
9. Rest of the World (RoW) Market Estimate and Forecast
9.1. By Grade
9.2. By Raw Material
9.3. By Product Type
9.4. By End Use-Vertical
9.5. By Country – Brazil, Saudi Arabia, South Africa, U.A.E., and Other Countries
9.5.1. Brazil Market Estimate and Forecast
9.5.2. Saudi Arabia Market Estimate and Forecast
9.5.3. South Africa Market Estimate and Forecast
9.5.4. Other Countries Market Estimate and Forecast
10. Company Profiles
10.1. NatureWorks LLC
10.1.1. Snapshot
10.1.2. Overview
10.1.3. Offerings
10.1.4. Financial Insight
10.1.5. Recent Developments
10.2. Zhejiang Hisun Biomaterials Co. Ltd
10.2.1. Snapshot
10.2.2. Overview
10.2.3. Offerings
10.2.4. Financial Insight
10.2.5. Recent Developments
10.3. Sulzer Ltd
10.3.1. Snapshot
10.3.2. Overview
10.3.3. Offerings
10.3.4. Financial Insight
10.3.5. Recent Developments
10.4. Futerro
10.4.1. Snapshot
10.4.2. Overview
10.4.3. Offerings
10.4.4. Financial Insight
10.4.5. Recent Developments
10.5. Total Corbion PLA
10.5.1. Snapshot
10.5.2. Overview
10.5.3. Offerings
10.5.4. Financial Insight
10.5.5. Recent Developments
10.6. BASF SE
10.6.1. Snapshot
10.6.2. Overview
10.6.3. Offerings
10.6.4. Financial Insight
10.6.5. Recent Developments
10.7. Nantong Jiuding Biological Engineering Co., LTD
10.7.1. Snapshot
10.7.2. Overview
10.7.3. Offerings
10.7.4. Financial Insight
10.7.5. Recent Developments
10.8. TORAY INDUSTRIES, INC.
10.8.1. Snapshot
10.8.2. Overview
10.8.3. Offerings
10.8.4. Financial Insight
10.8.5. Recent Developments
10.9. Evonik Industries
10.9.1. Snapshot
10.9.2. Overview
10.9.3. Offerings
10.9.4. Financial Insight
10.9.5. Recent Developments
10.10. Evonik Industries
10.10.1. Snapshot
10.10.2. Overview
10.10.3. Offerings
10.10.4. Financial Insight
10.10.5. Recent Developments
11. Appendix
11.1. Exchange Rates
11.2. Abbreviations
Note: Financial insight and recent developments of different companies are subject to the availability of information in the secondary domain.
List of Tables
Table 1 Sources
Table 2 Study Periods
Table 3 Data Reporting Unit
Table 4 Global Polylactic Acid Market, By Grade, 2018-2023 (USD Billion)
Table 5 Global Polylactic Acid Market, By Grade, 2025-2030(USD Billion)
Table 6 Global Polylactic Acid Market, By Raw Material, 2018-2023 (USD Billion)
Table 7 Global Polylactic Acid Market, By Raw Material, 2025-2030(USD Billion)
Table 8 Global Polylactic Acid Market, By Product Type, 2018-2023 (USD Billion)
Table 9 Global Polylactic Acid Market, By Product Type, 2025-2030(USD Billion)
Table 10 Global Polylactic Acid Market, By End Use-Vertical, 2018-2023 (USD Billion)
Table 11 Global Polylactic Acid Market, By End Use-Vertical, 2025-2030(USD Billion)
Table 12 Global Polylactic Acid Market, By Region, 2018-2023 (USD Billion)
Table 13 Global Polylactic Acid Market, By Region, 2025-2030(USD Billion)
Table 14 North America Polylactic Acid Market, By Grade, 2018-2023 (USD Billion)
Table 15 North America Polylactic Acid Market, By Grade, 2025-2030(USD Billion)
Table 16 North America Polylactic Acid Market, By Raw Material, 2018-2023 (USD Billion)
Table 17 North America Polylactic Acid Market, By Raw Material, 2025-2030(USD Billion)
Table 18 North America Polylactic Acid Market, By Product Type, 2018-2023 (USD Billion)
Table 19 North America Polylactic Acid Market, By Product Type, 2025-2030(USD Billion)
Table 20 North America Polylactic Acid Market, By End Use-Vertical, 2018-2023 (USD Billion)
Table 21 North America Polylactic Acid Market, By End Use-Vertical, 2025-2030(USD Billion)
Table 22 North America Polylactic Acid Market, By Region, 2018-2023 (USD Billion)
Table 23 North America Polylactic Acid Market, By Region, 2025-2030(USD Billion)
Table 24 Europe Polylactic Acid Market, By Grade, 2018-2023 (USD Billion)
Table 25 Europe Polylactic Acid Market, By Grade, 2025-2030(USD Billion)
Table 26 Europe Polylactic Acid Market, By Raw Material, 2018-2023 (USD Billion)
Table 27 Europe Polylactic Acid Market, By Raw Material, 2025-2030(USD Billion)
Table 28 Europe Polylactic Acid Market, By Product Type, 2018-2023 (USD Billion)
Table 29 Europe Polylactic Acid Market, By Product Type, 2025-2030(USD Billion)
Table 30 Europe Polylactic Acid Market, By End Use-Vertical, 2018-2023 (USD Billion)
Table 31 Europe Polylactic Acid Market, By End Use-Vertical, 2025-2030(USD Billion)
Table 32 Europe Polylactic Acid Market, By Region, 2018-2023 (USD Billion)
Table 33 Europe Polylactic Acid Market, By Region, 2025-2030(USD Billion)
Table 34 Asia-Pacific Polylactic Acid Market, By Grade, 2018-2023 (USD Billion)
Table 35 Asia-Pacific Polylactic Acid Market, By Grade, 2025-2030(USD Billion)
Table 36 Asia-Pacific Polylactic Acid Market, By Raw Material, 2018-2023 (USD Billion)
Table 37 Asia-Pacific Polylactic Acid Market, By Raw Material, 2025-2030(USD Billion)
Table 38 Asia-Pacific Polylactic Acid Market, By Product Type, 2018-2023 (USD Billion)
Table 39 Asia-Pacific Polylactic Acid Market, By Product Type, 2025-2030(USD Billion)
Table 40 Asia-Pacific Polylactic Acid Market, By End Use-Vertical, 2018-2023 (USD Billion)
Table 41 Asia-Pacific Polylactic Acid Market, By End Use-Vertical, 2025-2030(USD Billion)
Table 42 Asia-Pacific Polylactic Acid Market, By Region, 2018-2023 (USD Billion)
Table 43 Asia-Pacific Polylactic Acid Market, By Region, 2025-2030(USD Billion)
Table 44 RoW Polylactic Acid Market, By Grade, 2018-2023 (USD Billion)
Table 45 RoW Polylactic Acid Market, By Grade, 2025-2030(USD Billion)
Table 46 RoW Polylactic Acid Market, By Raw Material, 2018-2023 (USD Billion)
Table 47 RoW Polylactic Acid Market, By Raw Material, 2025-2030(USD Billion)
Table 48 RoW Polylactic Acid Market, By Product Type, 2018-2023 (USD Billion)
Table 49 RoW Polylactic Acid Market, By Product Type, 2025-2030(USD Billion)
Table 50 RoW Polylactic Acid Market, By End Use-Vertical, 2018-2023 (USD Billion)
Table 51 RoW Polylactic Acid Market, By End Use-Vertical, 2025-2030(USD Billion)
Table 52 RoW Polylactic Acid Market, By Region, 2018-2023 (USD Billion)
Table 53 RoW Polylactic Acid Market, By Region, 2025-2030(USD Billion)
Table 54 Snapshot – NatureWorks LLC
Table 55 Snapshot – Zhejiang Hisun Biomaterials Co. Ltd
Table 56 Snapshot – Sulzer Ltd
Table 57 Snapshot – Futerro
Table 58 Snapshot – Total Corbion PLA
Table 59 Snapshot – BASF SE
Table 60 Snapshot – Nantong Jiuding Biological Engineering Co., LTD
Table 61 Snapshot – TORAY INDUSTRIES, INC.
Table 62 Snapshot – Evonik Industries
Table 63 Snapshot – Mitsubishi Chemical Corporation
List of Figures
Figure 1 Market Coverage
Figure 2 Research Phases
Figure 3 Secondary Sources for Different Parameters
Figure 4 Methodology
Figure 5 Data Mining & Exploration
Figure 6 Data Triangulation
Figure 7 Assumptions for Market Estimation and Forecast
Figure 8 Market Synopsis
Figure 9 Global Polylactic Acid Market- Growth Drivers and Restraints
Figure 10 Competitive Benchmark
Figure 11 Global Polylactic Acid Market Highlight
Figure 12 Global Polylactic Acid Market, By Grade, 2018 - 2030 (USD Billion)
Figure 13 Global Polylactic Acid Market, By Raw Material, 2018 - 2030 (USD Billion)
Figure 14 Global Polylactic Acid Market, By Product Type, 2018 - 2030 (USD Billion)
Figure 15 Global Polylactic Acid Market, By End Use-Vertical, 2018 - 2030 (USD Billion)
Figure 16 Global Polylactic Acid Market, By Region, 2018 - 2030 (USD Billion)
Figure 17 North America Polylactic Acid Market Highlight
Figure 18 North America Polylactic Acid Market, By Grade, 2018 - 2030 (USD Billion)
Figure 19 North America Polylactic Acid Market, By Raw Material, 2018 - 2030 (USD Billion)
Figure 20 North America Polylactic Acid Market, By Product Type, 2018 - 2030 (USD Billion)
Figure 21 North America Polylactic Acid Market, By End Use-Vertical, 2018 - 2030 (USD Billion)
Figure 22 North America Polylactic Acid Market, By Region, 2018 - 2030 (USD Billion)
Figure 23 Europe Polylactic Acid Market Highlight
Figure 24 Europe Polylactic Acid Market, By Grade, 2018 - 2030 (USD Billion)
Figure 25 Europe Polylactic Acid Market, By Raw Material, 2018 - 2030 (USD Billion)
Figure 26 Europe Polylactic Acid Market, By Product Type, 2018 - 2030 (USD Billion)
Figure 27 Europe Polylactic Acid Market, By End Use-Vertical, 2018 - 2030 (USD Billion)
Figure 28 Europe Polylactic Acid Market, By Region, 2018 - 2030 (USD Billion)
Figure 29 Asia-Pacific Polylactic Acid Market Highlight
Figure 30 Asia-Pacific Polylactic Acid Market, By Grade, 2018 - 2030 (USD Billion)
Figure 31 Asia-Pacific Polylactic Acid Market, By Raw Material, 2018 - 2030 (USD Billion)
Figure 32 Asia-Pacific Polylactic Acid Market, By Product Type, 2018 - 2030 (USD Billion)
Figure 33 Asia-Pacific Polylactic Acid Market, By End Use-Vertical, 2018 - 2030 (USD Billion)
Figure 34 Asia-Pacific Polylactic Acid Market, By Region, 2018 - 2030 (USD Billion)
Figure 35 RoW Polylactic Acid Market Highlight
Figure 36 RoW Polylactic Acid Market, By Grade, 2018 - 2030 (USD Billion)
Figure 37 RoW Polylactic Acid Market, By Raw Material, 2018 - 2030 (USD Billion)
Figure 38 RoW Polylactic Acid Market, By Product Type, 2018 - 2030 (USD Billion)
Figure 39 RoW Polylactic Acid Market, By End Use-Vertical, 2018 - 2030 (USD Billion)
Figure 40 RoW Polylactic Acid Market, By Region, 2018 - 2030 (USD Billion)
Global Polylactic Acid Market Coverage
Grade Insight and Forecast 2025-2030
Raw Material Insight and Forecast 2025-2030
Product Type Insight and Forecast 2025-2030
End Use-Vertical Insight and Forecast 2025-2030
Geographical Segmentation
Polylactic Acid Market by Region
North America
Europe
Asia-Pacific (APAC)
Rest of the World (RoW)
Vynz Research know in your business needs, you required specific answers pertaining to the market, Hence, our experts and analyst can provide you the customized research support on your specific needs.
After the purchase of current report, you can claim certain degree of free customization within the scope of the research.
Please let us know, how we can serve you better with your specific requirements to your research needs. Vynz research promises for quick reversal for your current business requirements.