Solar Panel Recycling Market Overview
The global Solar Panel Recycling Market size is expected to grow from USD 0.16 billion in 2023 to USD 1.54 billion by 2030. It will witness a 19.8% CAGR during the forecast period.
Despite the hazardous substances in the solar panels, such as silver, silicon, silver, aluminum, lead, copper, gallium, and cadmium, its use has been growing significantly. As a result, there is an immediate need for recycling waste to minimize its impact on the environment. The process of recycling solar panels involves decommissioning, collecting, and sorting. It also includes reducing Greenhouse Gas (GHG) emissions from Photovoltaic (PV) modules. Add to that, the release of toxic materials from the waste streams is also prevented.
Recycling is the best solution to make solar panels and their components reusable. This will significantly reduce adverse impacts on the environment. With increased importance on sustainable development and alternative energy sources, the solar panel recycling market is expected to grow notably during the forecast period.
Global Solar Panel Recycling Market Report Coverage
|
Report Metric
|
Details
|
|
Historical Period
|
2020 - 2024
|
|
Base Year Considered
|
2025
|
|
Forecast Period
|
2026 - 2035
|
|
Market Size in 2025
|
U.S.D. 0.16 Billion
|
|
Revenue Forecast in 2035
|
U.S.D. 1.54 Billion
|
|
Growth Rate
|
19.8%
|
|
Segments Covered in the Report
|
By Process, By Product and By Shelf Life
|
|
Report Scope
|
Market Trends, Drivers, and Restraints; Revenue Estimation and Forecast; Segmentation Analysis; Companies’ Strategic Developments; Market Share Analysis of Key Players; Company Profiling
|
|
Regions Covered in the Report
|
North America, Europe, Asia-Pacific, Middle East, and Rest of the World
|
Market Segmentation
Insight by Process
According to the diverse processes, the solar panel recycling marketcan be divided into Mechanical, thermal, chemical, and laser. Out of these, the mechanical process segment contributes more than the others due to its cost-effectiveness and environmental-friendly nature.
Insight by Product
Based on the product, the market can be divided into monocrystalline, polycrystalline, thin film, and more. Out of all these, monocrystalline contributes to the largest share due to significant benefits offered, such as higher efficiency, better materials, more durability, better heat resistance, and space efficiency.
Insight by Shelf Life
Based on shelf life, the market is divided into normal and early loss. The early loss shelf-life segment dominates the market. This is due to deterioration and early weathering of the solar panels. It is mainly caused due to adverse weather conditions, higher maintenance needs and issues involved in it, and lack of standardization of products.
Industry Dynamics
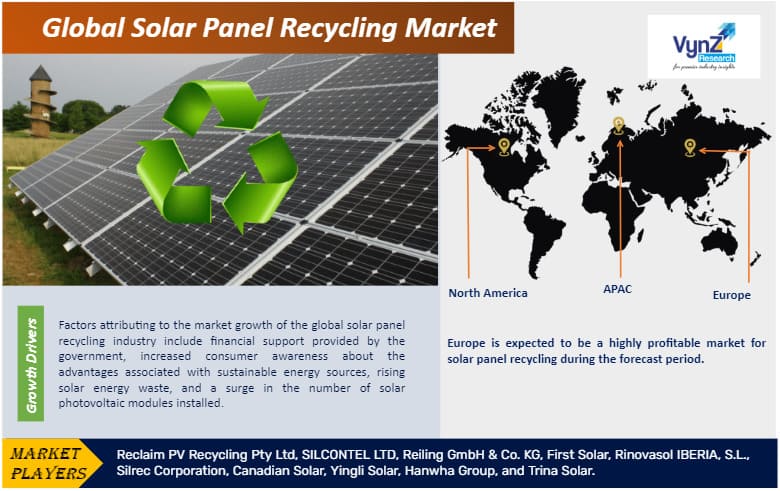
Growth Drivers
There has been a significant technological development in the area and several manufacturers now purify the salvaged materials and use them in new panels, glass foam, and other components. This results in cost-effectiveness. These factors will boost the use of solar panels, and as a result, boost the market.
Moreover, there has been a growing demand for renewable energy during the forecast period due to the energy crisis all over the globe, growing environmental impacts and concerns over nuclear energy, and depleting traditional energy sources such as fossil fuels. This will boost the market growth.
The cost of solar panels is also decreasing steadily which has increased the installation of PV modules significantly, thereby supporting the growth of this market. The governments also provide financial support to the users of solar panels as well as the recycling industry. The government regulations imposed also influence the market growth.
Also, people now know the benefits of using renewable and sustainable energy sources apart from cost-effectiveness. There has been a significant rise in solar waste materials which calls for faster recycling to reduce environmental impacts.Different companies have invested more in research and development to find better ways to salvage and recycle infrequent metal elements. All these account for the growth of the solar panel recycling market.
Restraints
There is a notable lack of awareness among the users about the possibilities and need for recycling solar panels. Economies have been emerging significantly and users have more interest in them. Also, the cost of recovered or salvaged scraps is much less than the original cost which does not motivate users. However, during the forecast period, these challenges will hardly affect the growth of this market due to the rising demand.
Opportunities
The opportunities for expansion of recycled solar panels are however created by the rapid and continuous technological development, modernization, improved production techniques, and higher adoption in developing countries like India, China, South Korea, and others.
Continual research and development in this sector will also promote its growth because there will be more opportunities created in the solar panel recycling industry. As a result, manufacturing companies will explore the untapped markets and countries with their products to increase their operational footprints, market share, and market size.
Geographic Overview
- North America
- Europe
- Asia Pacific (APAC)
- Rest of the World (RoW)
Out of these four regions, the European market seems to be more promising and profitable. During the forecast period, there will be a large number of installations, which will be boosted with the continual support from the government for adopting renewable energy sources. Moreover, the legislation is more favorable in this region regarding control of recycling processes, which drives more players in the European market. All these factors, along with the growing demand for distributed energy systems havepushed the demand for installing solar panels higher up in countries like the UK, Italy, Germany, and Spain. As a result, this will boost the growth of the global solar panel recycling market during this period.
Competitive Insight
The global solar panel recycling market is highly competitive as there are a small number of large-scale vendors that control the maximum share. Moreover, owing to the solar panel recycling market's significant growth prospects, new manufacturers and service providers are also entering the industry. New entrants have ample opportunities to obtain a competitive edge in the market because of ongoing R&D efforts to create more effective recycling methods and technologies. Nevertheless, partnerships and acquisitions present a large market opportunity for key players to thrive.
Key Players Covered in the Report
Some of the key players operating in the Global Solar Panel Recycling Industry include Reclaim PV Recycling Pty Ltd, SILCONTEL LTD, Reiling GmbH & Co. KG, First Solar, Rinovasol IBERIA, S.L., Silrec Corporation, Canadian Solar, Yingli Solar, Hanwha Group, and Trina Solar.
Recent Developments by Key Players
Reiling (The waste management company) is expanding its capacities to recycle old silicon-based modules. Reiling recycled around 6,000 tonnes of end-of-life photovoltaic modules to recover silicon or silver. By 2030, a cumulative 400,000 tonnes are expected to have to be disposed of in Germany alone. Repowering of solar parks, where old modules are replaced by new, more powerful panels is also done. At the same time, demand for second-life modules is expected to increase.
First Solar (US-based photovoltaic modules manufacturer has inaugurated its vertically integrated solar manufacturing facility in Tamil Nadu. This facility shall have an annual capacity of 3.3 GW focusing on the production of first solar's series 7 PV solar modules.
The Solar Panel Recycling Market report offers a comprehensive market segmentation analysis along with an estimation for the forecast period 2025–2030.
Segments Covered in the Report
- By Process
- Thermal
- Mechanical
- Chemical
- Laser
- By Product
- Monocrystalline
- Polycrystalline
- Thin Film
- Others
- By Shelf Life
Region Covered in the Report
- North America
- Europe
- Germany
- U.K.
- France
- Italy
- Spain
- Russia
- Rest of Europe
- Asia-Pacific (APAC)
- China
- Japan
- India
- South Korea
- Rest of Asia-Pacific
- Rest of the World (RoW)
- Brazil
- Saudi Arabia
- South Africa
- U.A.E.
- Other Countries
.png "Solar Panel Recycling Market Size")
Source: VynZ Research
.png "Solar Panel Recycling Market Analysis")
Source: VynZ Research
